Redington Shores, FL Investment Properties for Sale
Browse homes for sale and investment properties in Redington Shores, FL. Refine your search by price, property type, or more.
Best cash flowing properties in Redington Shores, FL
Active
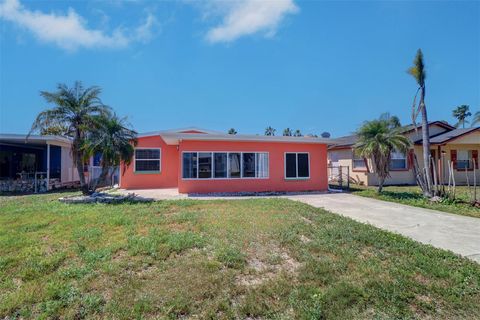
$394,000
3
bds
|
2
ba
|
1,256
sqft
|
built
1960
763 182nd Ave E, Redington Shores, FL 33708
$-258
Cash flow
-3.4%
Cash-on-Cash Return
5.4%
Cap rate
0.8%
Rent to Value Ratio

Active
$499,000
1
bds
|
2
ba
|
1,060
sqft
|
built
1974
17920 Gulf Blvd, Redington Shores, FL 33708
$-261
Cash flow
-2.7%
Cash-on-Cash Return
5.5%
Cap rate
0.7%
Rent to Value Ratio
42 out of 52 properties for sale in Redington Shores, FL
Limited Results Shown
Create a free account, or log in to reveal all property listings and enjoy the complete experience.
Active
$7,995,000
5
bds
|
6
ba
|
4,356
sqft
|
built
2016
17824 Lee Ave, Redington Shores, FL 33708
$-39,402
Cash flow
-25.7%
Cash-on-Cash Return
0.2%
Cap rate
0.1%
Rent to Value Ratio
Active
$1,499,999
4
bds
|
4
ba
|
3,020
sqft
|
built
2007
17745 Gulf Blvd, Redington Shores, FL 33708
$-4,345
Cash flow
-15.1%
Cash-on-Cash Return
2.7%
Cap rate
0.5%
Rent to Value Ratio
Active
$989,900
3
bds
|
3
ba
|
2,680
sqft
|
built
2008
17821 Gulf Blvd, Redington Shores, FL 33708
$-3,300
Cash flow
-17.4%
Cash-on-Cash Return
2.1%
Cap rate
0.4%
Rent to Value Ratio
Active
$649,900
2
bds
|
2
ba
|
1,103
sqft
|
built
1972
17580 Gulf Blvd, Redington Shores, FL 33708
$-1,732
Cash flow
-13.9%
Cash-on-Cash Return
2.9%
Cap rate
0.5%
Rent to Value Ratio

Active
$849,900
3
bds
|
3
ba
|
2,544
sqft
|
built
2009
146 175th Terrace Dr E, Redington Shores, FL 33708
$-2,170
Cash flow
-13.3%
Cash-on-Cash Return
3.1%
Cap rate
0.5%
Rent to Value Ratio

Active
$949,000
3
bds
|
3
ba
|
1,995
sqft
|
built
2007
17735 Gulf Blvd, Redington Shores, FL 33708
$-2,920
Cash flow
-16.1%
Cash-on-Cash Return
2.5%
Cap rate
0.4%
Rent to Value Ratio

Active
$599,000
2
bds
|
2
ba
|
1,070
sqft
|
built
1970
17400 Gulf Blvd, Redington Shores, FL 33708
$-950
Cash flow
-8.3%
Cash-on-Cash Return
4.2%
Cap rate
0.6%
Rent to Value Ratio
Active
$829,000
2
bds
|
2
ba
|
1,165
sqft
|
built
1980
17900 Gulf Blvd, Redington Shores, FL 33708
$-3,202
Cash flow
-20.2%
Cash-on-Cash Return
1.5%
Cap rate
0.4%
Rent to Value Ratio
Active
$2,900,000
5
bds
|
8
ba
|
3,354
sqft
|
built
1951
122 Coral Ave, Redington Shores, FL 33708
$-12,356
Cash flow
-22.2%
Cash-on-Cash Return
1.0%
Cap rate
0.2%
Rent to Value Ratio
Active
$1,165,000
3
bds
|
3
ba
|
2,680
sqft
|
built
2008
17817 Gulf Blvd, Redington Shores, FL 33708
$-4,203
Cash flow
-18.8%
Cash-on-Cash Return
1.8%
Cap rate
0.4%
Rent to Value Ratio

Active
$1,114,900
2
bds
|
3
ba
|
1,680
sqft
|
built
1958
241 176th Terrace Dr E, Redington Shores, FL 33708
$-2,822
Cash flow
-13.2%
Cash-on-Cash Return
3.1%
Cap rate
0.5%
Rent to Value Ratio

Active
$1,250,000
3
bds
|
2
ba
|
1,410
sqft
|
built
1980
17500 Gulf Blvd, Redington Shores, FL 33708
$-6,008
Cash flow
-25.1%
Cash-on-Cash Return
0.4%
Cap rate
0.3%
Rent to Value Ratio

Active
$595,000
2
bds
|
2
ba
|
1,165
sqft
|
built
1980
17900 Gulf Blvd, Redington Shores, FL 33708
$-1,403
Cash flow
-12.3%
Cash-on-Cash Return
3.3%
Cap rate
0.5%
Rent to Value Ratio

Active
$1,200,000
2
bds
|
2
ba
|
1,307
sqft
|
built
1963
861 180th Ave E, Redington Shores, FL 33708
$-4,200
Cash flow
-18.3%
Cash-on-Cash Return
1.9%
Cap rate
0.3%
Rent to Value Ratio

Active
$1,125,000
3
bds
|
3
ba
|
1,789
sqft
|
built
1980
17900 Gulf Blvd, Redington Shores, FL 33708
$-3,531
Cash flow
-16.4%
Cash-on-Cash Return
2.4%
Cap rate
0.4%
Rent to Value Ratio
Active
$369,900
1
bds
|
2
ba
|
995
sqft
|
built
1974
17920 Gulf Blvd, Redington Shores, FL 33708
$-1,114
Cash flow
-15.7%
Cash-on-Cash Return
2.5%
Cap rate
0.7%
Rent to Value Ratio
Active
$479,900
1
bds
|
2
ba
|
780
sqft
|
built
1989
17960 Gulf Blvd, Redington Shores, FL 33708
$-1,832
Cash flow
-19.9%
Cash-on-Cash Return
1.6%
Cap rate
0.5%
Rent to Value Ratio
Active
$4,750,000
8
bds
|
6
ba
|
5,580
sqft
|
built
1978
17606 Lee Ave, Redington Shores, FL 33708
$-24,465
Cash flow
-26.9%
Cash-on-Cash Return
0.0%
Cap rate
0.0%
Rent to Value Ratio
Active
$650,000
2
bds
|
2
ba
|
1,450
sqft
|
built
1972
17408 Gulf Blvd, Redington Shores, FL 33708
$-1,024
Cash flow
-8.2%
Cash-on-Cash Return
4.3%
Cap rate
0.6%
Rent to Value Ratio

Active
$387,500
2
bds
|
2
ba
|
888
sqft
|
built
1946
18198 3rd St E, Redington Shores, FL 33708
$-616
Cash flow
-8.3%
Cash-on-Cash Return
4.2%
Cap rate
0.7%
Rent to Value Ratio

Active
$1,049,000
3
bds
|
3
ba
|
1,995
sqft
|
built
2007
17735 Gulf Blvd, Redington Shores, FL 33708
$-2,706
Cash flow
-13.5%
Cash-on-Cash Return
3.1%
Cap rate
0.5%
Rent to Value Ratio
Active
$2,000,000
4
bds
|
4
ba
|
3,514
sqft
|
built
1957
139 Wall St, Redington Shores, FL 33708
$-7,086
Cash flow
-18.5%
Cash-on-Cash Return
1.9%
Cap rate
0.3%
Rent to Value Ratio

Active
$535,000
2
bds
|
2
ba
|
1,325
sqft
|
built
1970
17400 Gulf Blvd, Redington Shores, FL 33708
$-949
Cash flow
-9.3%
Cash-on-Cash Return
4.0%
Cap rate
0.5%
Rent to Value Ratio
Active
$479,000
2
bds
|
2
ba
|
1,070
sqft
|
built
1970
17400 Gulf Blvd, Redington Shores, FL 33708
$-877
Cash flow
-9.6%
Cash-on-Cash Return
4.0%
Cap rate
0.5%
Rent to Value Ratio

Active
$794,000
3
bds
|
2
ba
|
1,165
sqft
|
built
1982
17940 Gulf Blvd, Redington Shores, FL 33708
$-2,884
Cash flow
-19.0%
Cash-on-Cash Return
1.8%
Cap rate
0.5%
Rent to Value Ratio

Active
$750,000
2
bds
|
2
ba
|
1,450
sqft
|
built
1972
17408 Gulf Blvd, Redington Shores, FL 33708
$-1,753
Cash flow
-12.2%
Cash-on-Cash Return
3.3%
Cap rate
0.5%
Rent to Value Ratio
Active
$849,500
3
bds
|
2
ba
|
1,544
sqft
|
built
1980
18201 Gulf Blvd, Redington Shores, FL 33708
$-2,431
Cash flow
-14.9%
Cash-on-Cash Return
2.7%
Cap rate
0.5%
Rent to Value Ratio
Active
$475,000
3
bds
|
2
ba
|
1,333
sqft
|
built
1975
145 174th Terrace Dr E, Redington Shores, FL 33708
$-1,205
Cash flow
-13.2%
Cash-on-Cash Return
3.1%
Cap rate
0.5%
Rent to Value Ratio

Active
$725,000
2
bds
|
2
ba
|
1,575
sqft
|
built
1960
187 175th Terrace Dr E, Redington Shores, FL 33708
$-1,557
Cash flow
-11.2%
Cash-on-Cash Return
3.6%
Cap rate
0.5%
Rent to Value Ratio
Active
$1,450,000
3
bds
|
4
ba
|
2,516
sqft
|
built
1985
17404 1st St E, Redington Shores, FL 33708
$-4,954
Cash flow
-17.8%
Cash-on-Cash Return
2.0%
Cap rate
0.3%
Rent to Value Ratio

Active
$999,000
3
bds
|
3
ba
|
1,995
sqft
|
built
2007
17735 Gulf Blvd, Redington Shores, FL 33708
$-2,458
Cash flow
-12.8%
Cash-on-Cash Return
3.2%
Cap rate
0.6%
Rent to Value Ratio
Active
$799,000
2
bds
|
2
ba
|
1,220
sqft
|
built
1981
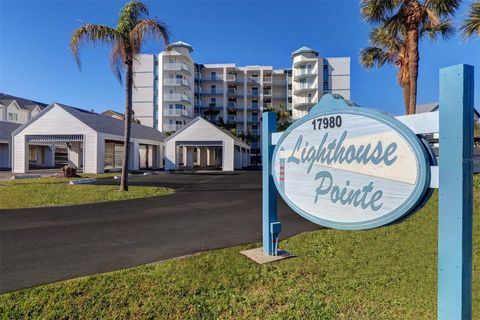
17980 Gulf Blvd, Redington Shores, FL 33708
$-1,201
Cash flow
-7.8%
Cash-on-Cash Return
4.3%
Cap rate
0.6%
Rent to Value Ratio
Active
$1,150,000
3
bds
|
3
ba
|
1,995
sqft
|
built
2007
17717 Gulf Blvd, Redington Shores, FL 33708
$-4,330
Cash flow
-19.6%
Cash-on-Cash Return
1.6%
Cap rate
0.5%
Rent to Value Ratio
Active
$975,000
3
bds
|
3
ba
|
1,789
sqft
|
built
1982
17940 Gulf Blvd, Redington Shores, FL 33708
$-2,277
Cash flow
-12.2%
Cash-on-Cash Return
3.3%
Cap rate
0.6%
Rent to Value Ratio
Active
$599,500
2
bds
|
1
ba
|
945
sqft
|
built
1953
18006 4th St E, Redington Shores, FL 33708
$-1,625
Cash flow
-14.1%
Cash-on-Cash Return
2.9%
Cap rate
0.4%
Rent to Value Ratio

Active
$609,000
2
bds
|
2
ba
|
1,250
sqft
|
built
1984
18325 Gulf Blvd, Redington Shores, FL 33708
$-2,038
Cash flow
-17.5%
Cash-on-Cash Return
2.1%
Cap rate
0.6%
Rent to Value Ratio
Active
$749,900
2
bds
|
2
ba
|
1,220
sqft
|
built
1981
17980 Gulf Blvd, Redington Shores, FL 33708
$-1,939
Cash flow
-13.5%
Cash-on-Cash Return
3.0%
Cap rate
0.5%
Rent to Value Ratio

Active
$765,000
2
bds
|
2
ba
|
1,135
sqft
|
built
1983
18320 Gulf Blvd, Redington Shores, FL 33708
$-2,039
Cash flow
-13.9%
Cash-on-Cash Return
2.9%
Cap rate
0.5%
Rent to Value Ratio