Richton Park, IL Investment Properties for Sale
Browse homes for sale and investment properties in Richton Park, IL. Refine your search by price, property type, or more.
Best cash flowing properties in Richton Park, IL
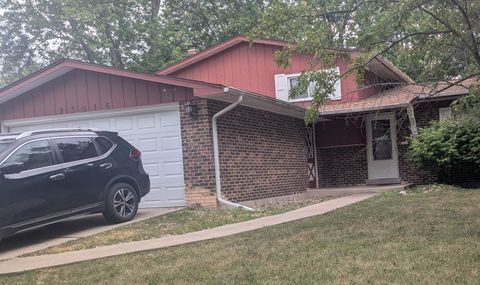
Active
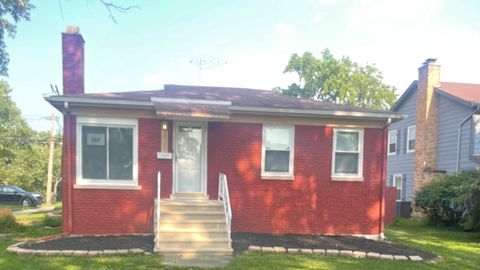
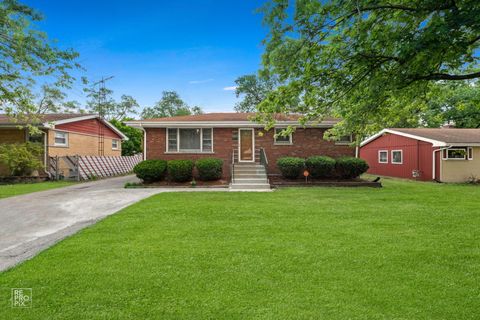
$165,000
3
bds
|
2
ba
|
1,170
sqft
|
built
1973
23016 Valley Dr, Richton Park, IL 60471
$385
Cash flow
12.2%
Cash-on-Cash Return
8.5%
Cap rate
1.5%
Rent to Value Ratio
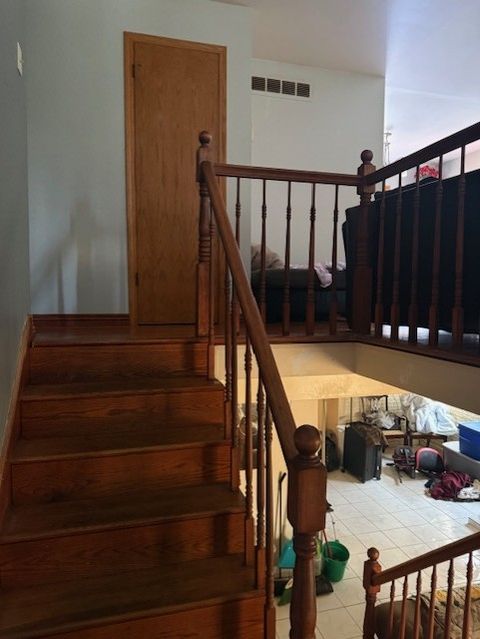
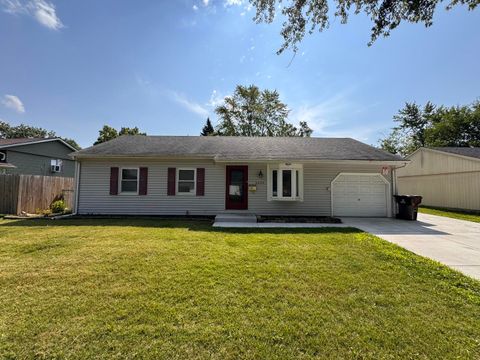
Active
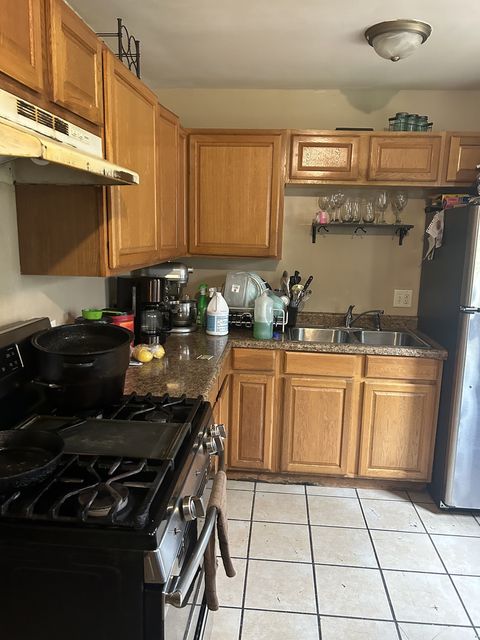
$175,000
1
bds
|
2
ba
|
825
sqft
|
built
1971
4720 Laurel Dr, Richton Park, IL 60471
$161
Cash flow
4.8%
Cash-on-Cash Return
6.8%
Cap rate
1.1%
Rent to Value Ratio
14 out of 14 properties for sale in Richton Park, IL
Limited Results Shown
Create a free account, or log in to reveal all property listings and enjoy the complete experience.
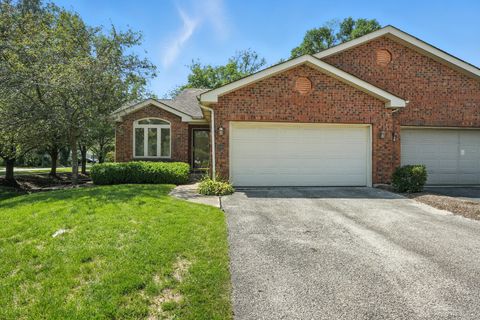
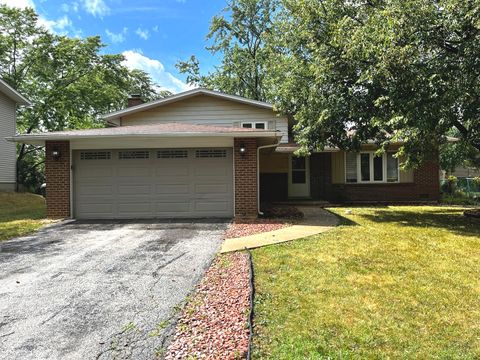
Active
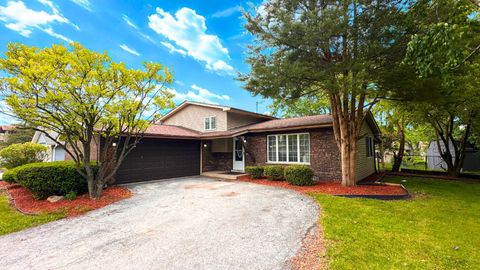
$239,900
2
bds
|
2
ba
|
1,692
sqft
|
built
2001
22054 Jordan Ln, Richton Park, IL 60471
$-430
Cash flow
-9.4%
Cash-on-Cash Return
3.5%
Cap rate
0.8%
Rent to Value Ratio
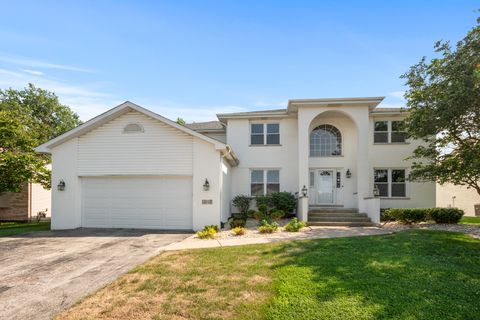
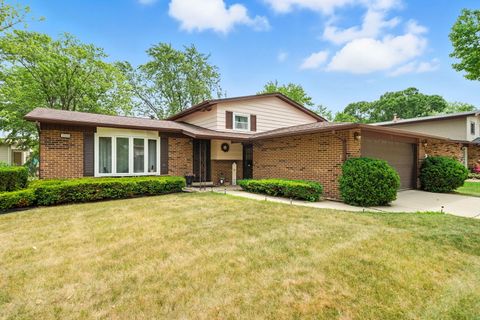
Active
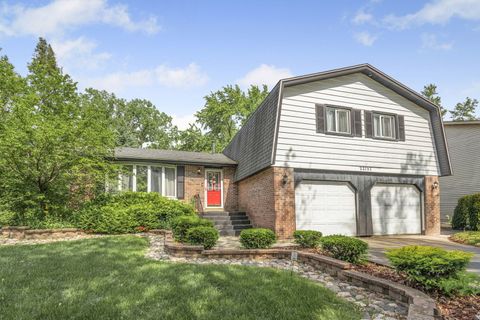
$437,900
5
bds
|
3
ba
|
3,882
sqft
|
built
1999
3713 Dewey Ave, Richton Park, IL 60471
$-695
Cash flow
-8.3%
Cash-on-Cash Return
3.8%
Cap rate
0.9%
Rent to Value Ratio
Active
$215,000
3
bds
|
2
ba
|
1,446
sqft
|
built
1947
22503 Ridgeway Ave, Richton Park, IL 60471
$-84
Cash flow
-2.0%
Cash-on-Cash Return
5.2%
Cap rate
0.8%
Rent to Value Ratio
Active
$210,000
4
bds
|
2
ba
|
1,320
sqft
|
built
1971
22135 Rockingham Rd, Richton Park, IL 60471
$-10
Cash flow
-0.2%
Cash-on-Cash Return
5.6%
Cap rate
1.0%
Rent to Value Ratio
Active
$244,000
3
bds
|
2
ba
|
1,244
sqft
|
built
1977
5110 Arquilla Dr, Richton Park, IL 60471
$-332
Cash flow
-7.1%
Cash-on-Cash Return
4.0%
Cap rate
0.9%
Rent to Value Ratio
Active
$247,500
3
bds
|
2
ba
|
1,248
sqft
|
built
1971
22555 Mission Dr, Richton Park, IL 60471
$-72
Cash flow
-1.5%
Cash-on-Cash Return
5.3%
Cap rate
0.9%
Rent to Value Ratio
Active
$214,900
3
bds
|
1
ba
|
1,616
sqft
|
built
1956
22431 Lawndale Ave, Richton Park, IL 60471
$-91
Cash flow
-2.2%
Cash-on-Cash Return
5.2%
Cap rate
0.9%
Rent to Value Ratio
Active
$269,000
3
bds
|
2
ba
|
1,700
sqft
|
built
1977
5303 Arquilla Dr, Richton Park, IL 60471
$-202
Cash flow
-3.9%
Cash-on-Cash Return
4.8%
Cap rate
0.9%
Rent to Value Ratio
Active
$264,000
4
bds
|
3
ba
|
2,310
sqft
|
built
1971
22757 Lakeshore Dr, Richton Park, IL 60471
$-64
Cash flow
-1.3%
Cash-on-Cash Return
5.4%
Cap rate
1.0%
Rent to Value Ratio
Active
$149,900
2
bds
|
2
ba
|
0
sqft
|
built
1967
22121 Karlov Ave, Richton Park, IL 60471
$107
Cash flow
3.7%
Cash-on-Cash Return
6.5%
Cap rate
1.2%
Rent to Value Ratio
Active
$240,000
3
bds
|
3
ba
|
1,455
sqft
|
built
2007
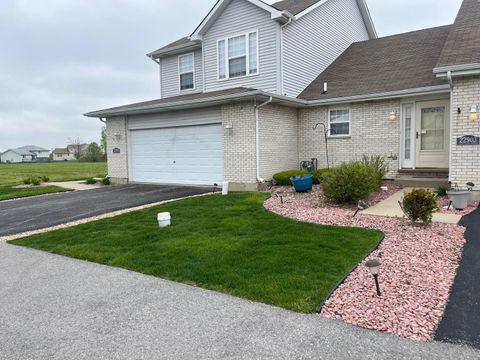
22901 Westwind Dr, Richton Park, IL 60471
$-359
Cash flow
-7.8%
Cash-on-Cash Return
3.9%
Cap rate
0.9%
Rent to Value Ratio
Active
$211,000
3
bds
|
2
ba
|
1,252
sqft
|
built
1971
22621 Mission Dr, Richton Park, IL 60471
$-53
Cash flow
-1.3%
Cash-on-Cash Return
5.4%
Cap rate
1.1%
Rent to Value Ratio