Salt Lake City, UT Investment Properties for Sale
Browse homes for sale and investment properties in Salt Lake City, UT. Refine your search by price, property type, or more.
Best cash flowing properties in Salt Lake City, UT
Active
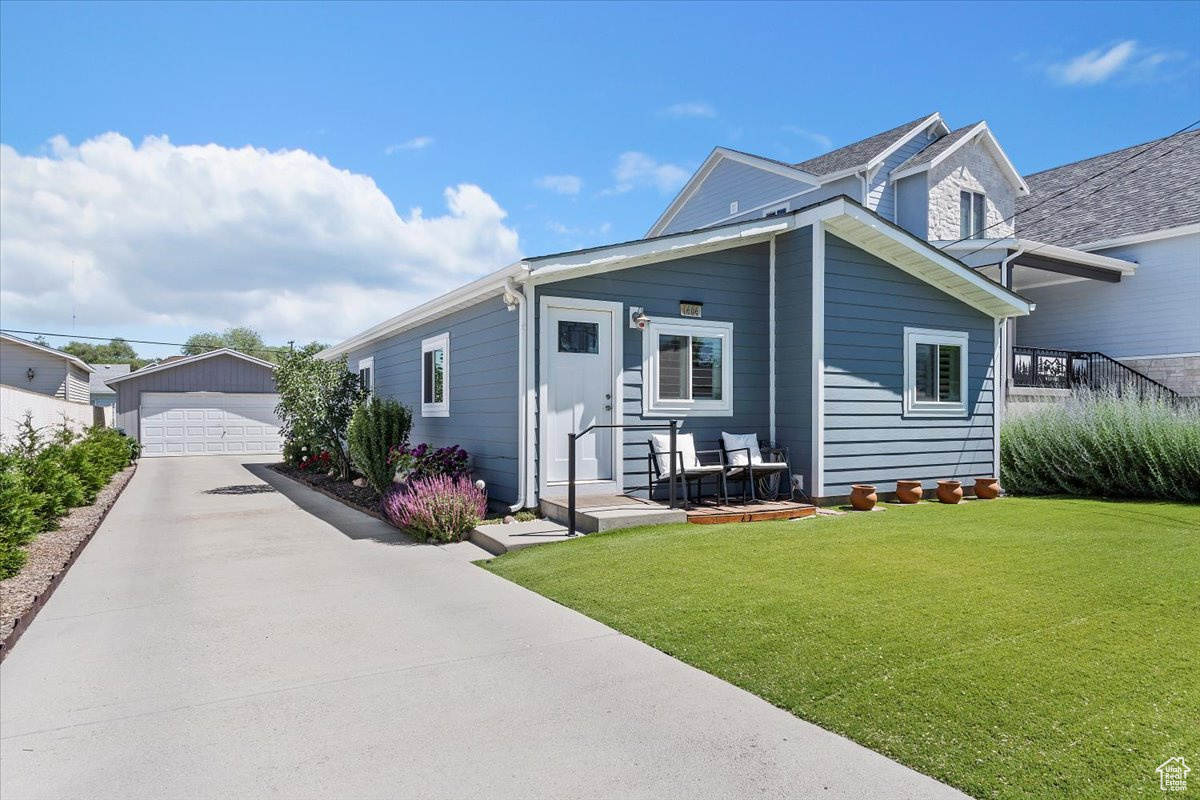
$399,900
3
bds
|
2
ba
|
1,224
sqft
|
built
2001
1464 W Sunset Ave, Salt Lake City, UT 84119
$-852
Cash flow
-11.1%
Cash-on-Cash Return
3.7%
Cap rate
0.5%
Rent to Value Ratio
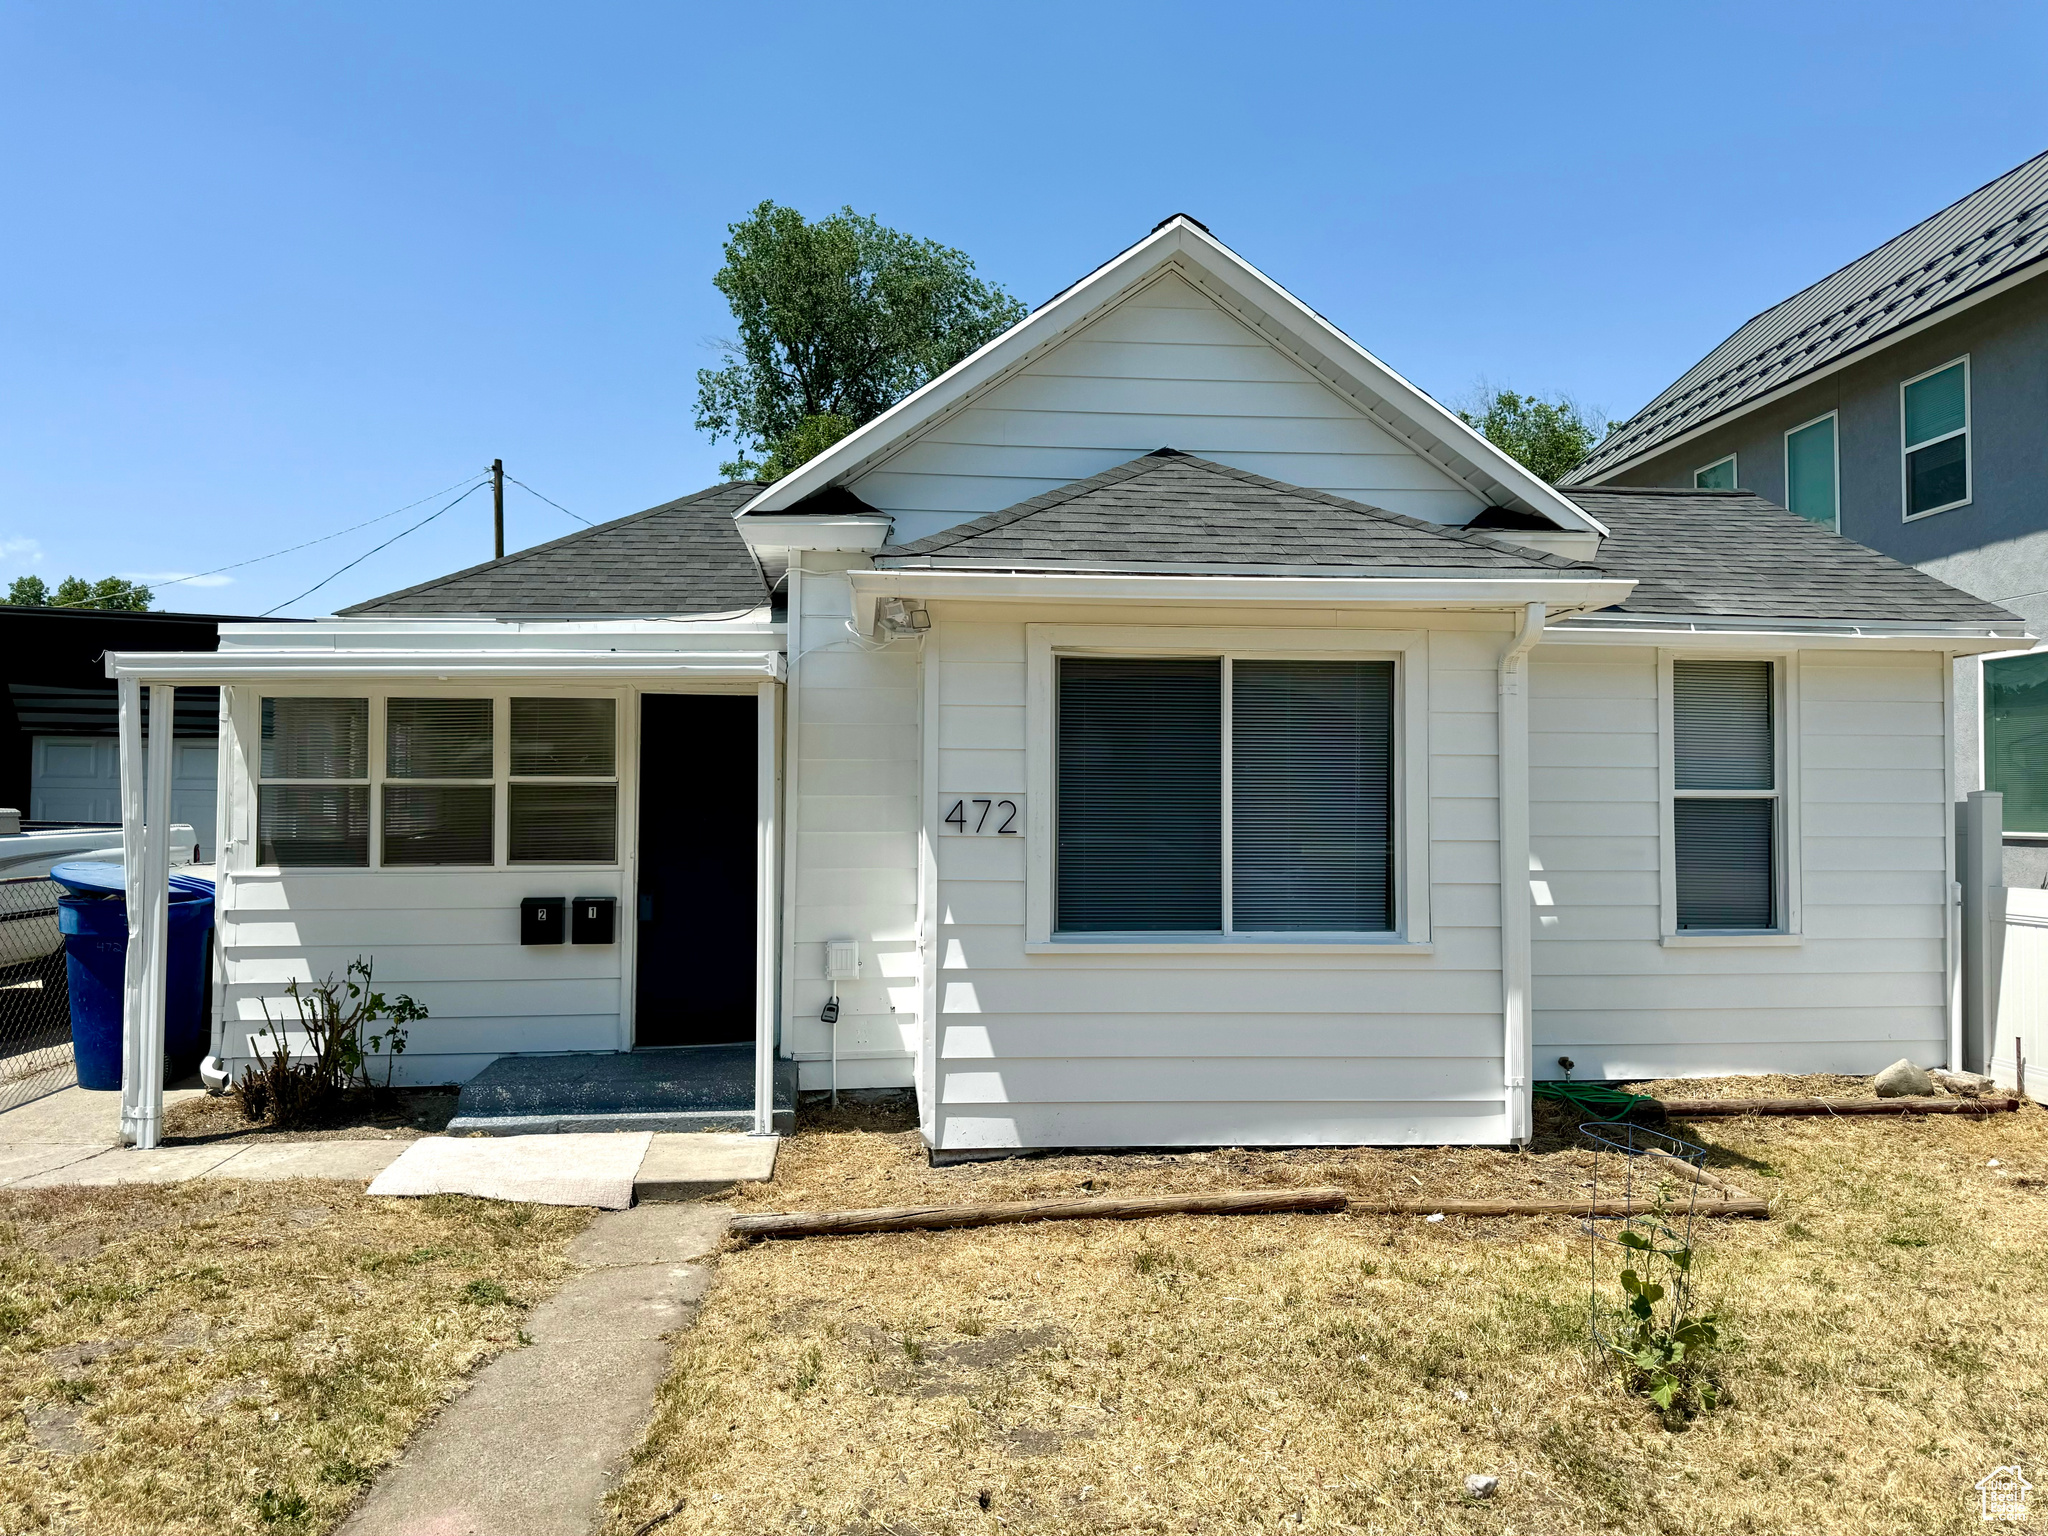
Pending
$399,900
3
bds
|
2
ba
|
1,229
sqft
|
built
1914
472 S 1000 W, Salt Lake City, UT 84104
$-939
Cash flow
-12.3%
Cash-on-Cash Return
3.5%
Cap rate
0.5%
Rent to Value Ratio
688 out of 790 properties for sale in Salt Lake City, UT
Limited Results Shown
Create a free account, or log in to reveal all property listings and enjoy the complete experience.
Active
$1,095,000
4
bds
|
2
ba
|
2,000
sqft
|
built
1950
2487 S Beverly St, Salt Lake City, UT 84106
$-3,967
Cash flow
-18.9%
Cash-on-Cash Return
1.9%
Cap rate
0.3%
Rent to Value Ratio
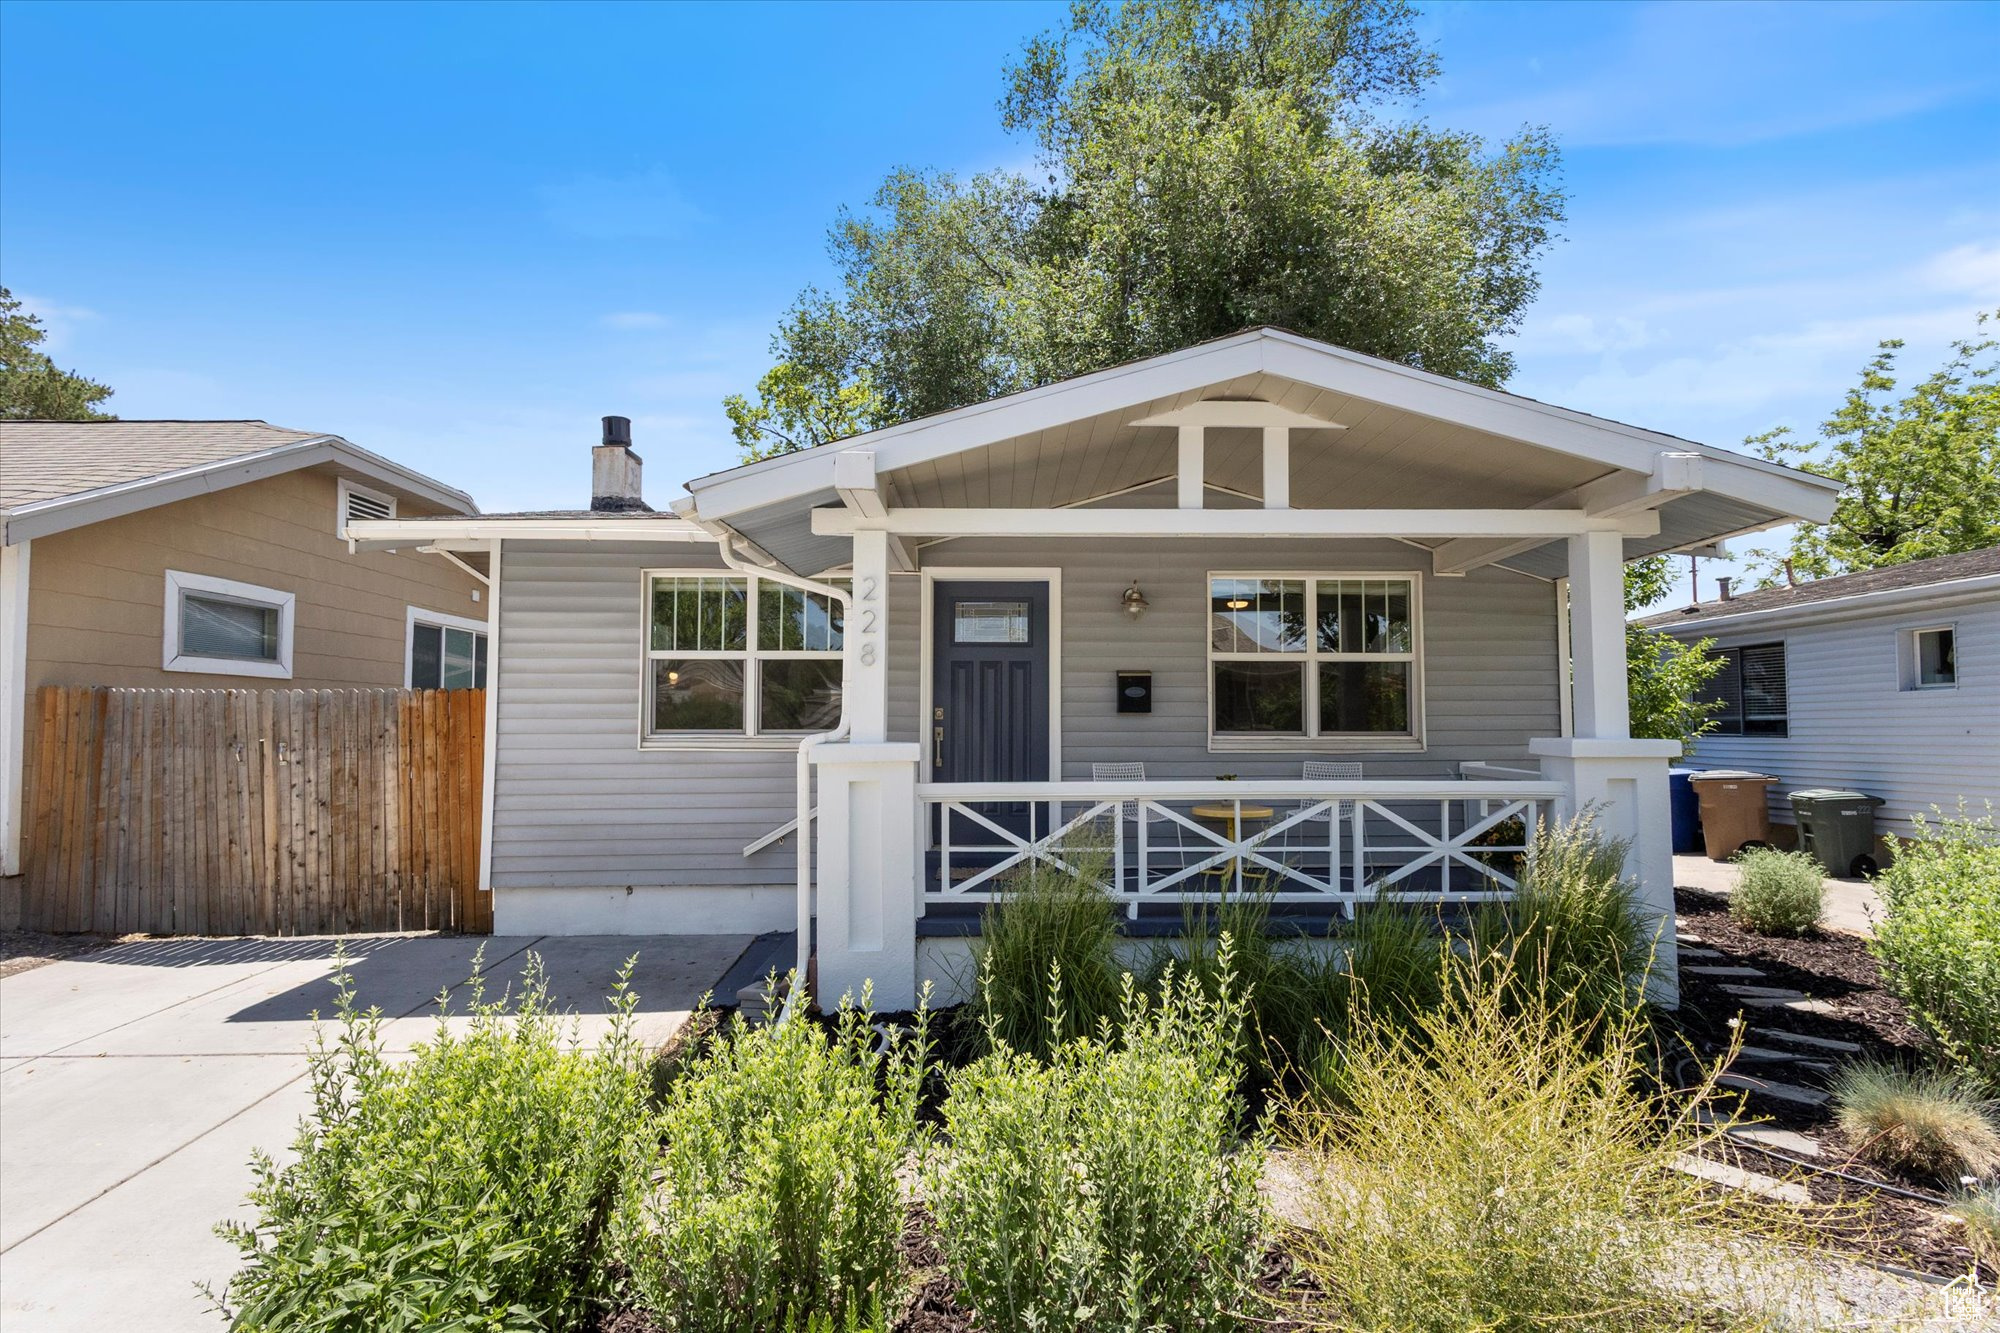
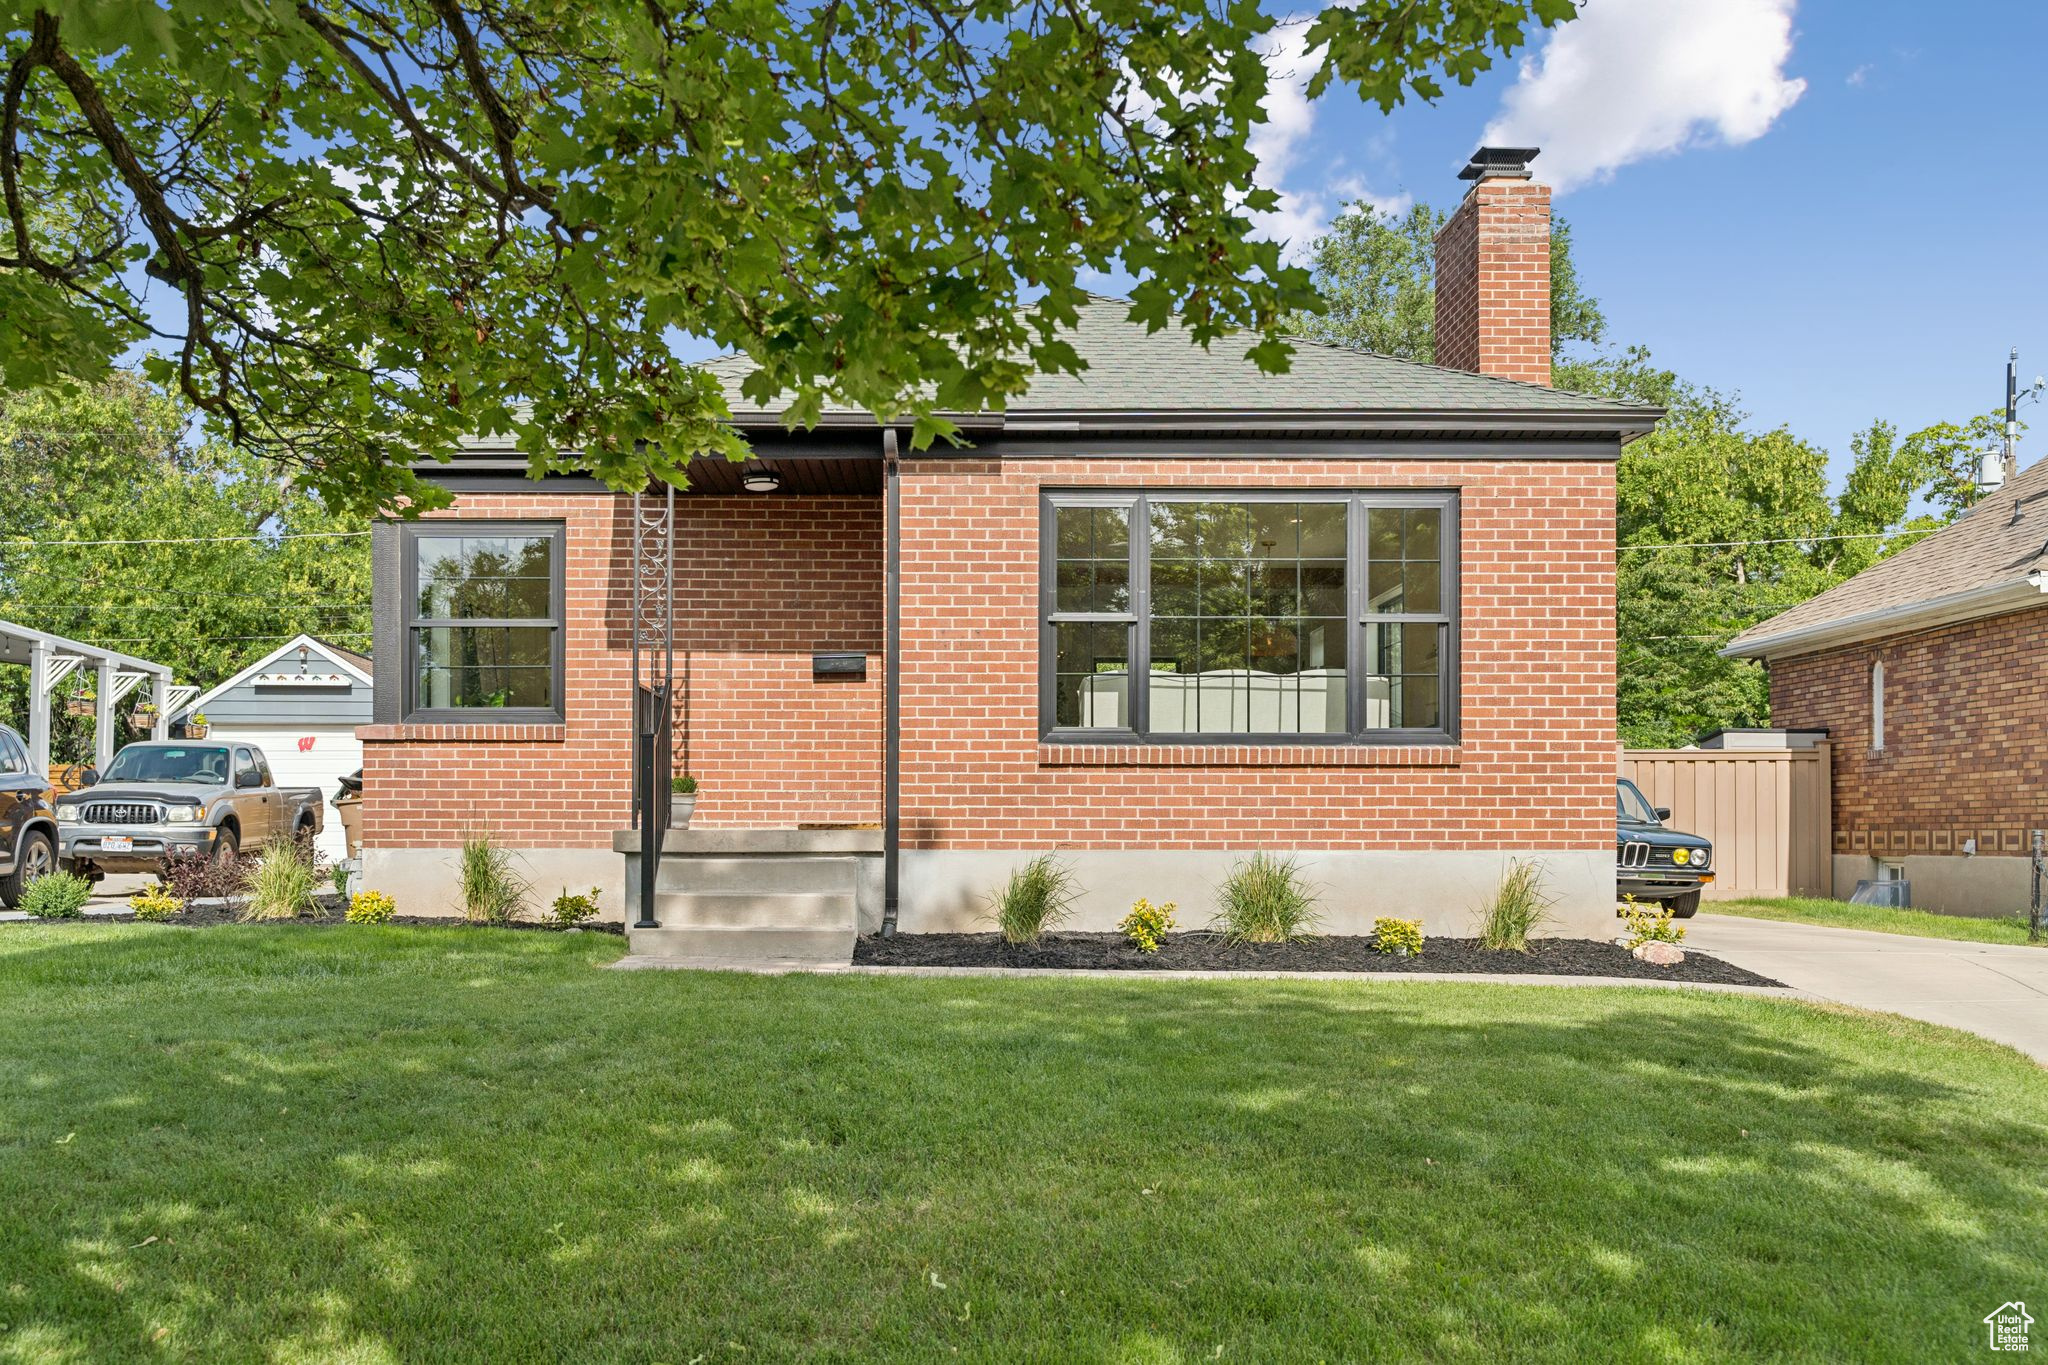
Active
$630,000
3
bds
|
2
ba
|
1,635
sqft
|
built
1921
228 E Coatsville Ave, Salt Lake City, UT 84115
$-2,281
Cash flow
-18.9%
Cash-on-Cash Return
1.9%
Cap rate
0.3%
Rent to Value Ratio
Active
$769,900
4
bds
|
2
ba
|
1,940
sqft
|
built
1951
2359 E Bryan Ave, Salt Lake City, UT 84108
$-2,902
Cash flow
-19.7%
Cash-on-Cash Return
1.8%
Cap rate
0.3%
Rent to Value Ratio
Active
$595,000
4
bds
|
2
ba
|
1,656
sqft
|
built
1945
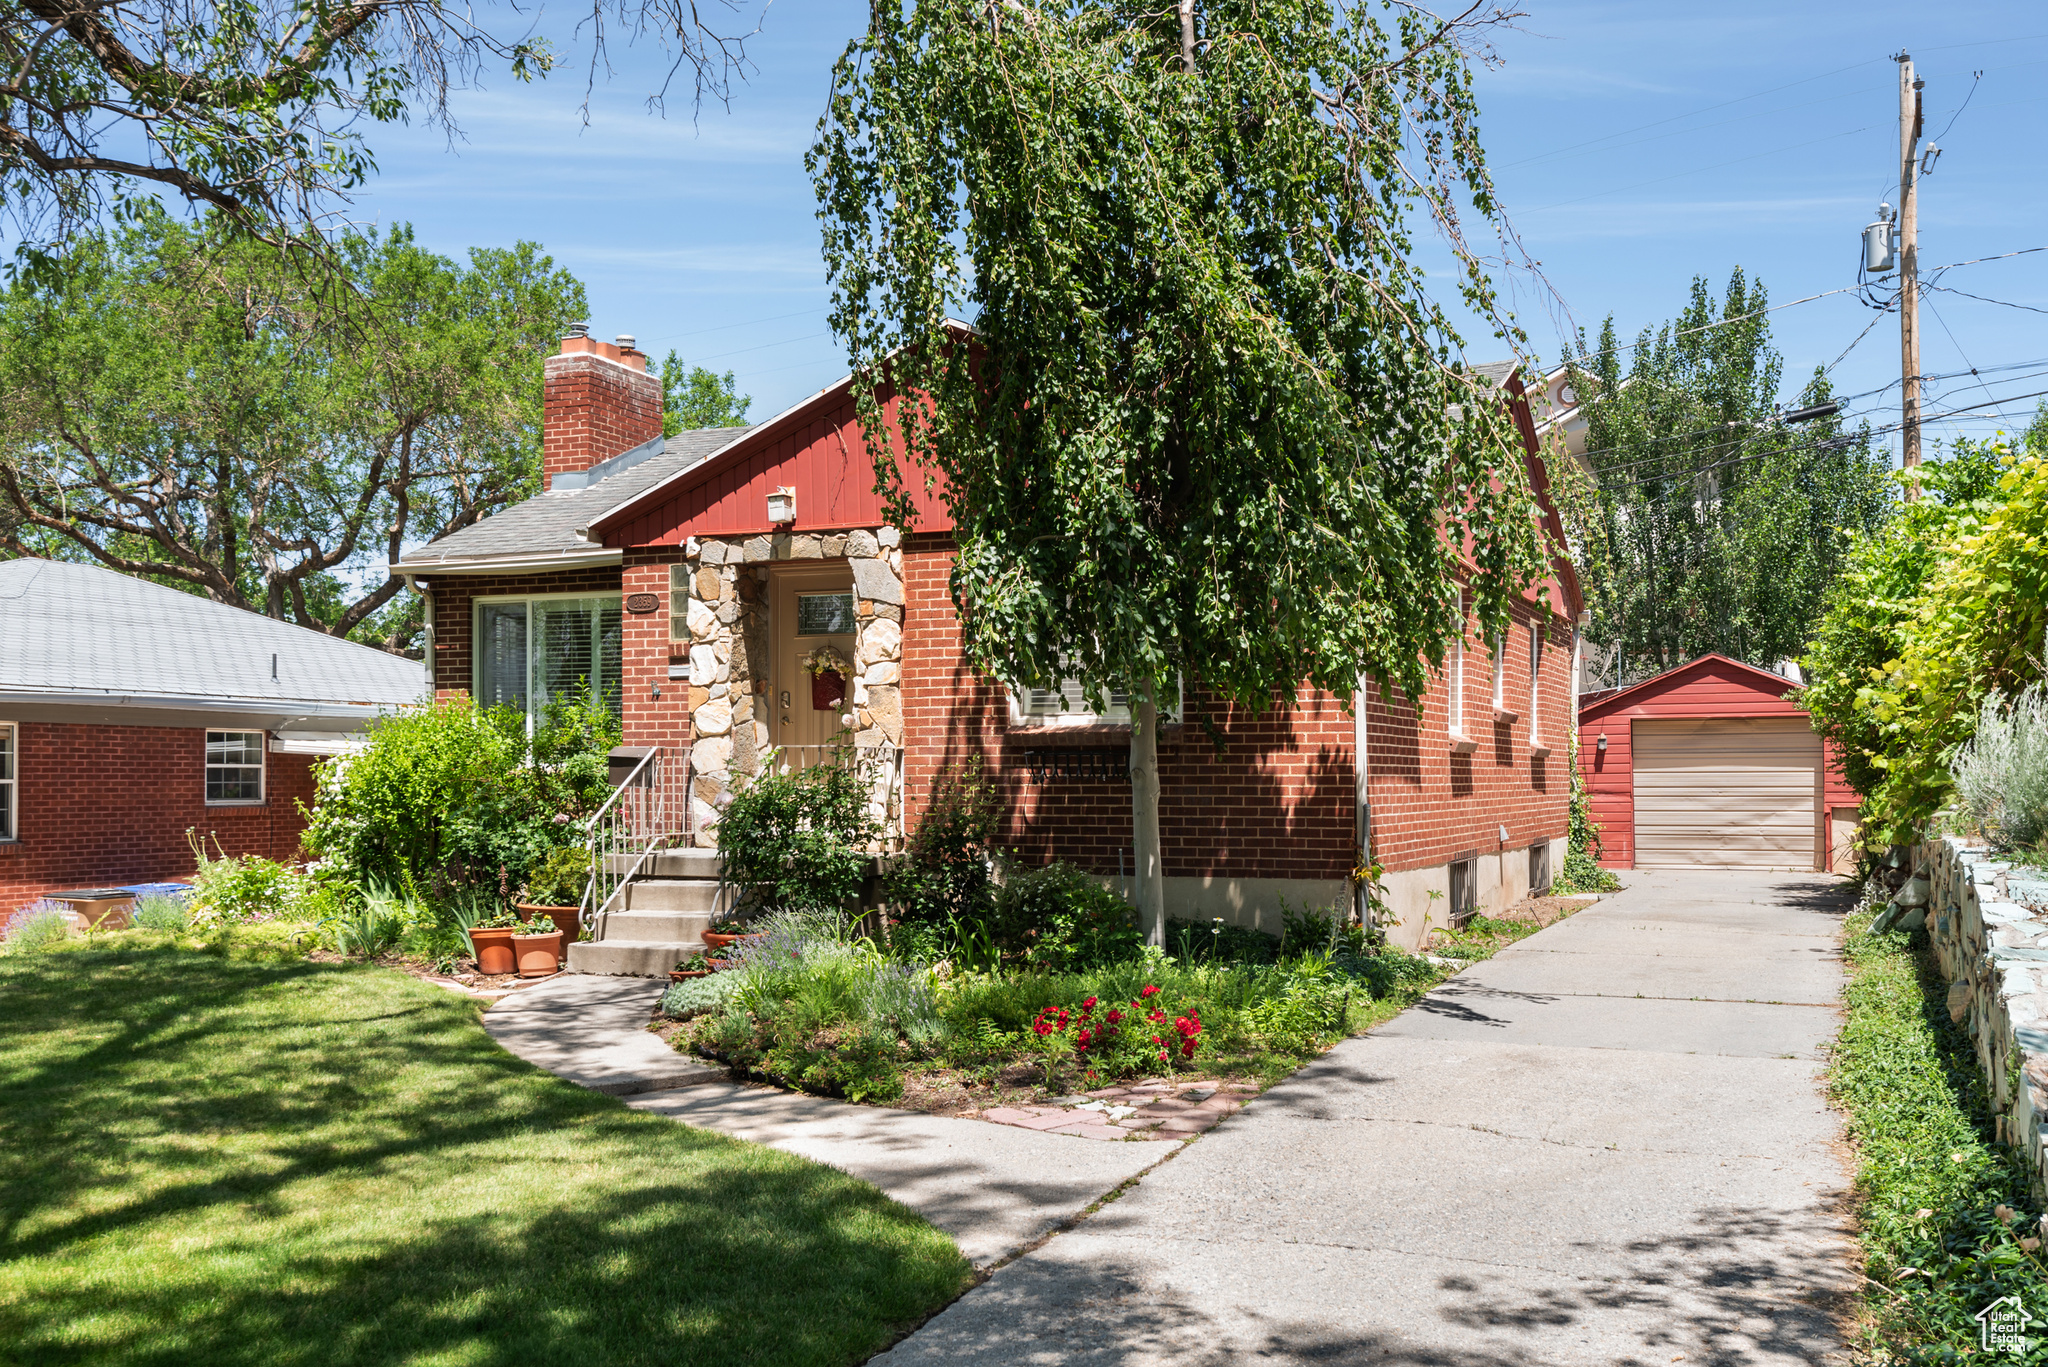
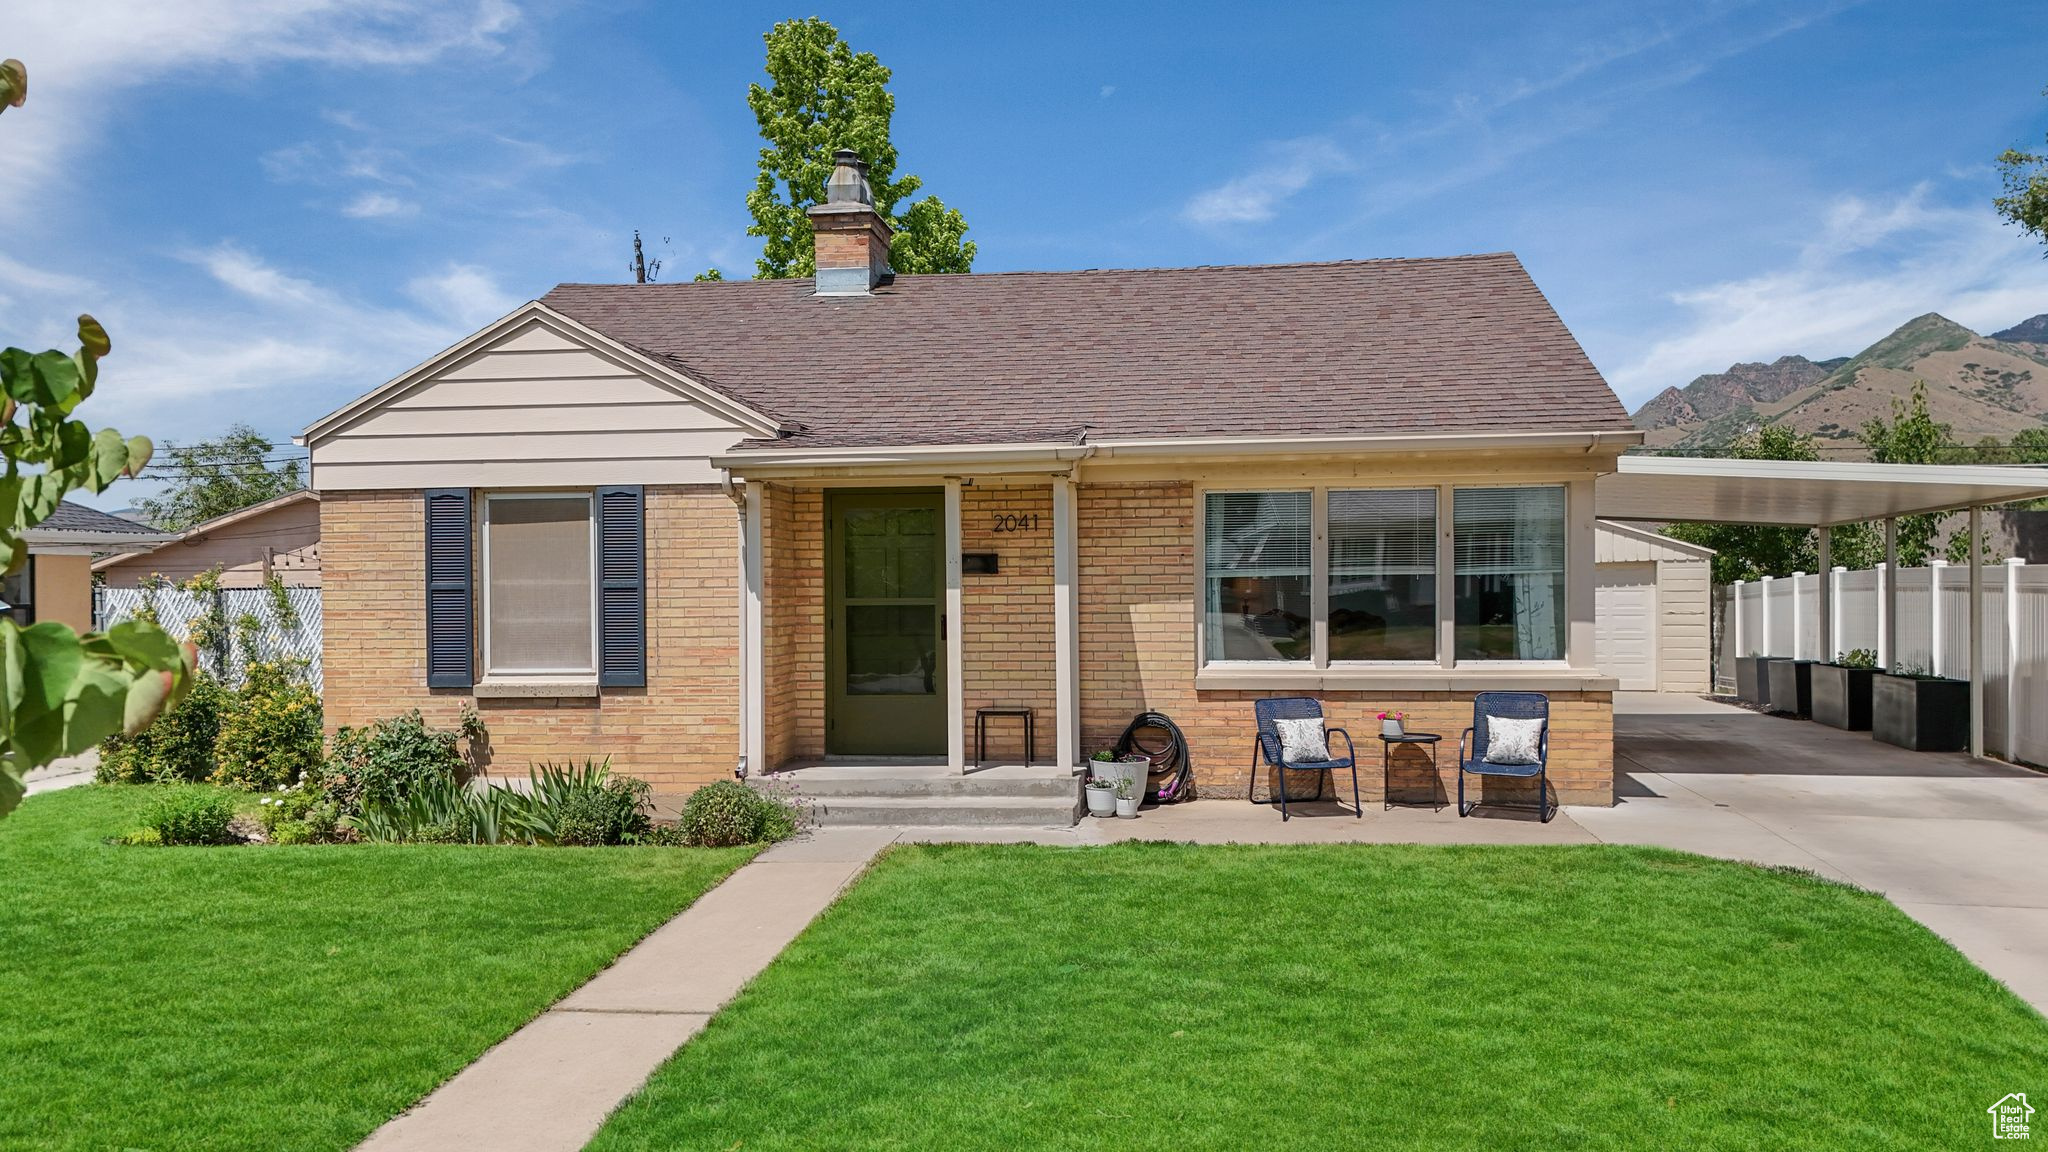
2041 E Stratford Dr, Salt Lake City, UT 84109
$-1,529
Cash flow
-13.4%
Cash-on-Cash Return
3.2%
Cap rate
0.4%
Rent to Value Ratio
Active
$779,900
8
bds
|
5
ba
|
4,163
sqft
|
built
2007
3903 S 3200 W, Salt Lake City, UT 84119
$-2,687
Cash flow
-18.0%
Cash-on-Cash Return
2.1%
Cap rate
0.3%
Rent to Value Ratio
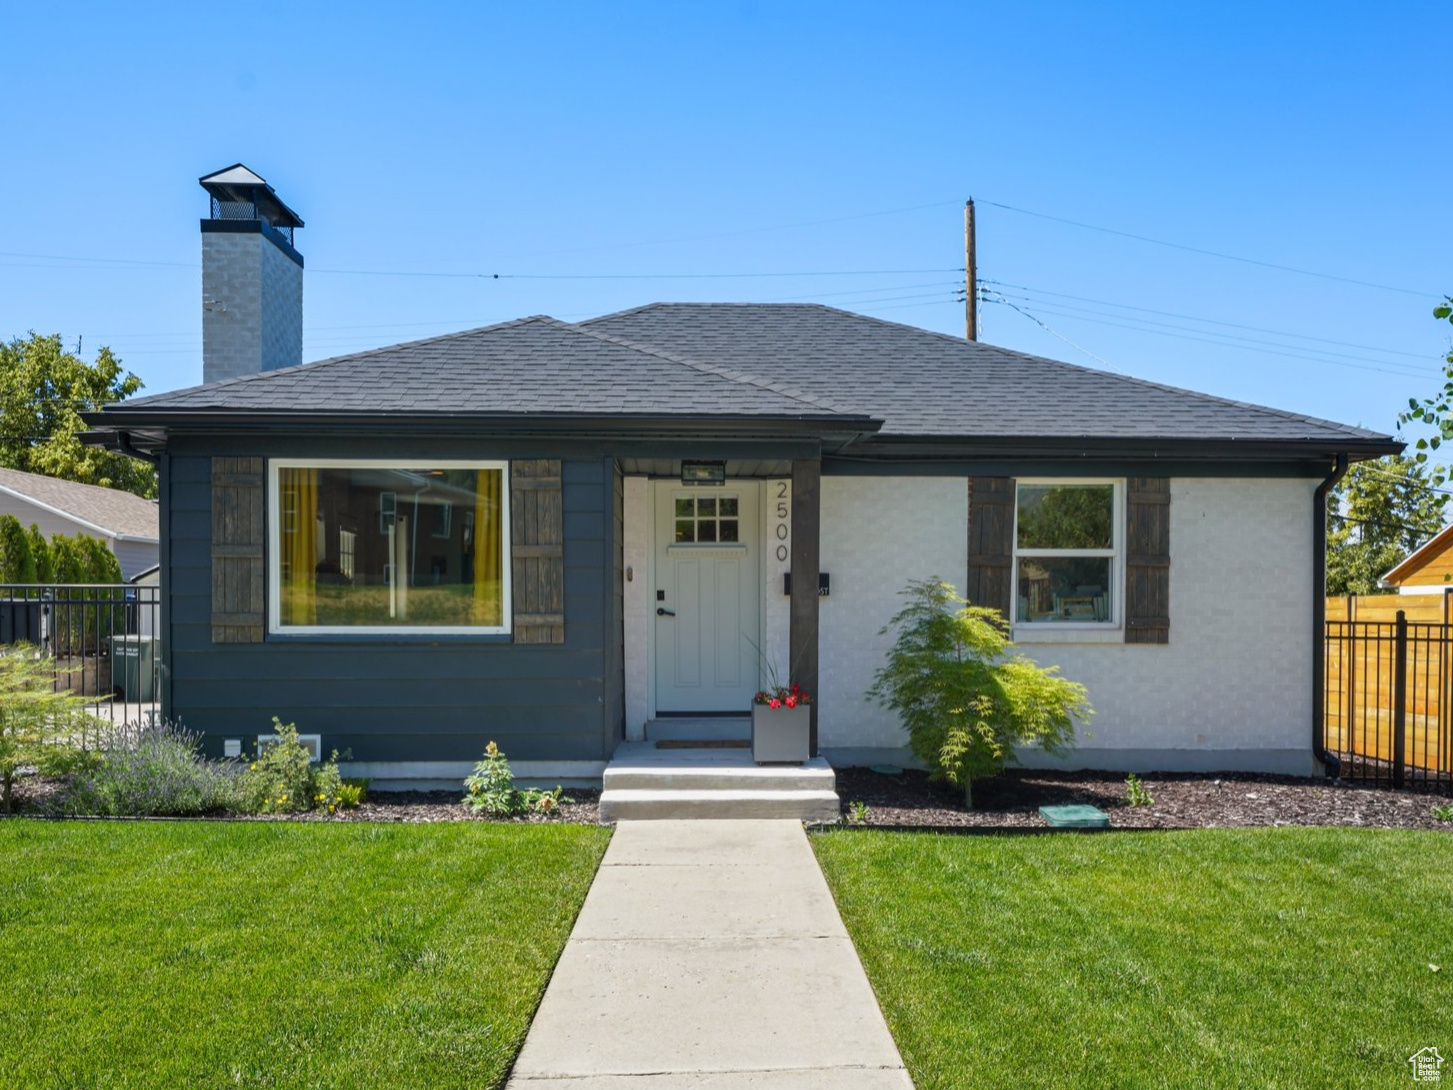
Active under contract
$859,900
4
bds
|
3
ba
|
2,190
sqft
|
built
1947
2500 E Simpson Ave, Salt Lake City, UT 84109
$-2,089
Cash flow
-12.7%
Cash-on-Cash Return
3.4%
Cap rate
0.5%
Rent to Value Ratio
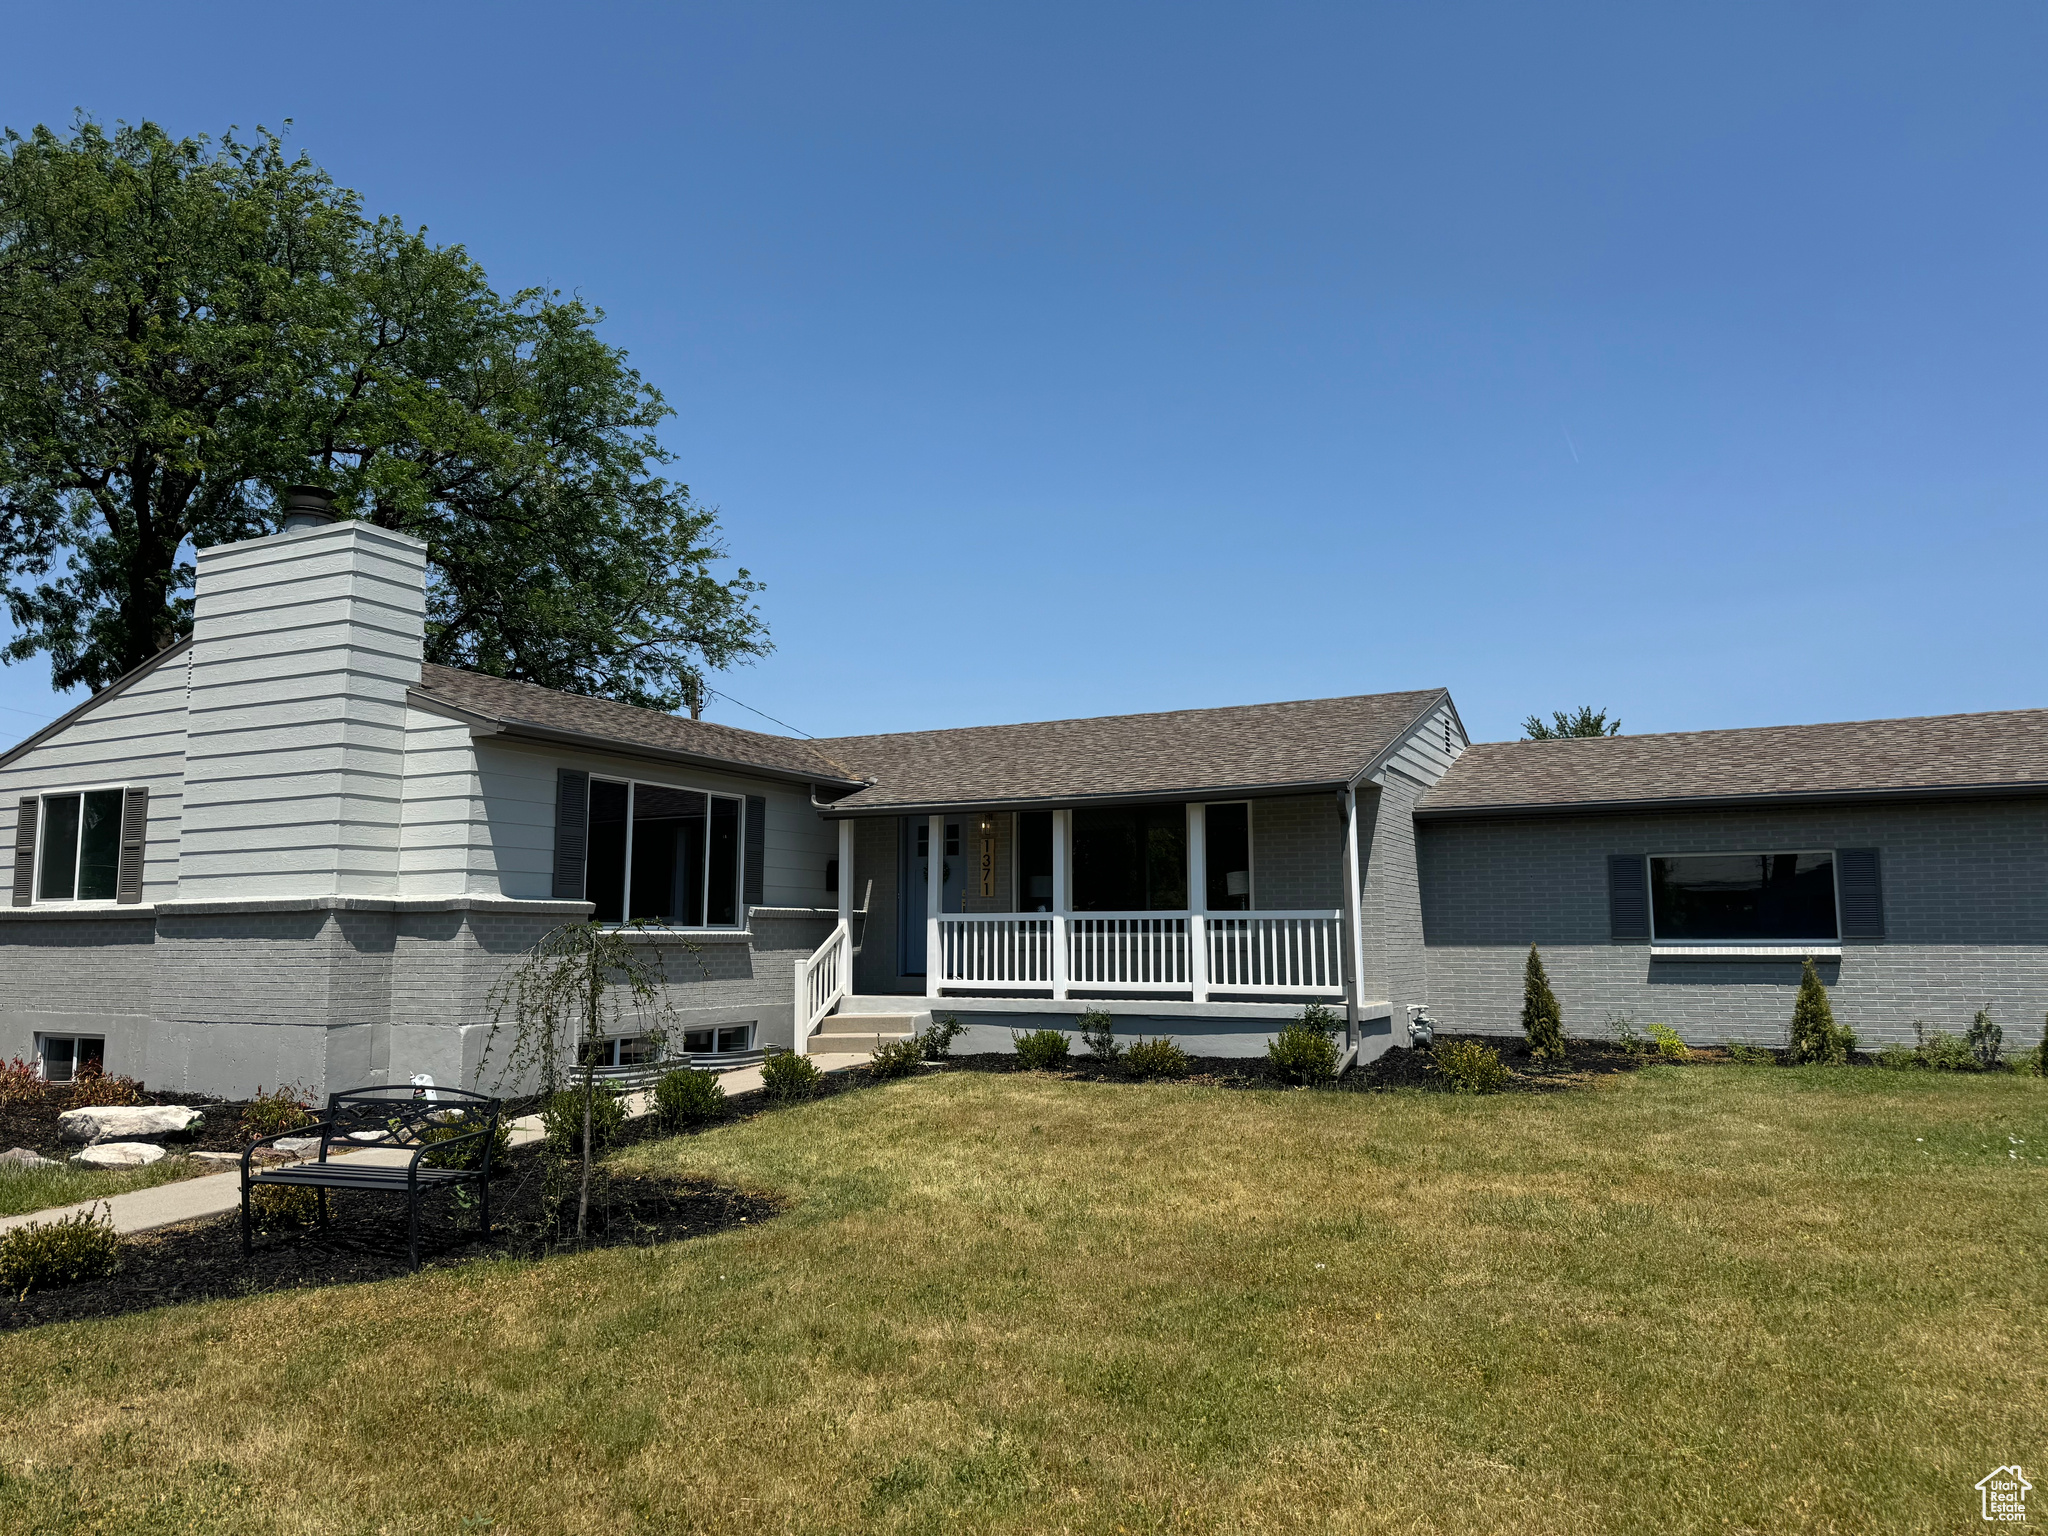
Active
$937,500
5
bds
|
3
ba
|
3,016
sqft
|
built
1957
1371 E Skyview Dr, Salt Lake City, UT 84124
$-3,568
Cash flow
-19.9%
Cash-on-Cash Return
1.7%
Cap rate
0.3%
Rent to Value Ratio
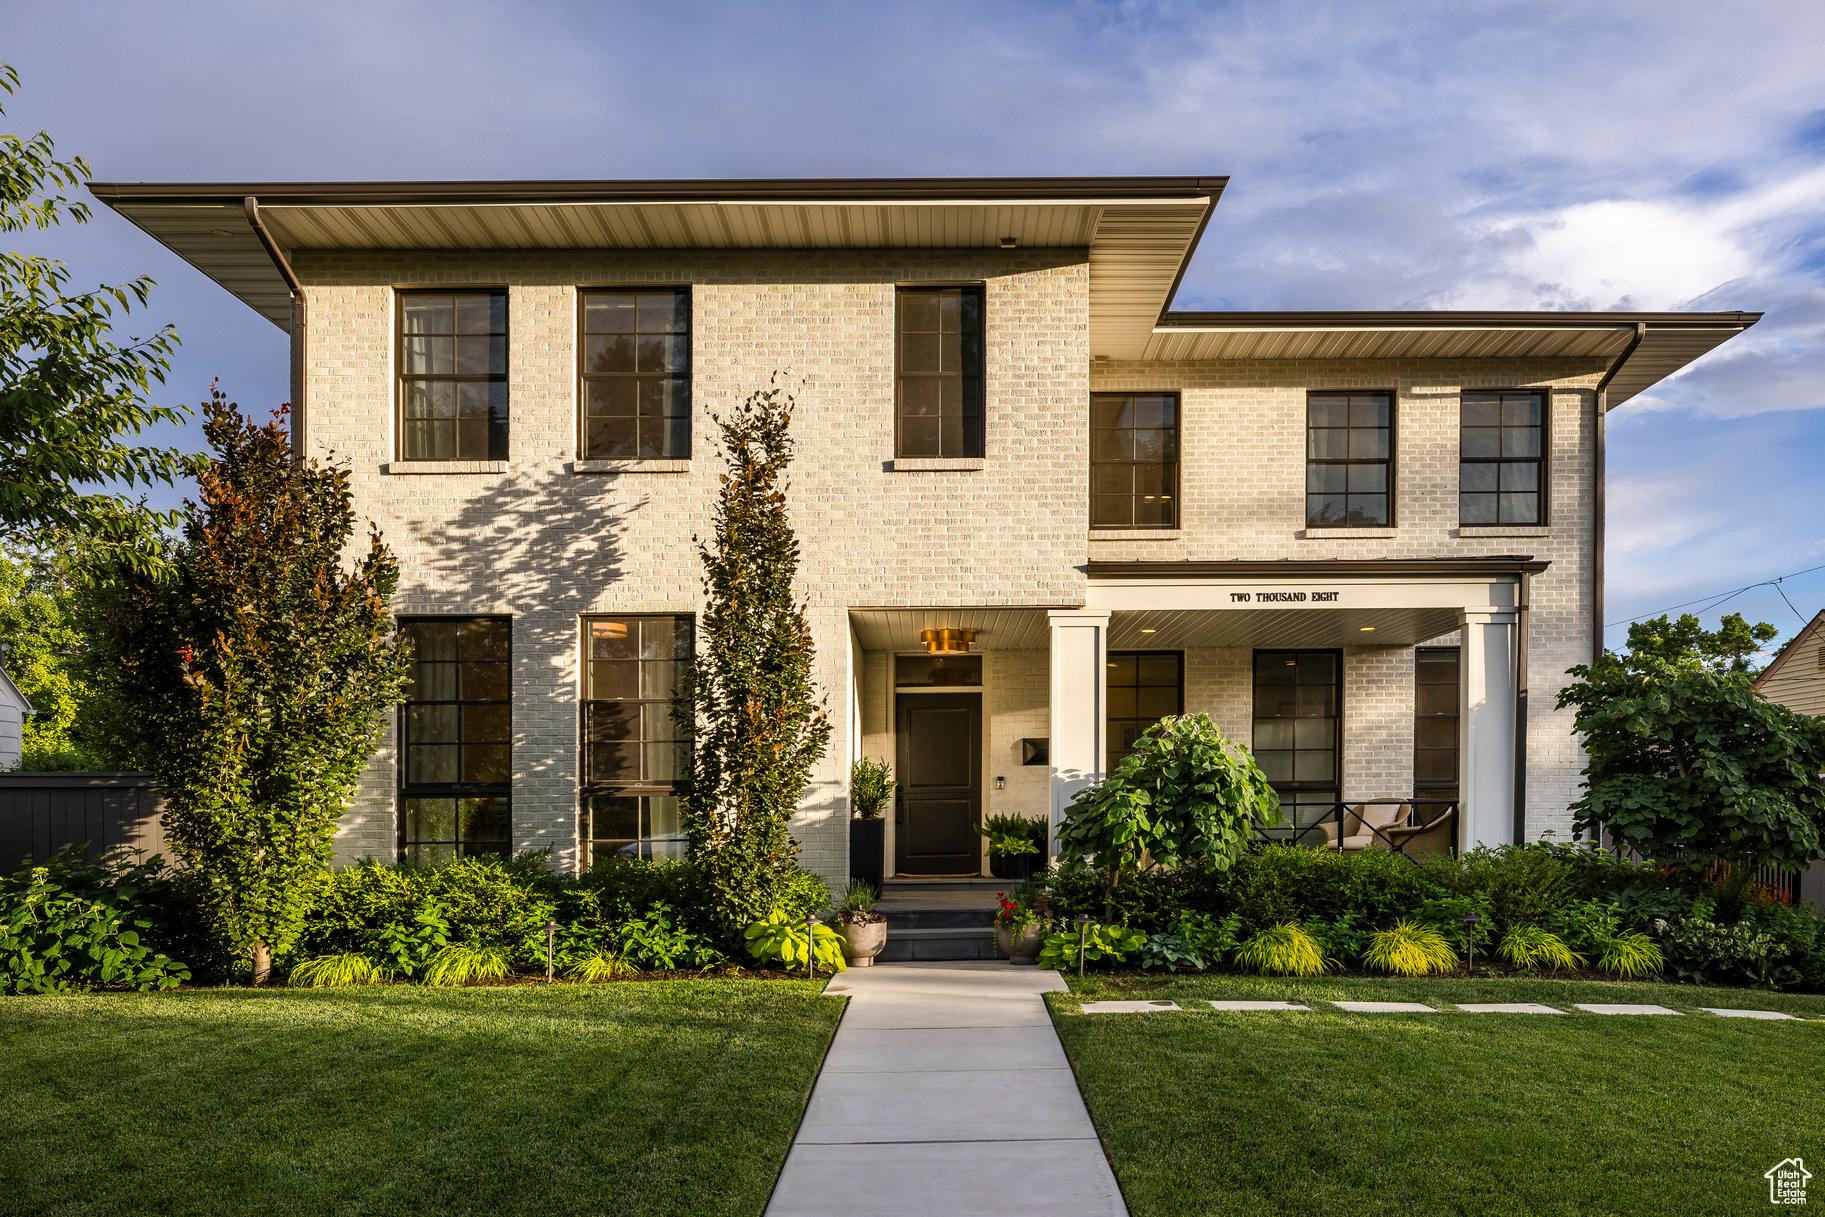
Active
$2,500,000
6
bds
|
6
ba
|
3,738
sqft
|
built
2018
2008 E Laird Dr, Salt Lake City, UT 84108
$-11,034
Cash flow
-23.0%
Cash-on-Cash Return
1.0%
Cap rate
0.2%
Rent to Value Ratio
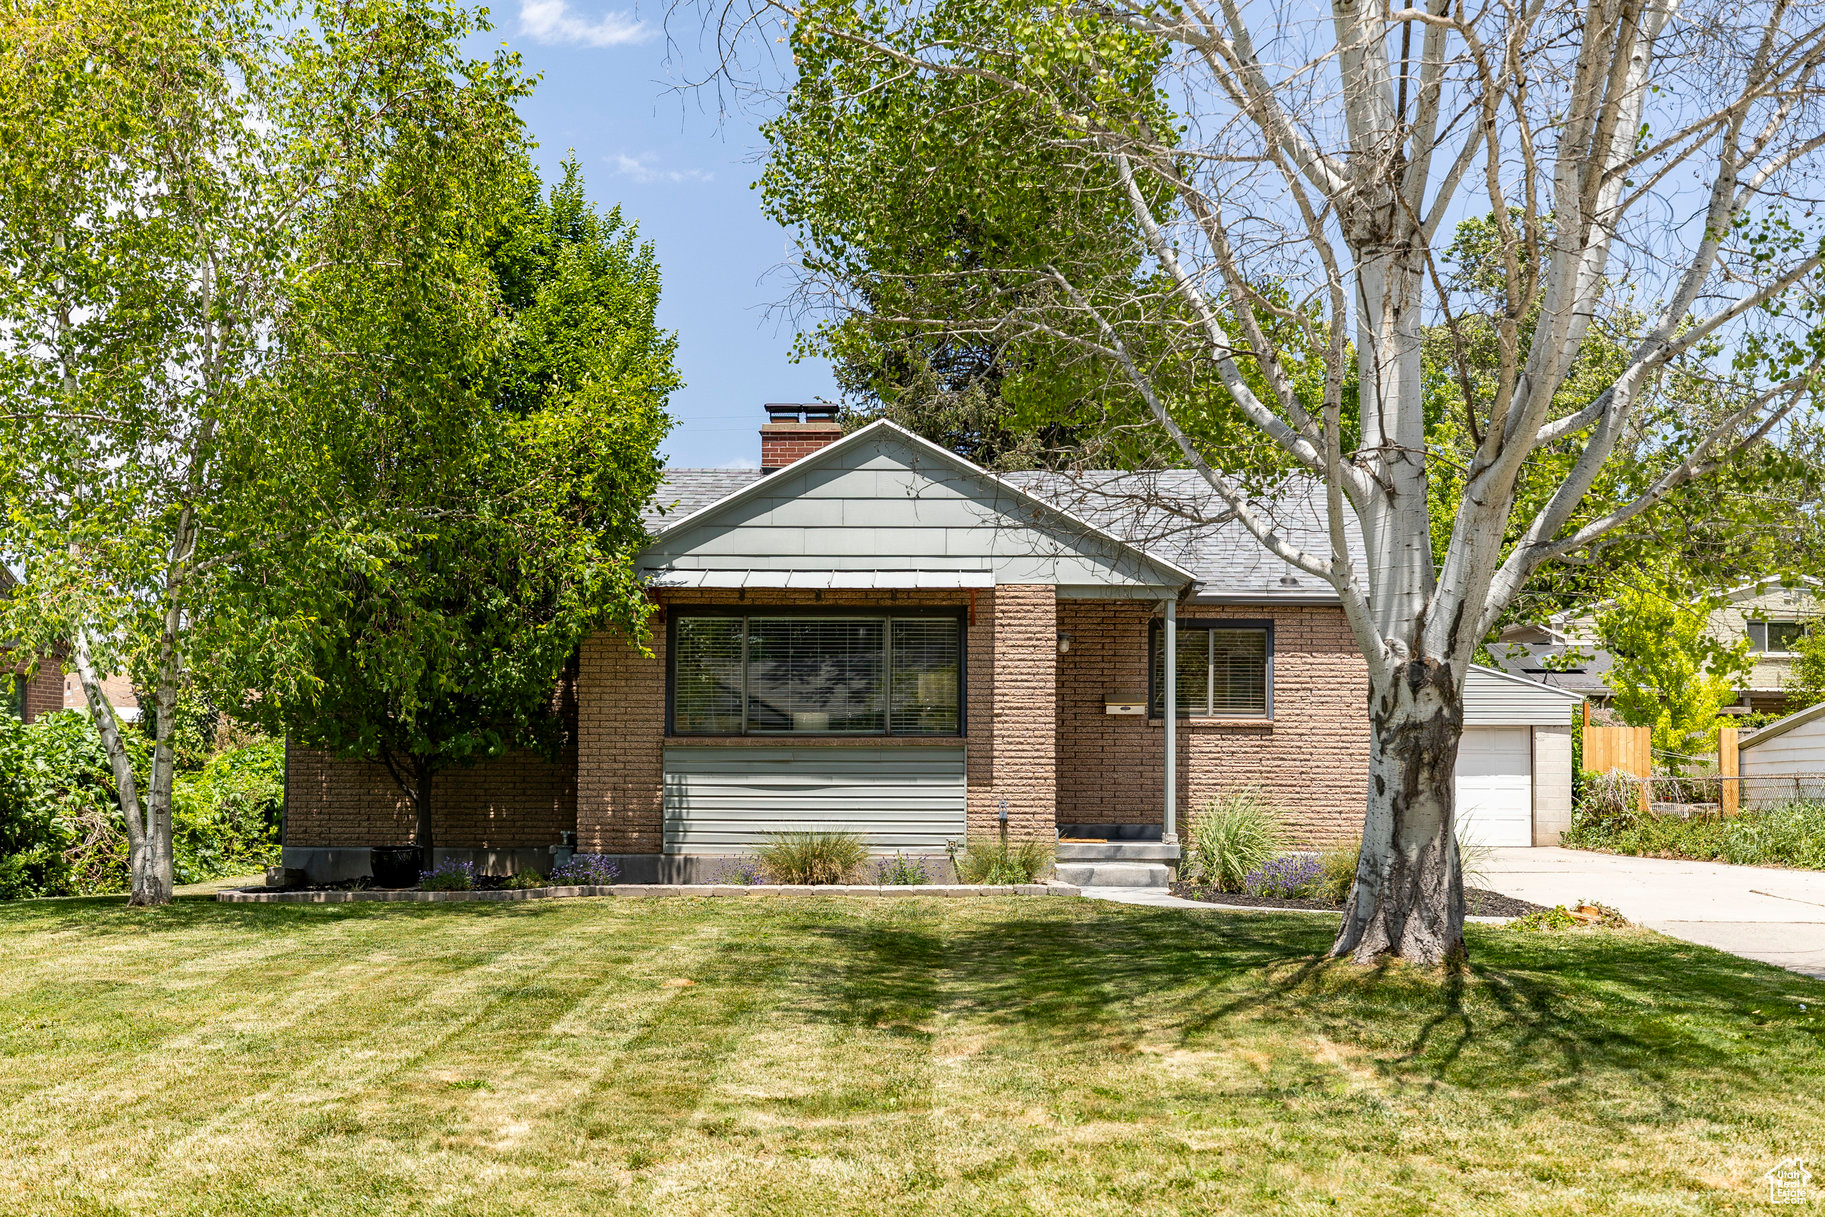
Pending
$600,000
3
bds
|
3
ba
|
2,050
sqft
|
built
1954
1045 E Millcreek Way, Salt Lake City, UT 84106
$-1,259
Cash flow
-10.9%
Cash-on-Cash Return
3.8%
Cap rate
0.5%
Rent to Value Ratio
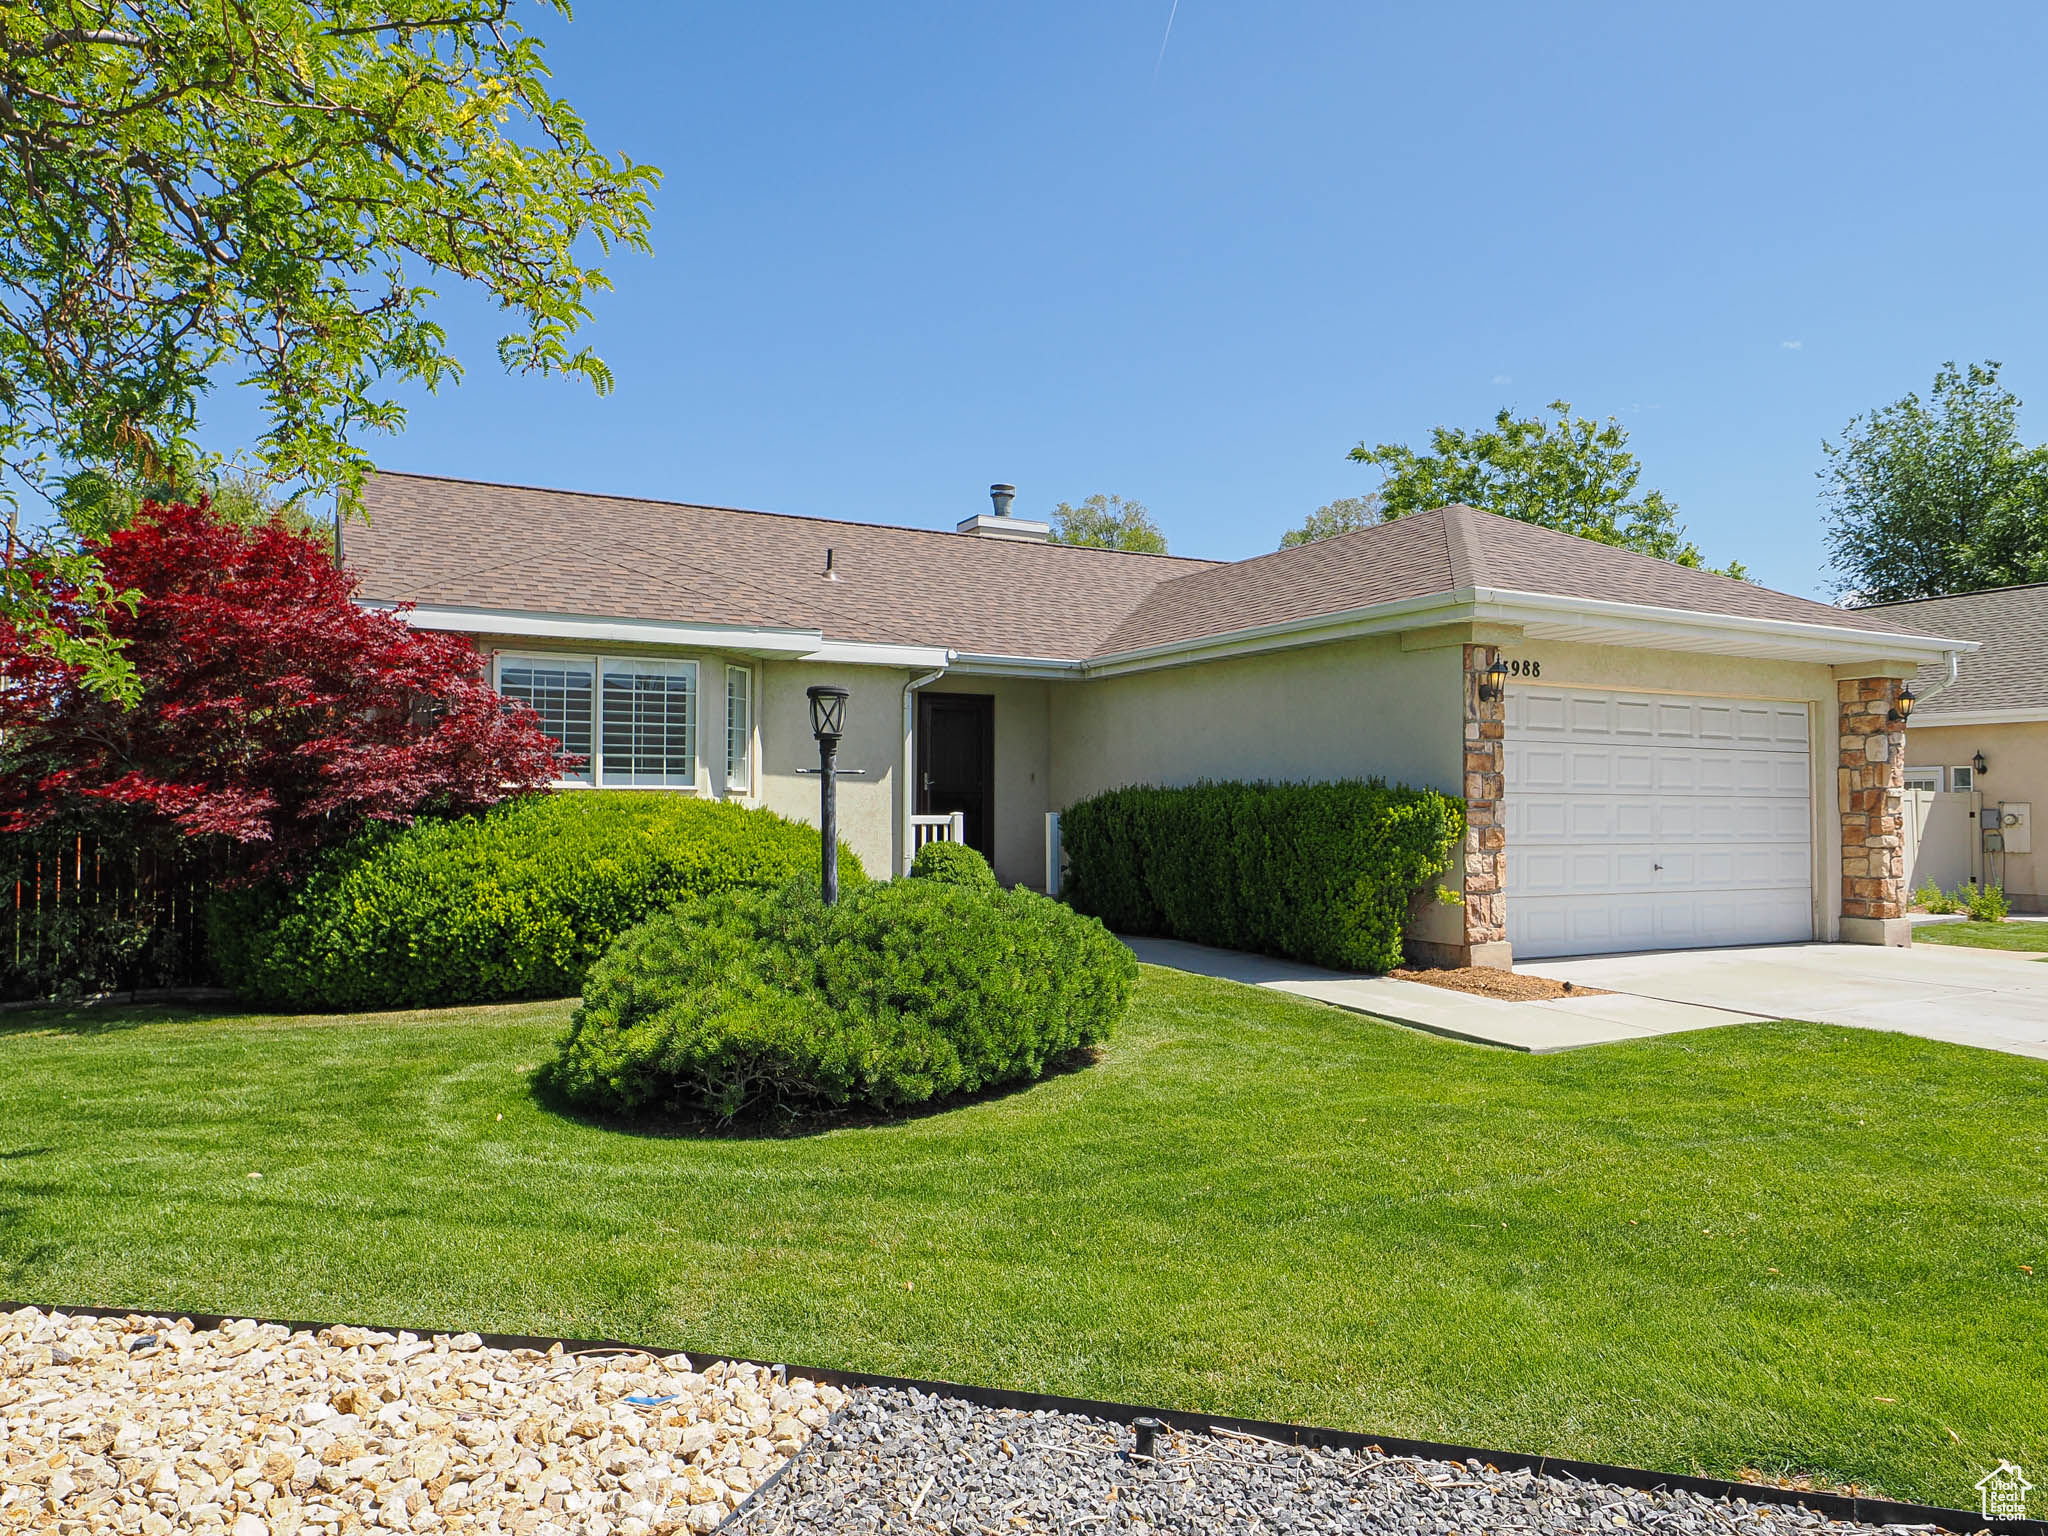
Active
$549,900
3
bds
|
2
ba
|
3,436
sqft
|
built
1997
3988 W Sugar Beet Dr, Salt Lake City, UT 84120
$-1,580
Cash flow
-15.0%
Cash-on-Cash Return
2.8%
Cap rate
0.4%
Rent to Value Ratio
Active
$464,900
5
bds
|
2
ba
|
1,743
sqft
|
built
1974
4445 S Honeywood Ln, Salt Lake City, UT 84120
$-1,090
Cash flow
-12.2%
Cash-on-Cash Return
3.5%
Cap rate
0.5%
Rent to Value Ratio
Active under contract
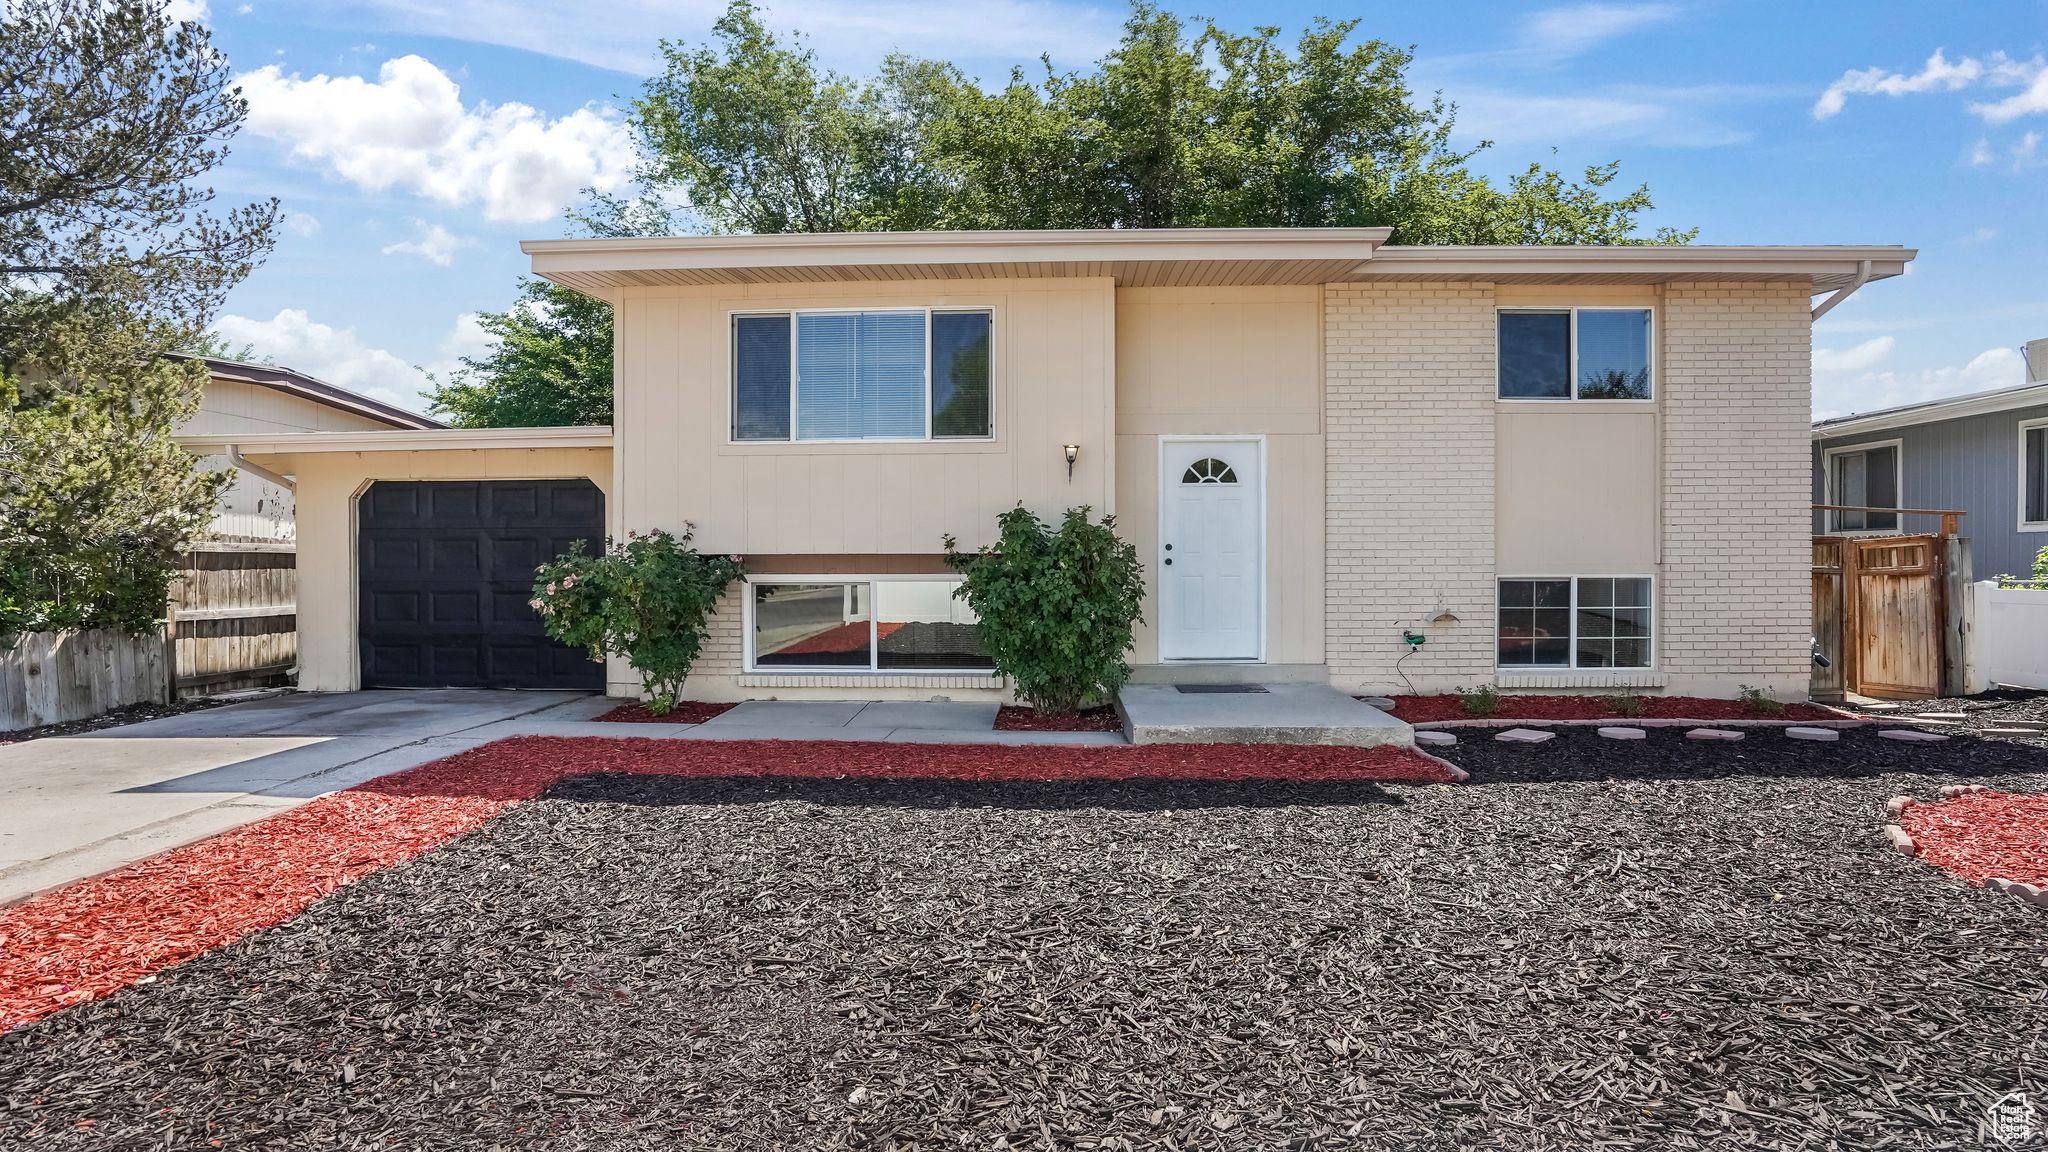
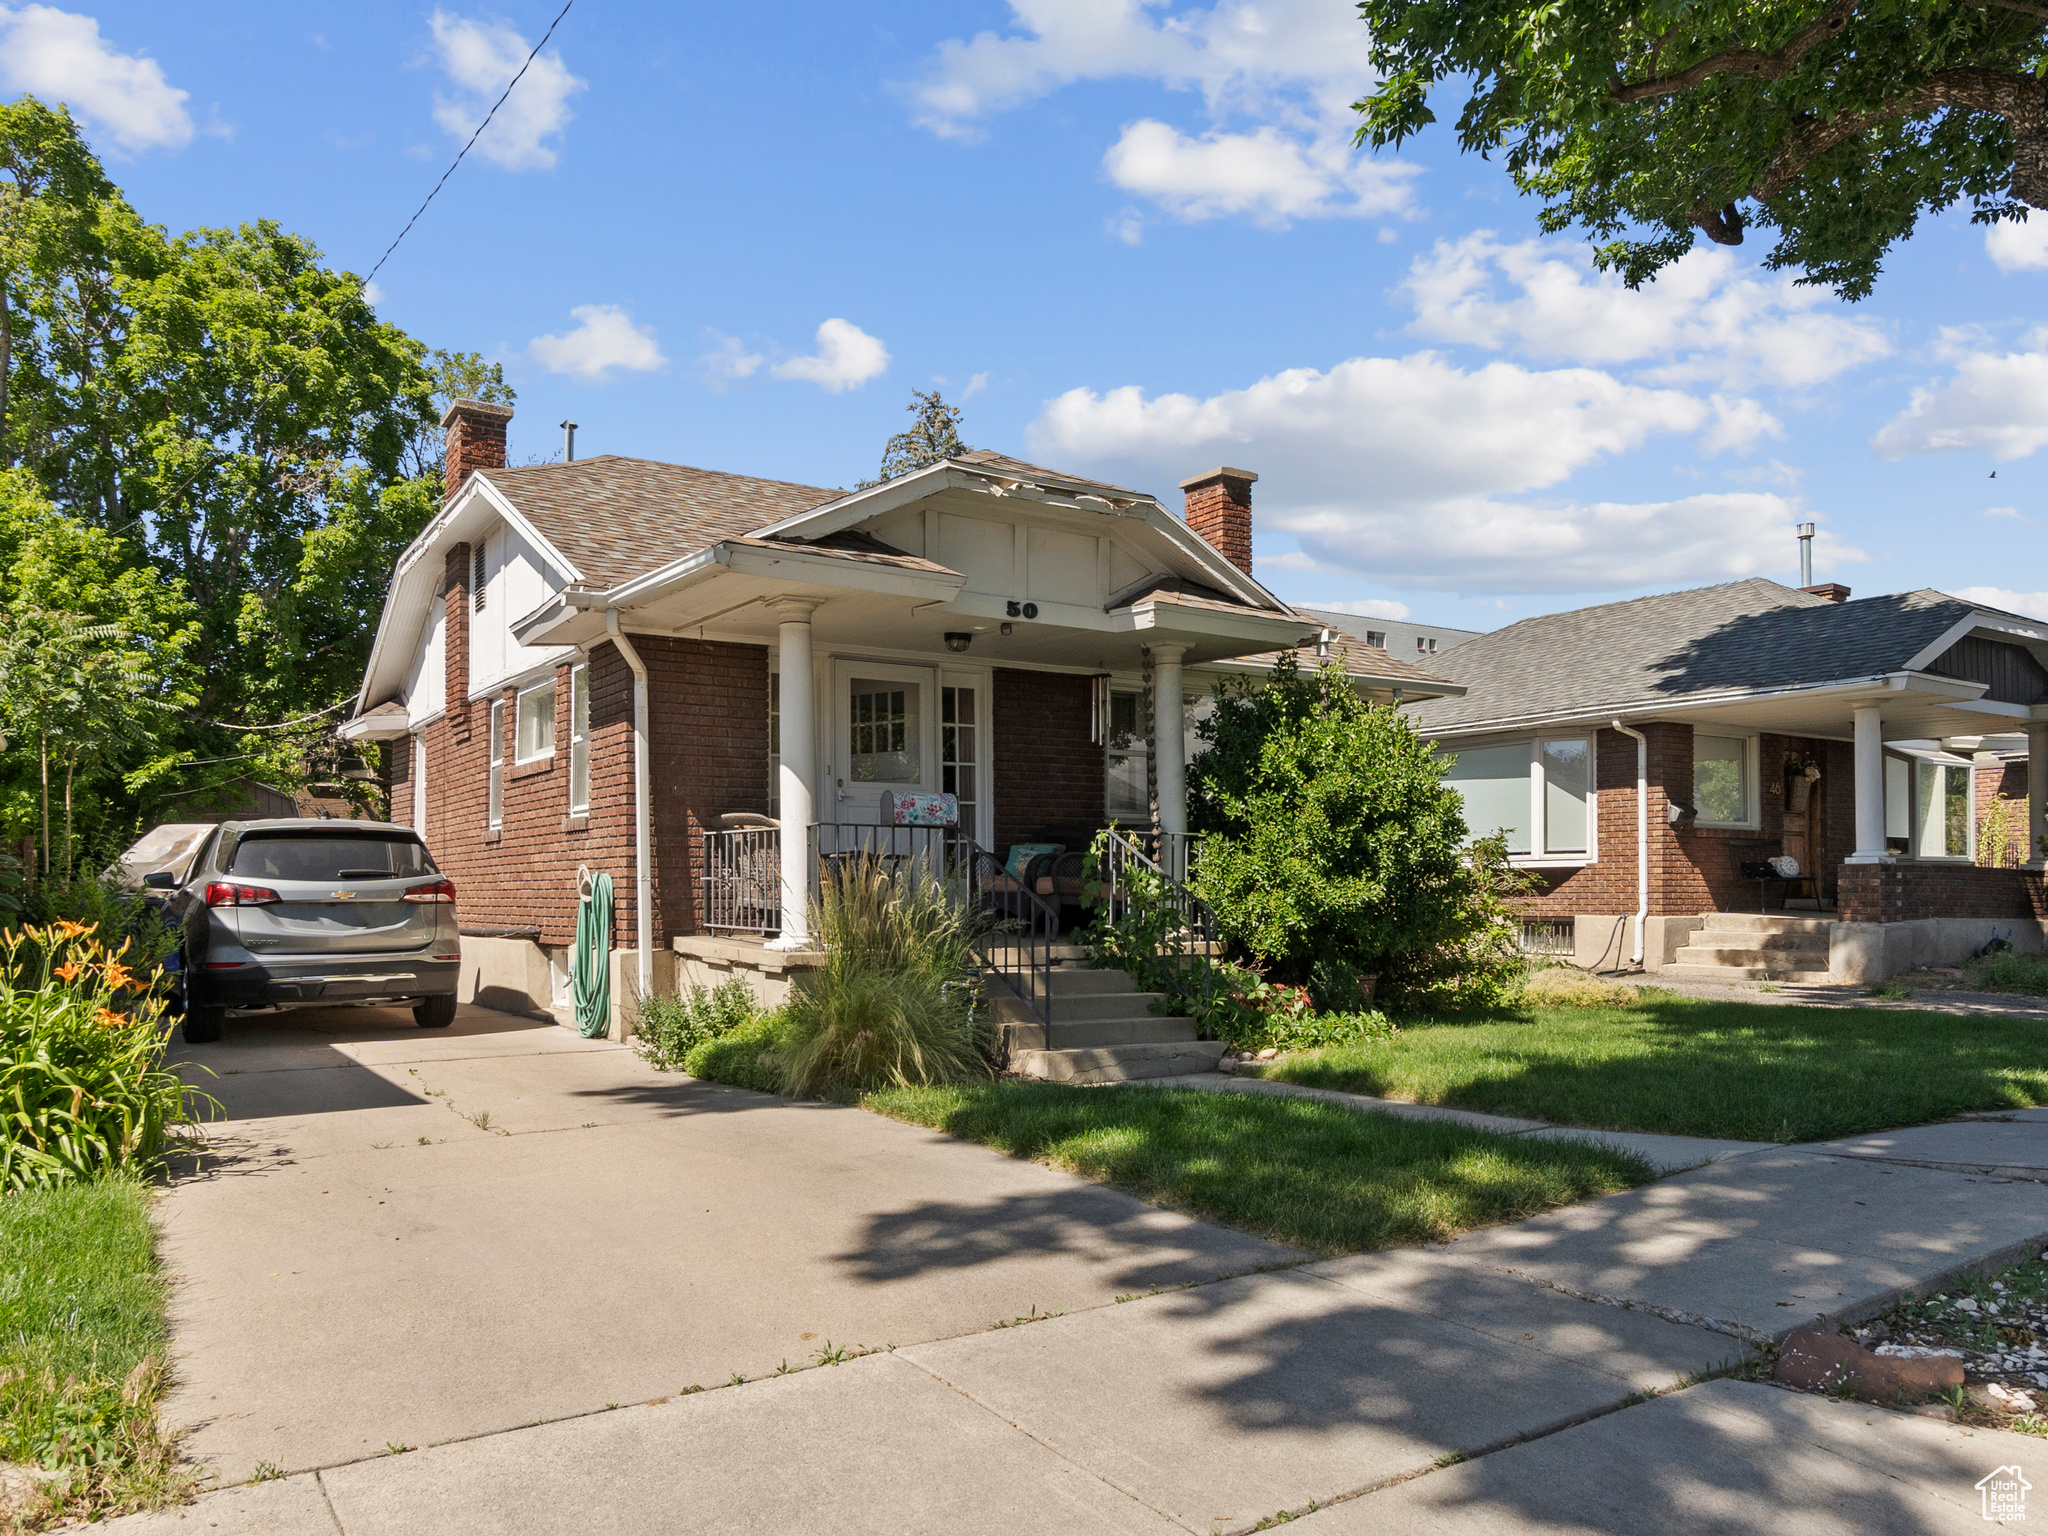
$395,000
2
bds
|
1
ba
|
1,353
sqft
|
built
1924
50 W Layton Ave, Salt Lake City, UT 84115
$-1,028
Cash flow
-13.6%
Cash-on-Cash Return
3.2%
Cap rate
0.4%
Rent to Value Ratio
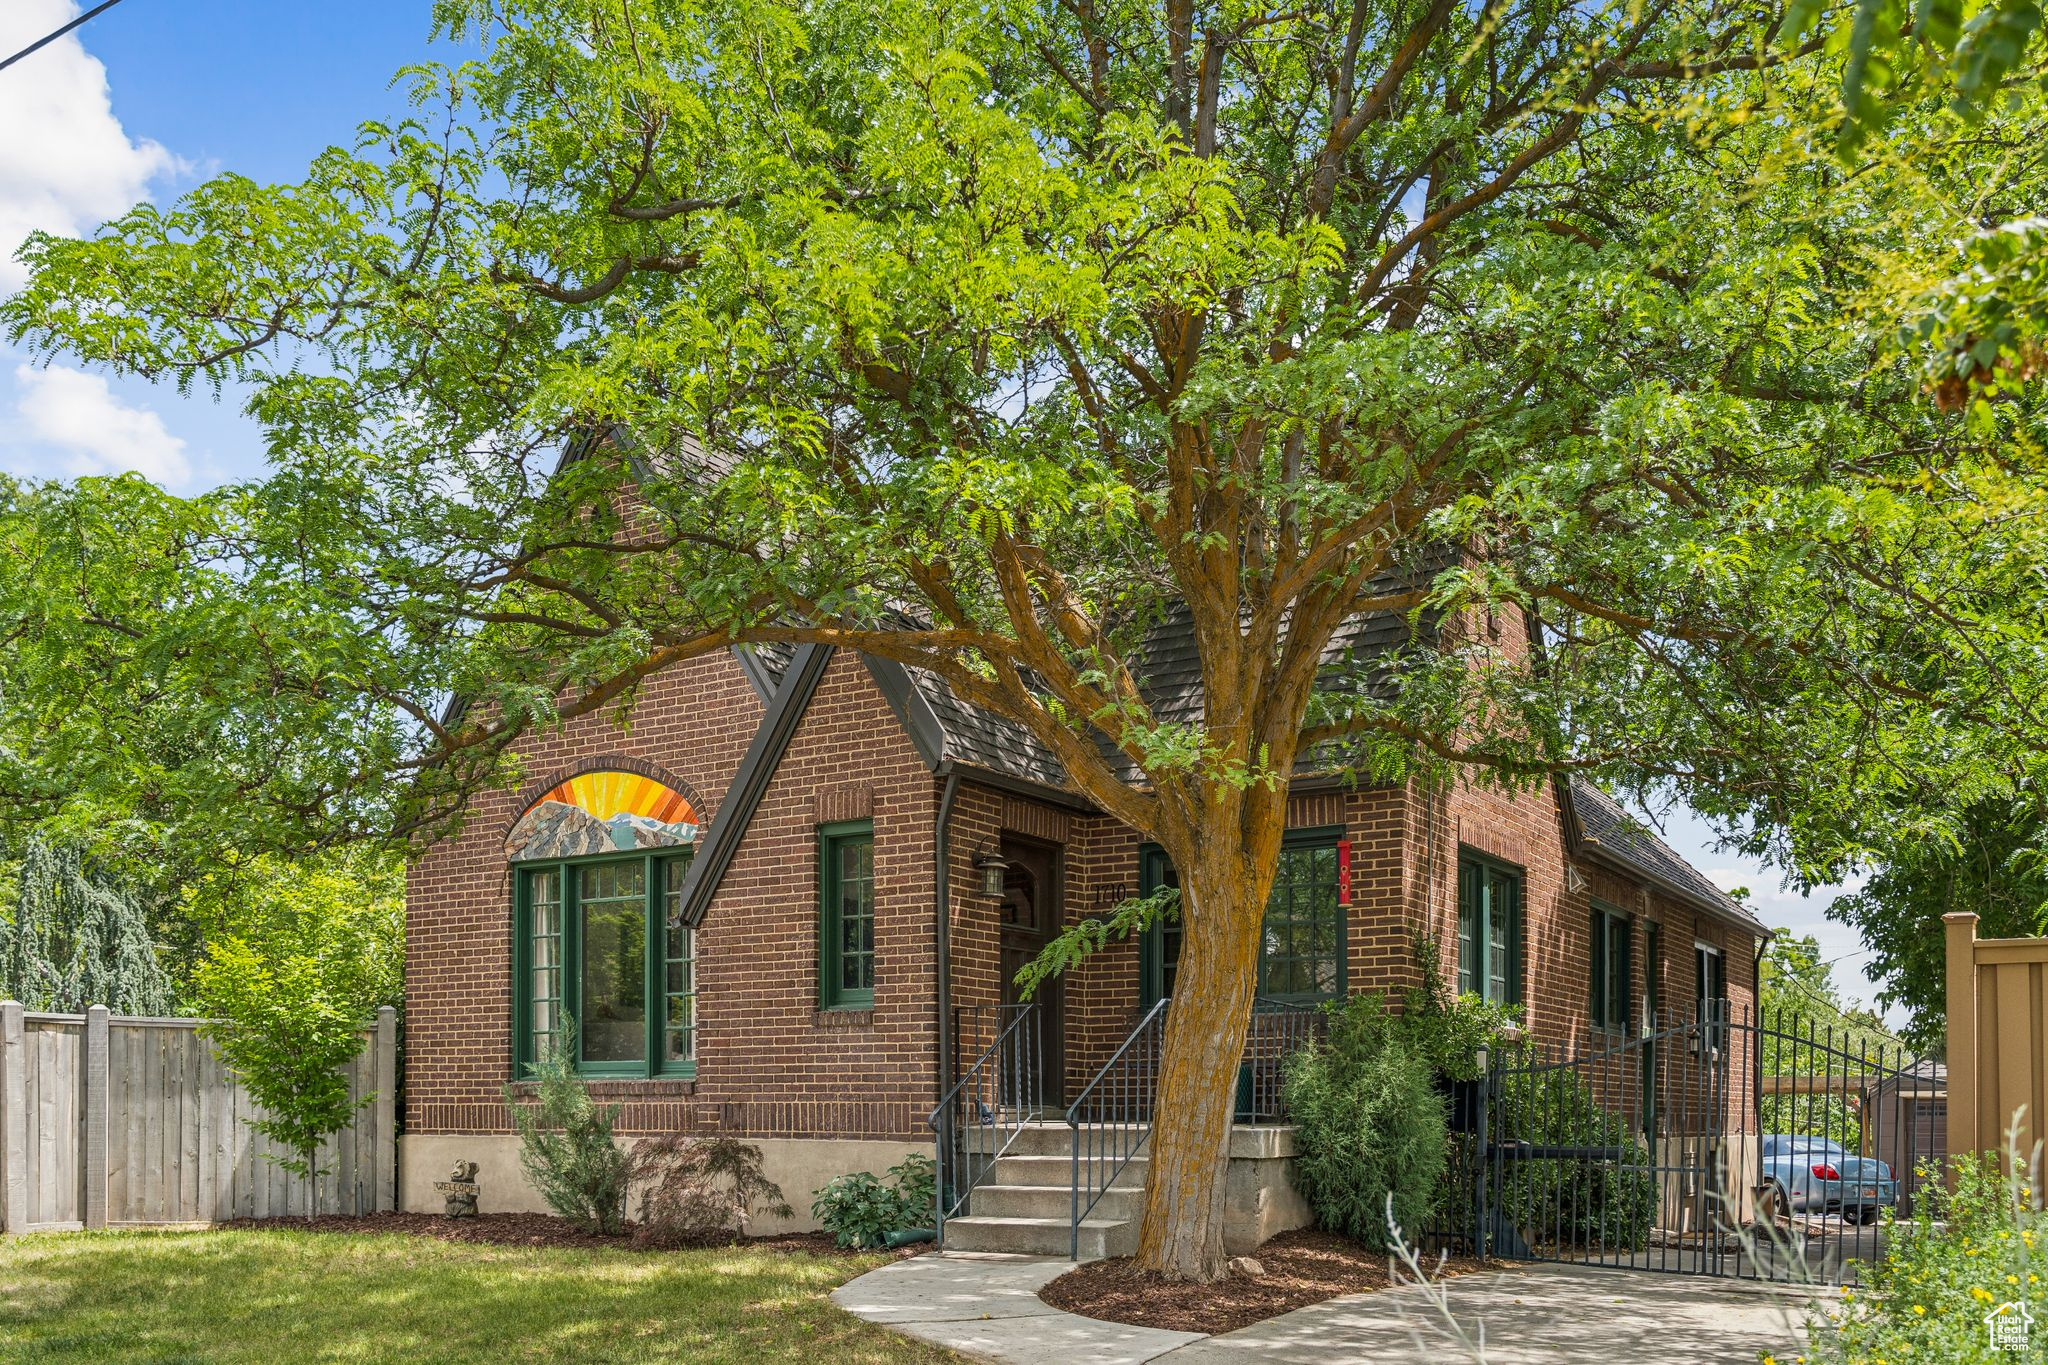
Active
$1,350,000
3
bds
|
2
ba
|
2,291
sqft
|
built
1928
1710 E 900 S, Salt Lake City, UT 84108
$-5,267
Cash flow
-20.4%
Cash-on-Cash Return
1.6%
Cap rate
0.2%
Rent to Value Ratio
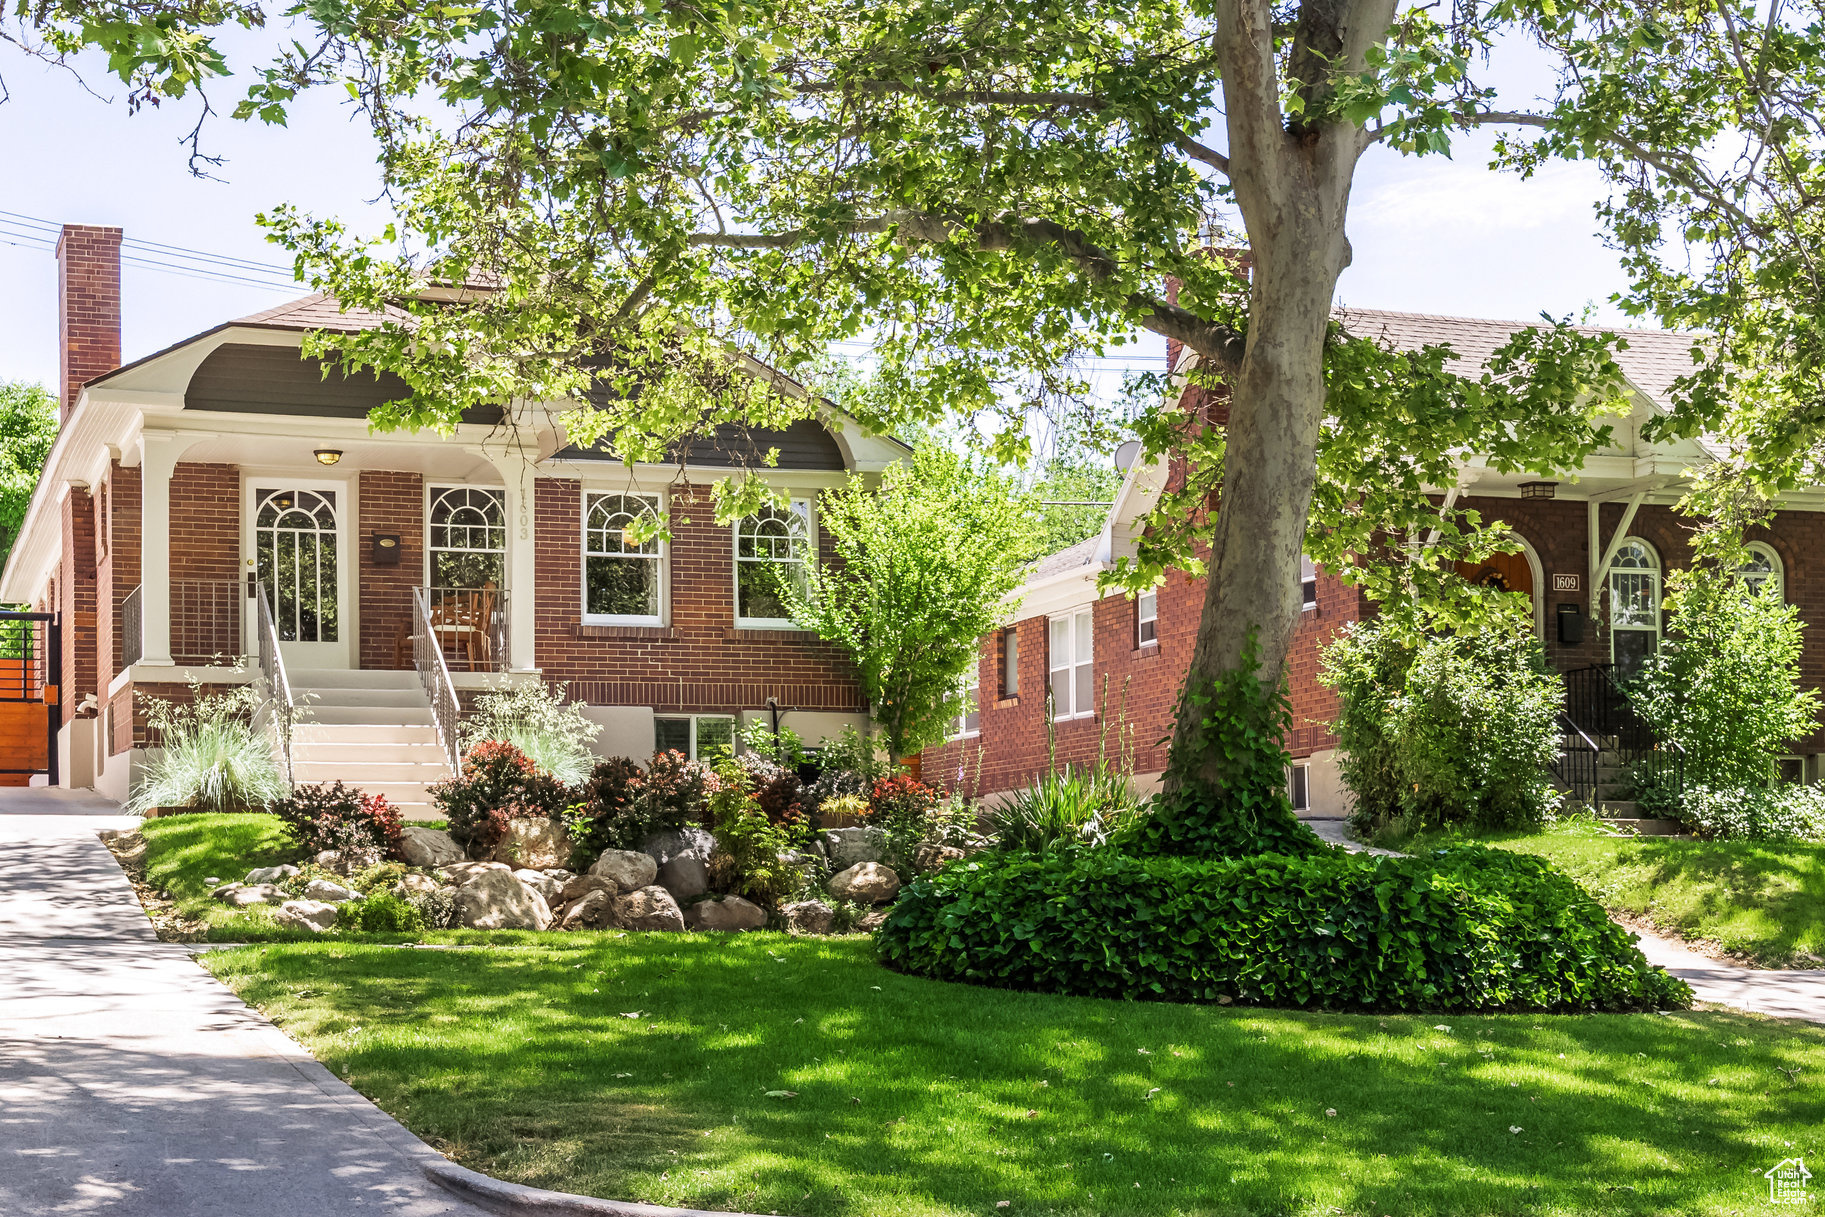
Pending
$885,000
5
bds
|
3
ba
|
2,200
sqft
|
built
1925
1603 S 1600 E, Salt Lake City, UT 84105
$-3,296
Cash flow
-19.4%
Cash-on-Cash Return
1.8%
Cap rate
0.3%
Rent to Value Ratio
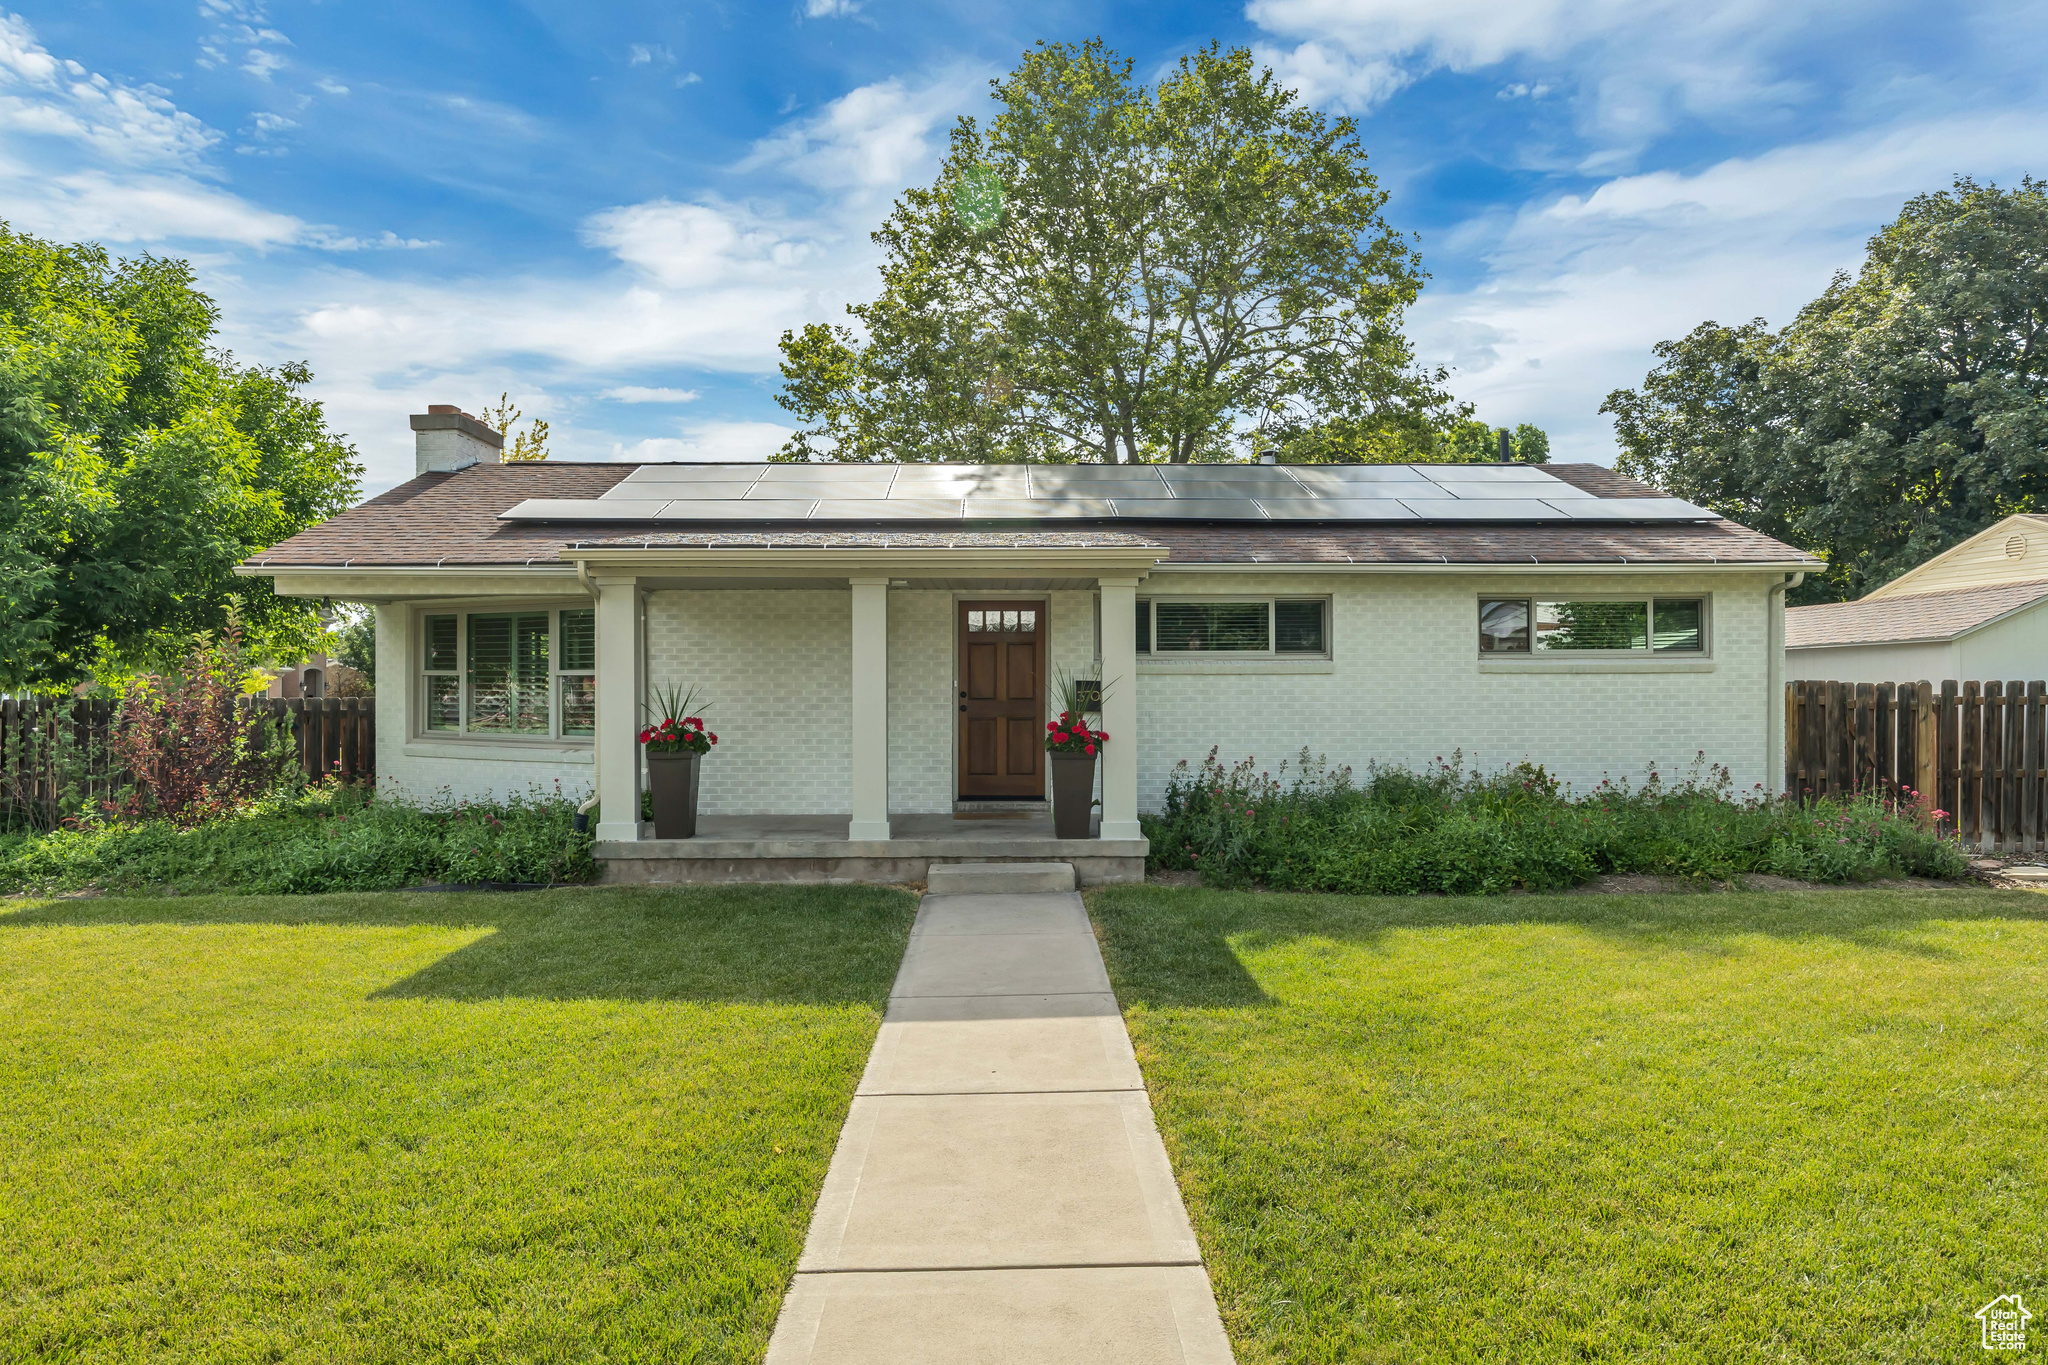
Pending
$779,000
4
bds
|
2
ba
|
2,256
sqft
|
built
1950
2612 S 1900 E, Salt Lake City, UT 84106
$-1,896
Cash flow
-12.7%
Cash-on-Cash Return
3.4%
Cap rate
0.4%
Rent to Value Ratio
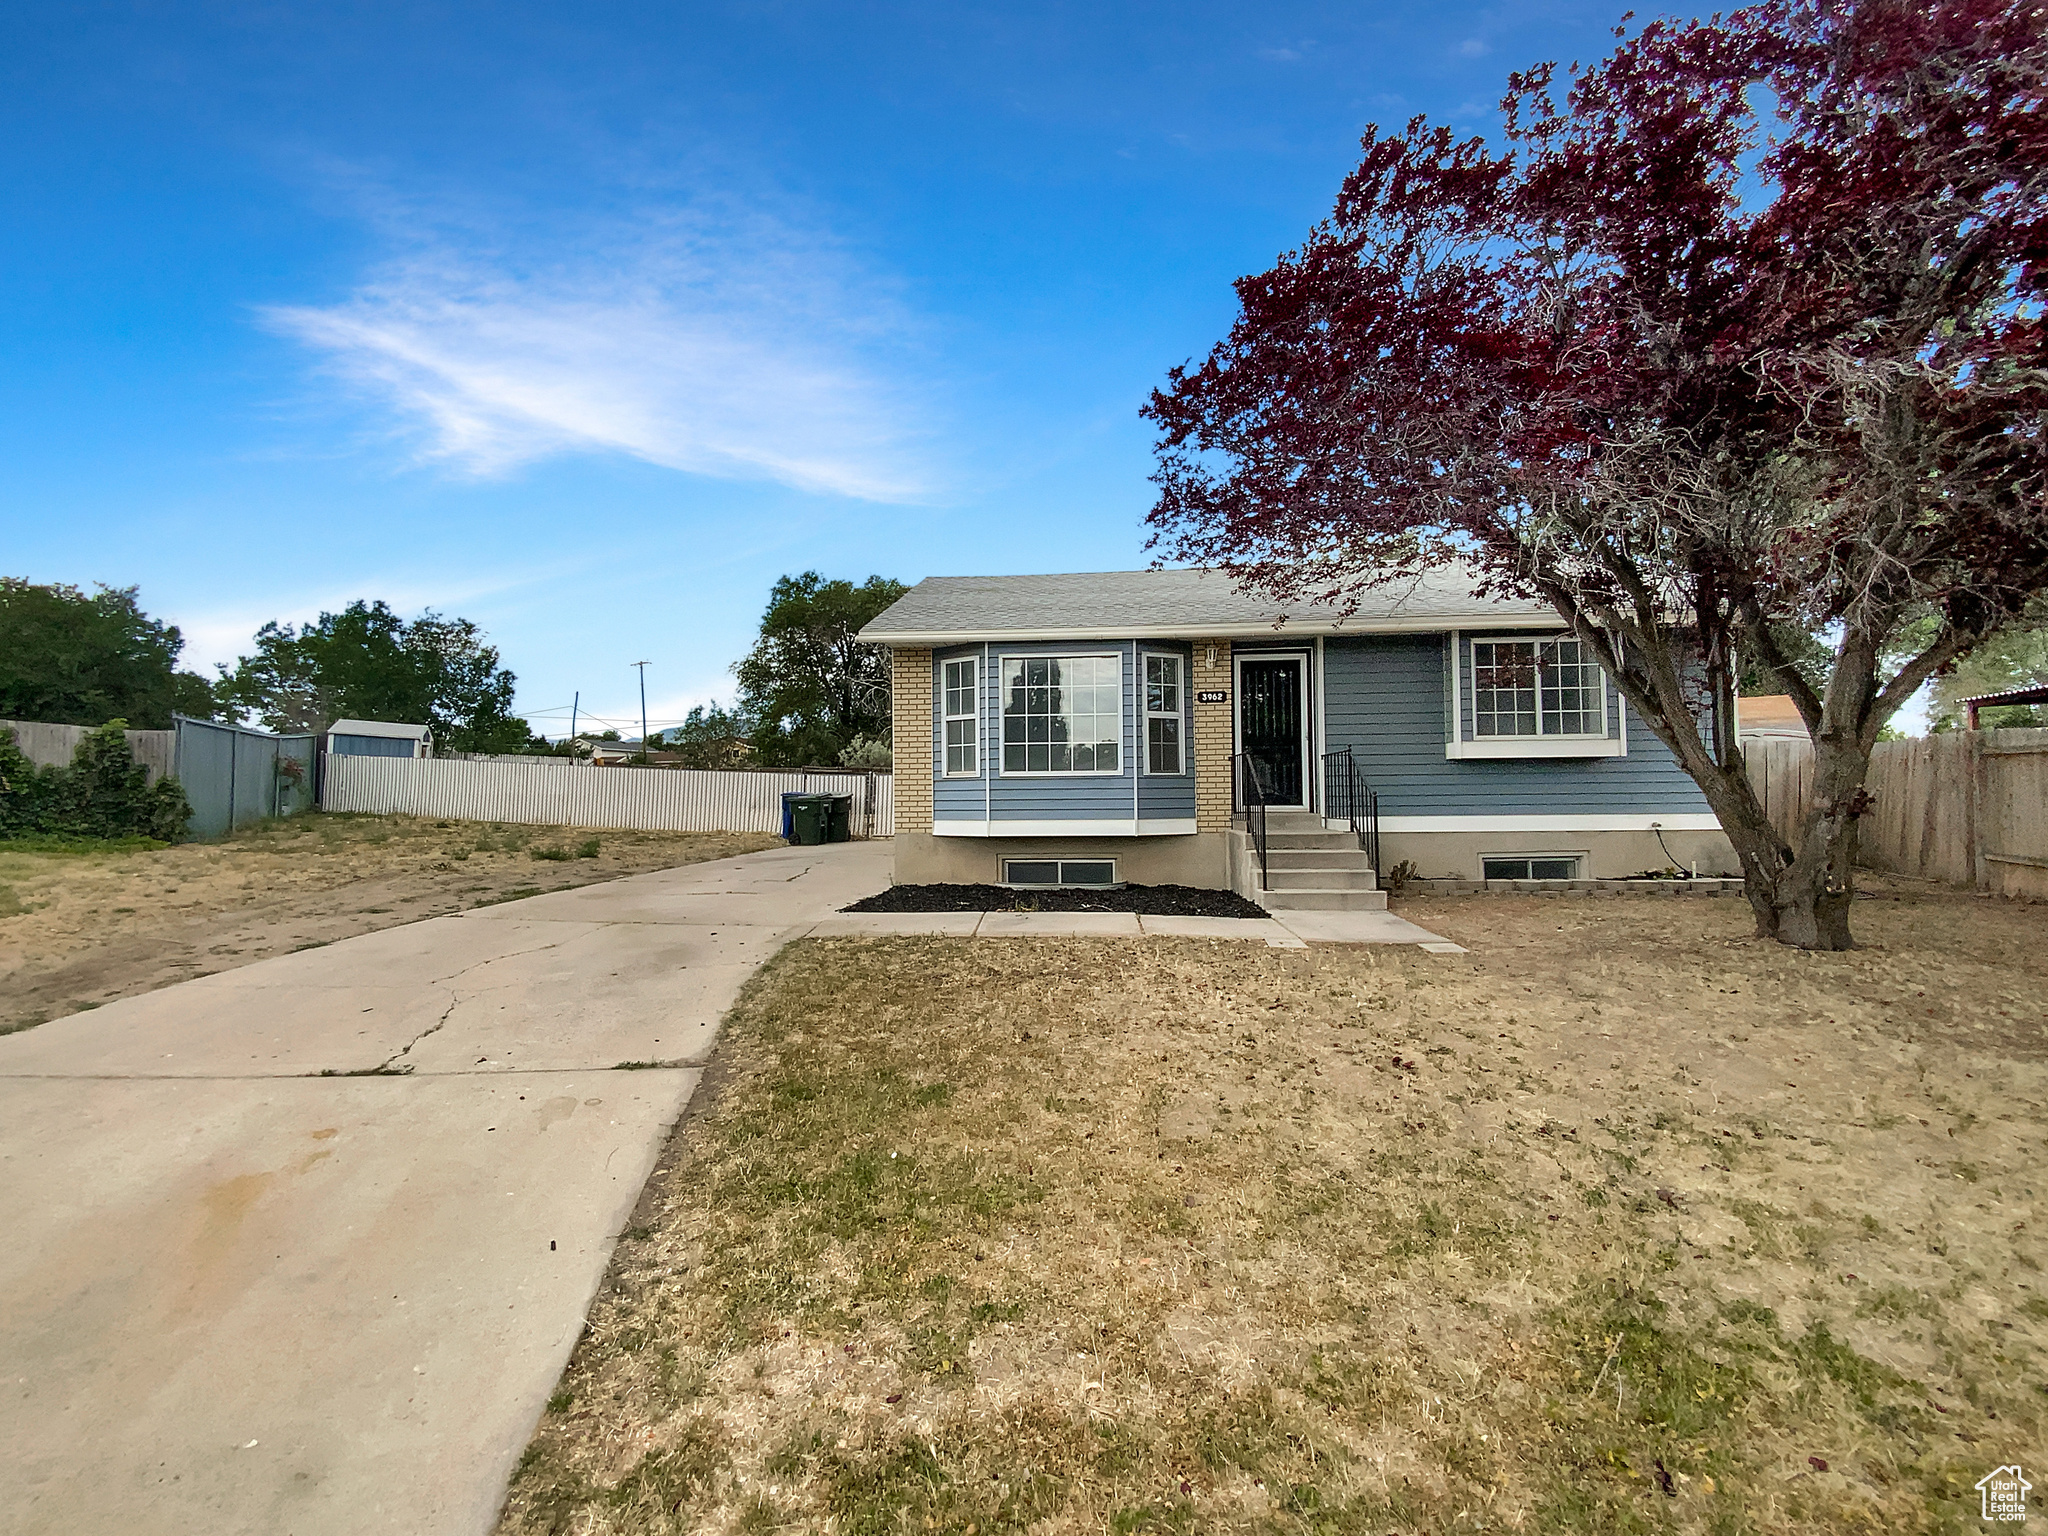
Active
$457,000
5
bds
|
2
ba
|
1,812
sqft
|
built
1986
3962 S 6360 W, Salt Lake City, UT 84128
$-1,524
Cash flow
-17.4%
Cash-on-Cash Return
2.3%
Cap rate
0.4%
Rent to Value Ratio
Active
$634,900
3
bds
|
2
ba
|
1,969
sqft
|
built
1953
2948 S 900 E, Salt Lake City, UT 84106
$-2,273
Cash flow
-18.7%
Cash-on-Cash Return
2.0%
Cap rate
0.3%
Rent to Value Ratio
Pending
$399,900
3
bds
|
2
ba
|
1,229
sqft
|
built
1914
472 S 1000 W, Salt Lake City, UT 84104
$-939
Cash flow
-12.3%
Cash-on-Cash Return
3.5%
Cap rate
0.5%
Rent to Value Ratio
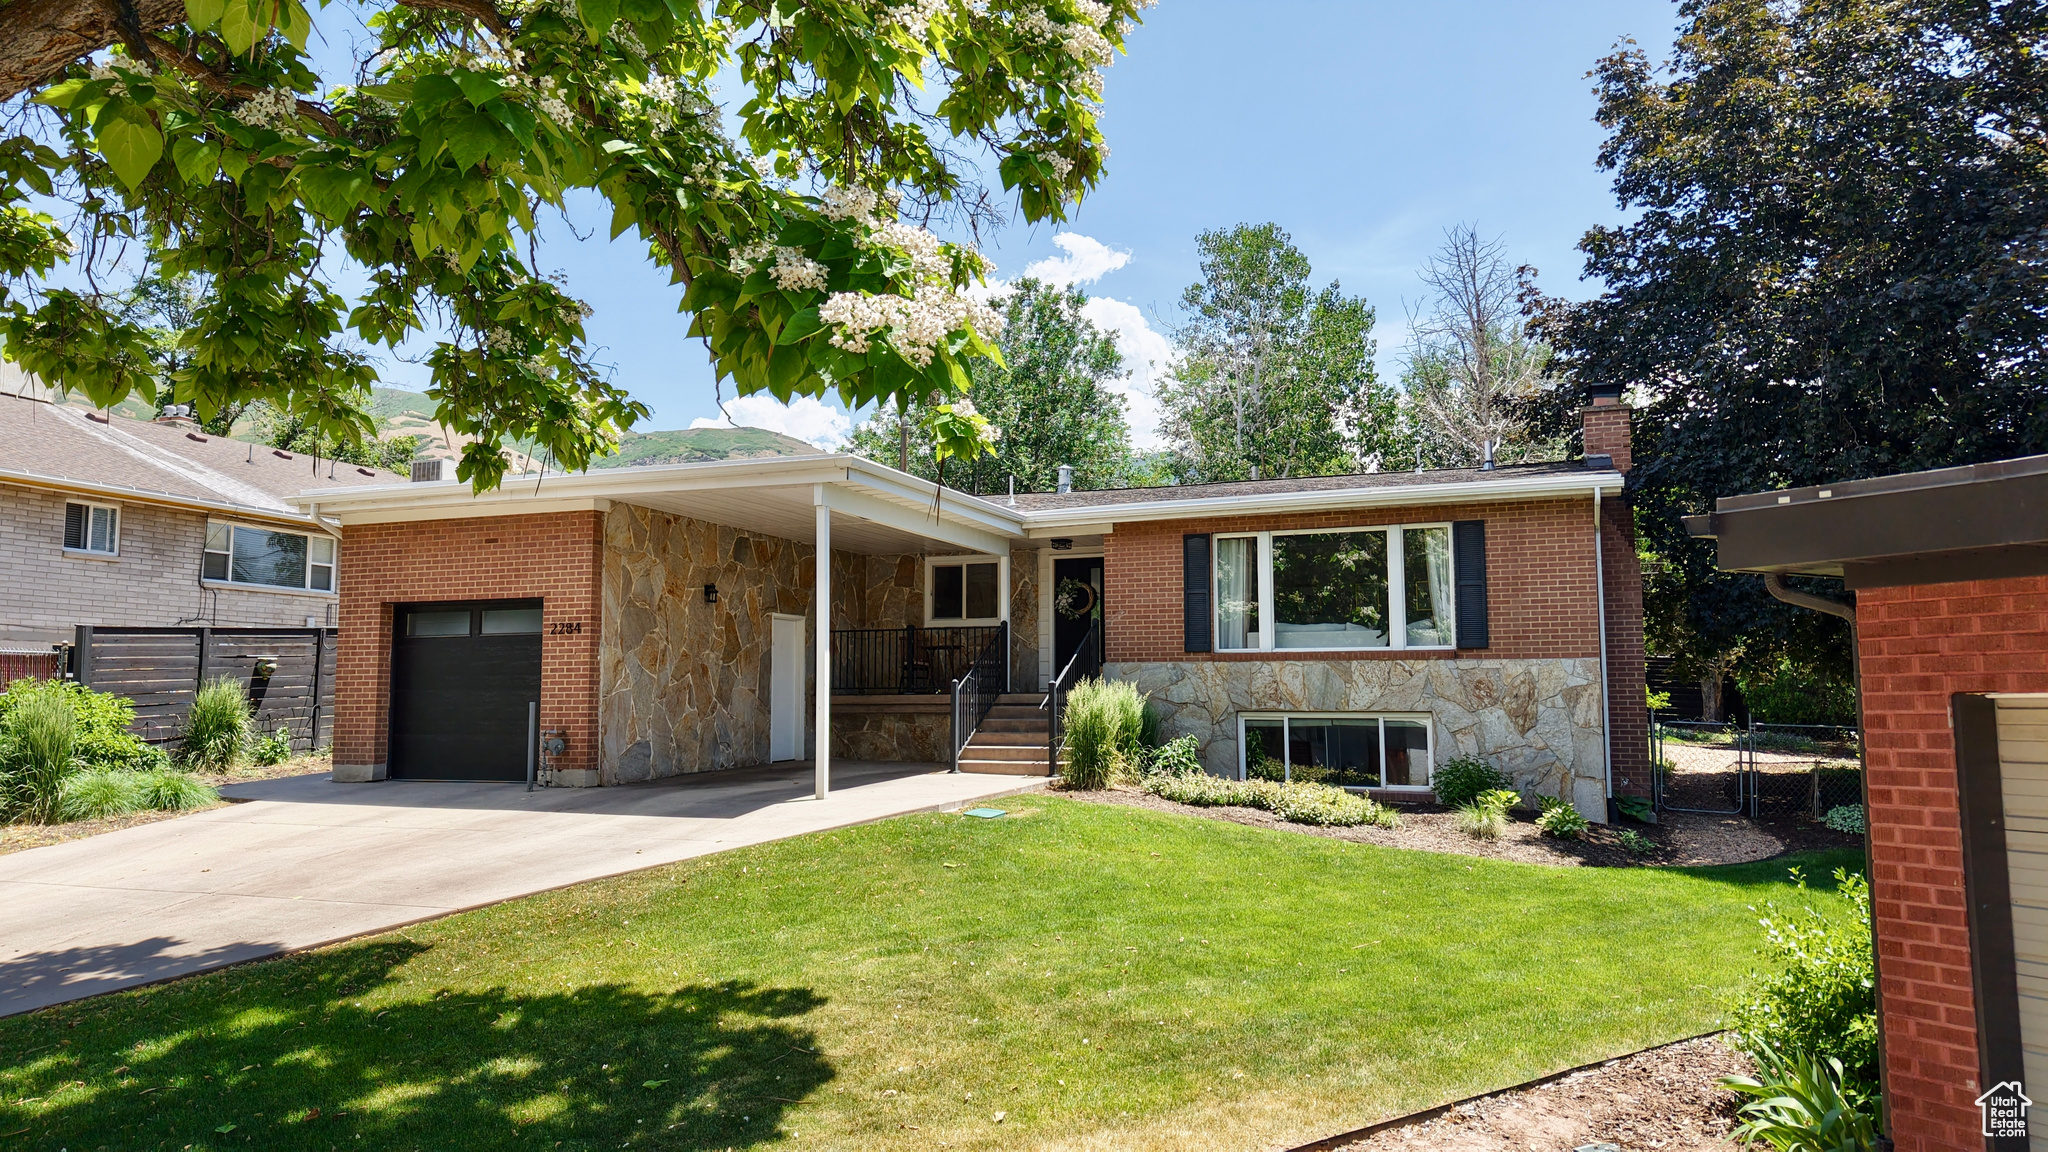
Active
$910,000
5
bds
|
3
ba
|
2,686
sqft
|
built
1956
2284 S Brentwood Cir, Salt Lake City, UT 84109
$-2,090
Cash flow
-12.0%
Cash-on-Cash Return
3.5%
Cap rate
0.5%
Rent to Value Ratio
Active
$669,000
4
bds
|
2
ba
|
1,850
sqft
|
built
1928
1373 S Green St, Salt Lake City, UT 84105
$-1,756
Cash flow
-13.7%
Cash-on-Cash Return
3.1%
Cap rate
0.4%
Rent to Value Ratio
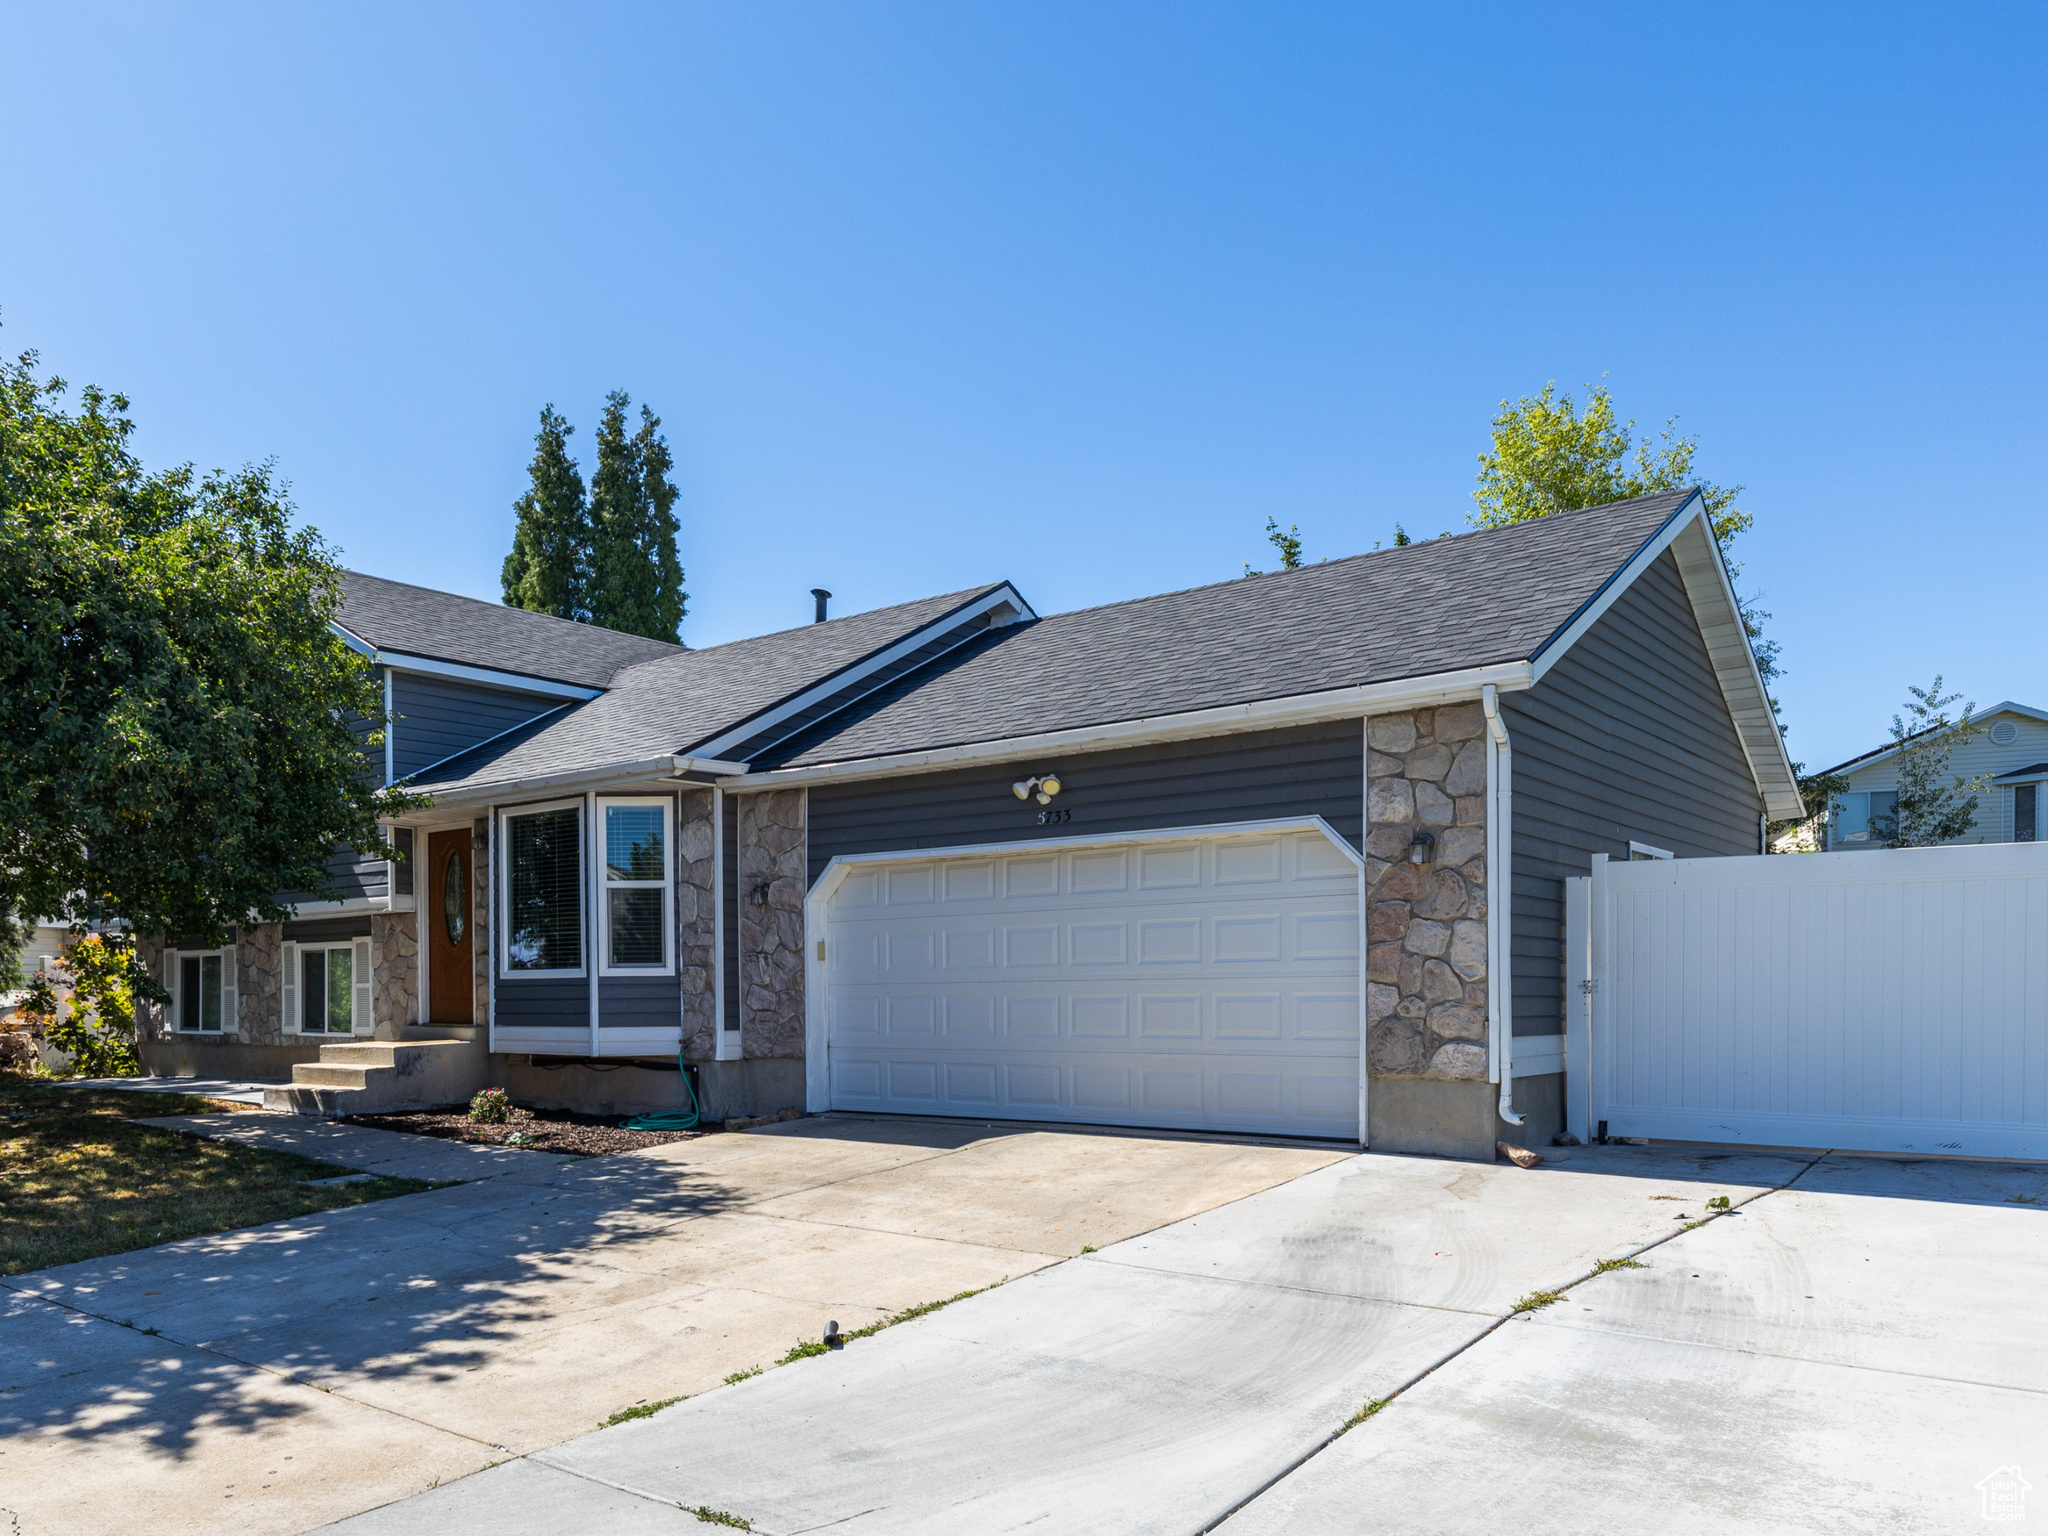
Active
$519,900
5
bds
|
3
ba
|
1,946
sqft
|
built
1990
5733 W Plumbago Ave, Salt Lake City, UT 84118
$-1,261
Cash flow
-12.7%
Cash-on-Cash Return
3.4%
Cap rate
0.5%
Rent to Value Ratio
Active
$695,000
3
bds
|
2
ba
|
1,369
sqft
|
built
1938
1985 S 1000 E, Salt Lake City, UT 84105
$-2,424
Cash flow
-18.2%
Cash-on-Cash Return
2.1%
Cap rate
0.3%
Rent to Value Ratio
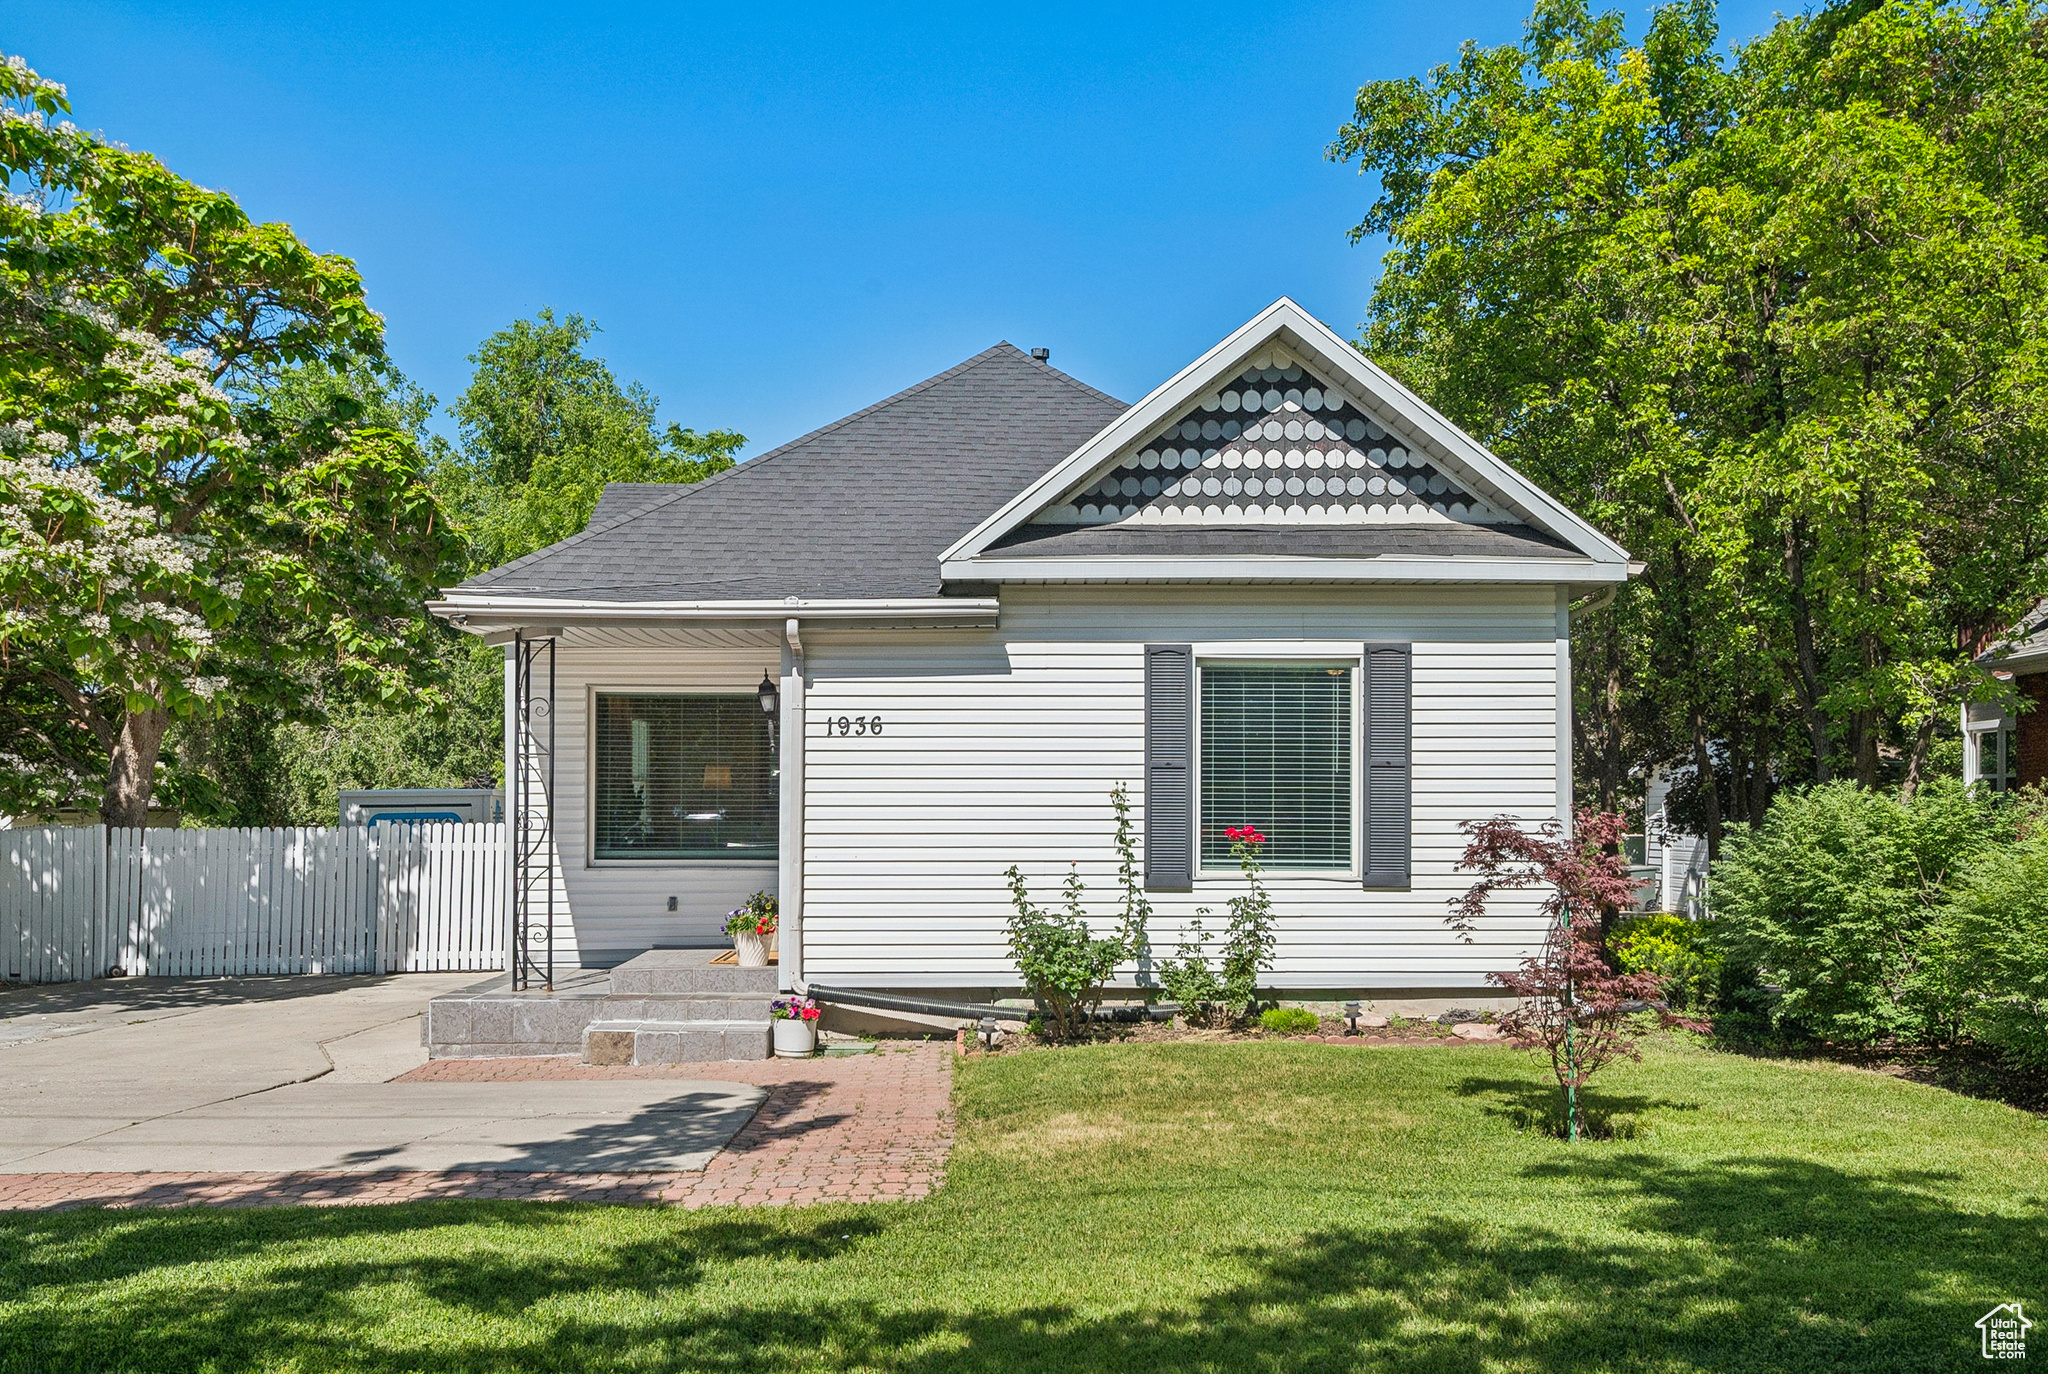
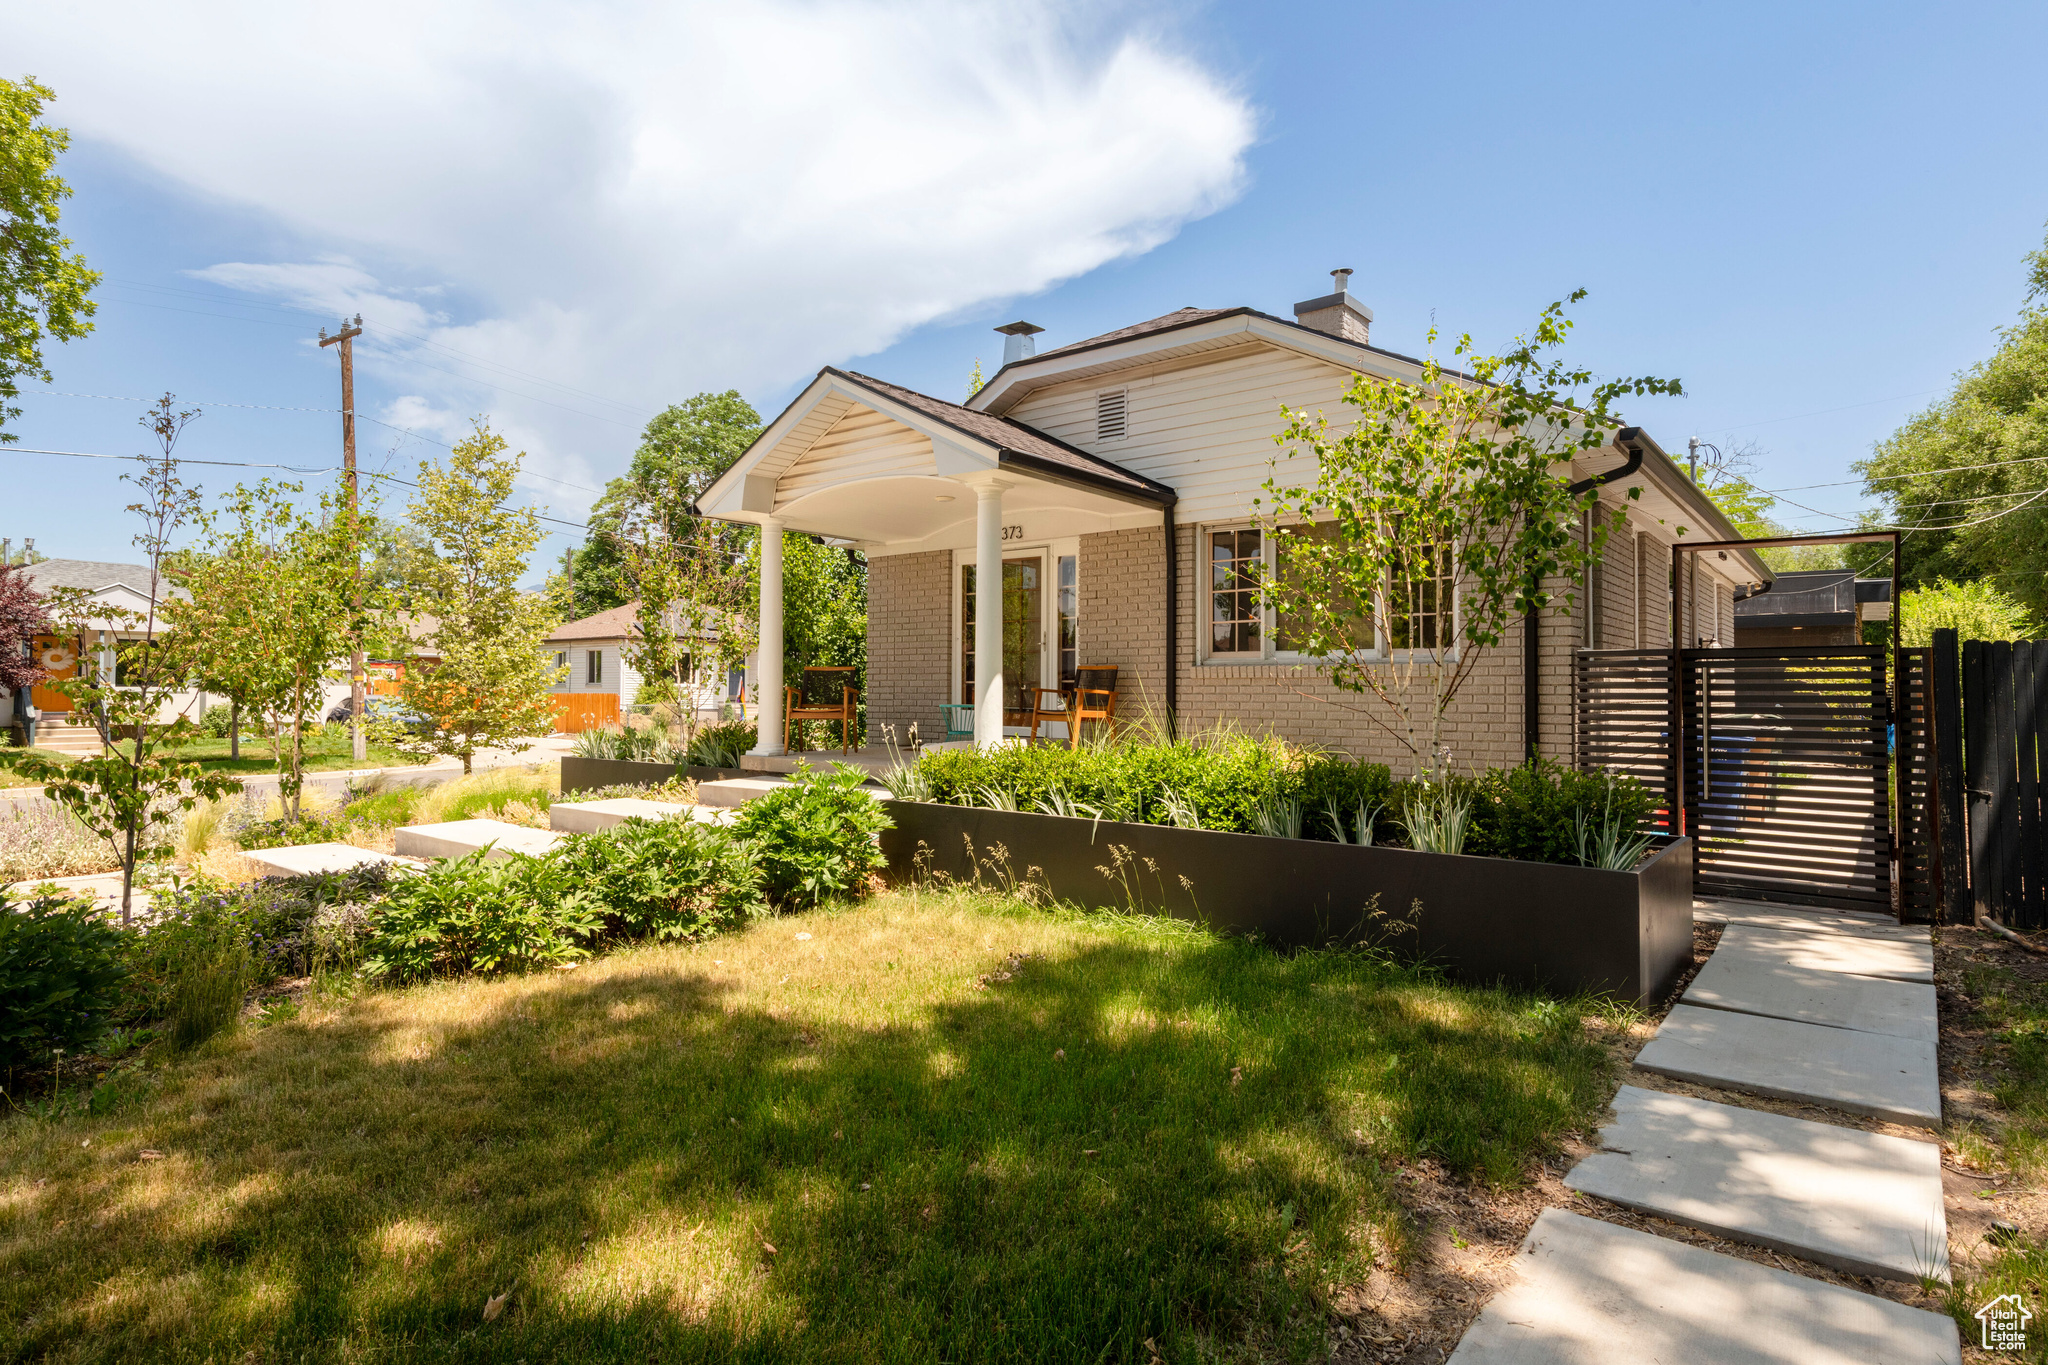
Active
$685,000
4
bds
|
3
ba
|
1,825
sqft
|
built
1906
1936 S 1300 E, Salt Lake City, UT 84105
$-2,144
Cash flow
-16.3%
Cash-on-Cash Return
2.5%
Cap rate
0.4%
Rent to Value Ratio
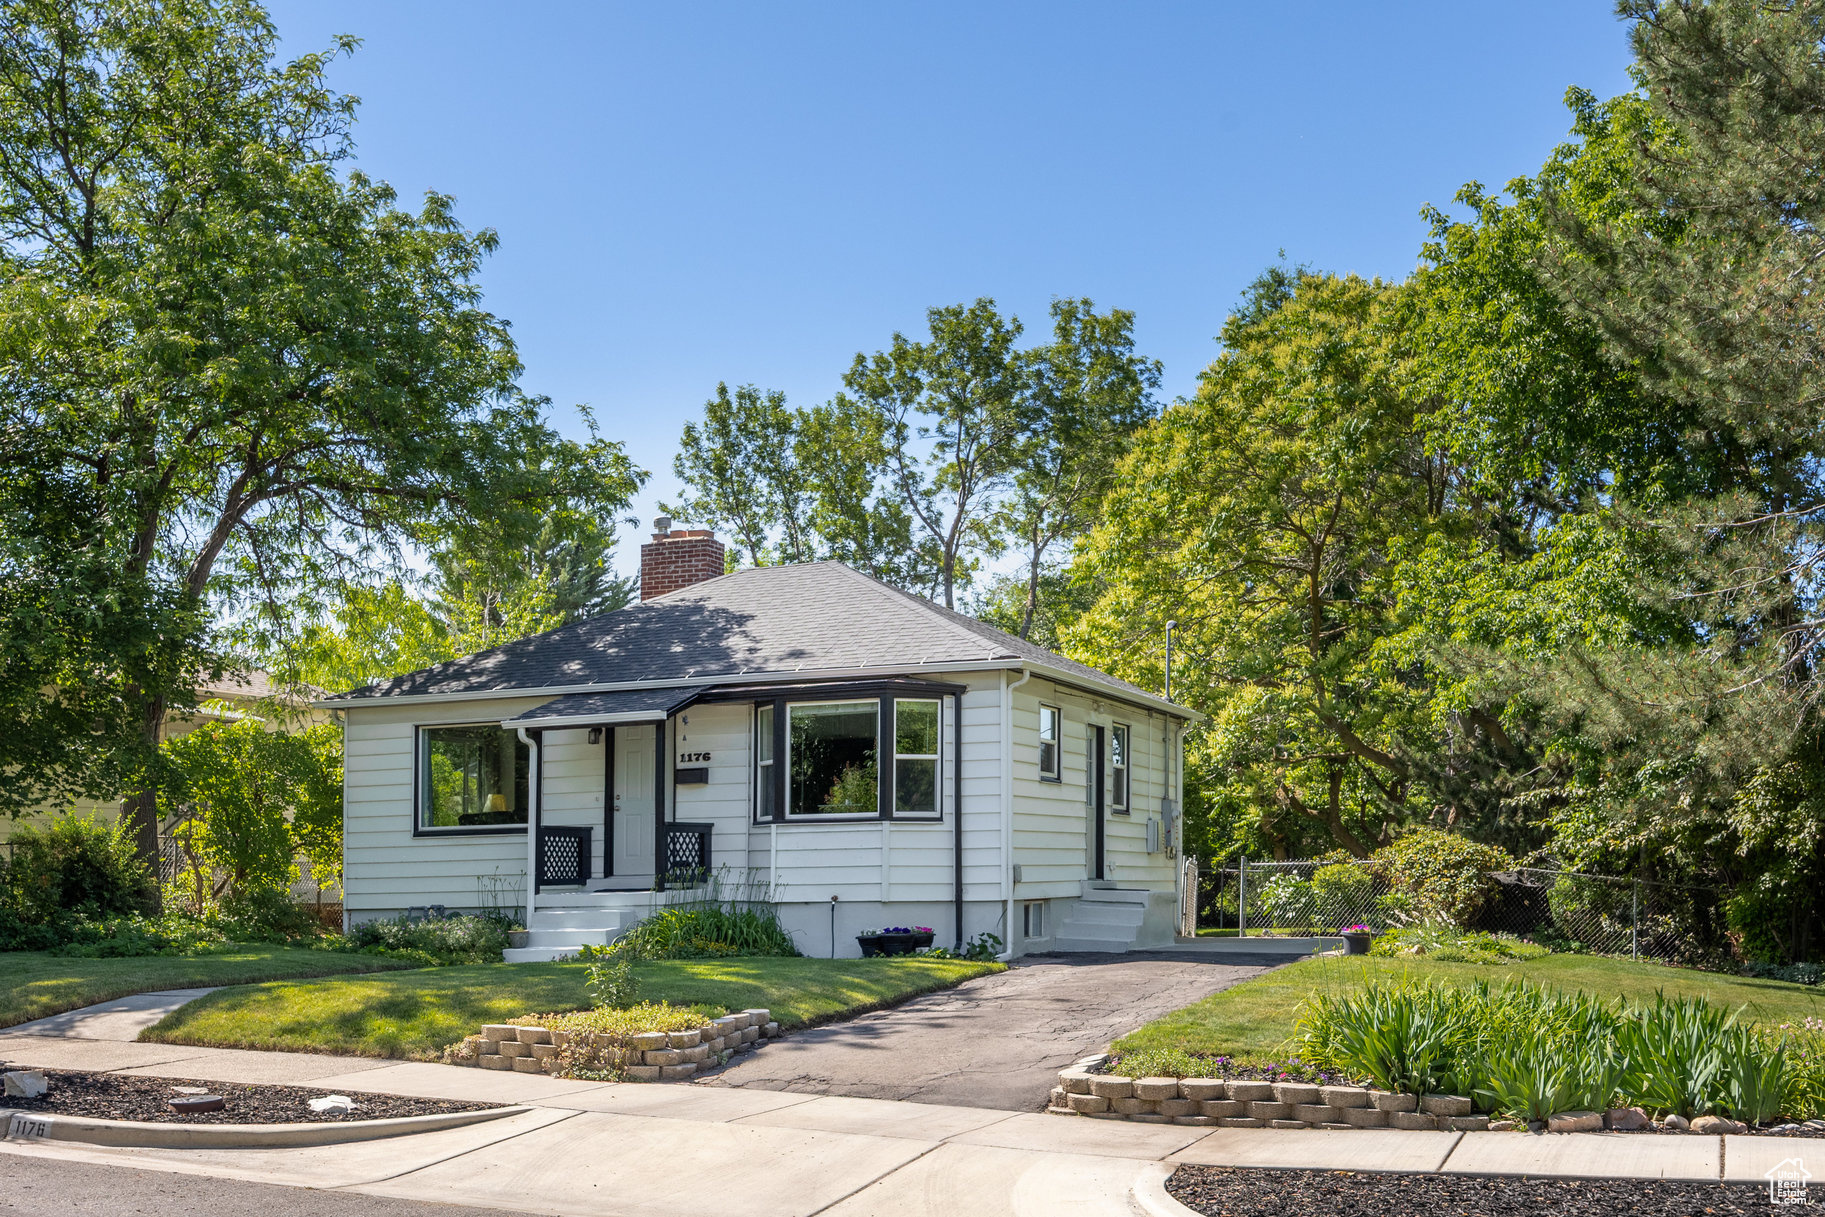
Active under contract
$545,000
4
bds
|
1
ba
|
1,584
sqft
|
built
1948
1176 E Crystal Ave, Salt Lake City, UT 84106
$-1,781
Cash flow
-17.0%
Cash-on-Cash Return
2.4%
Cap rate
0.3%
Rent to Value Ratio
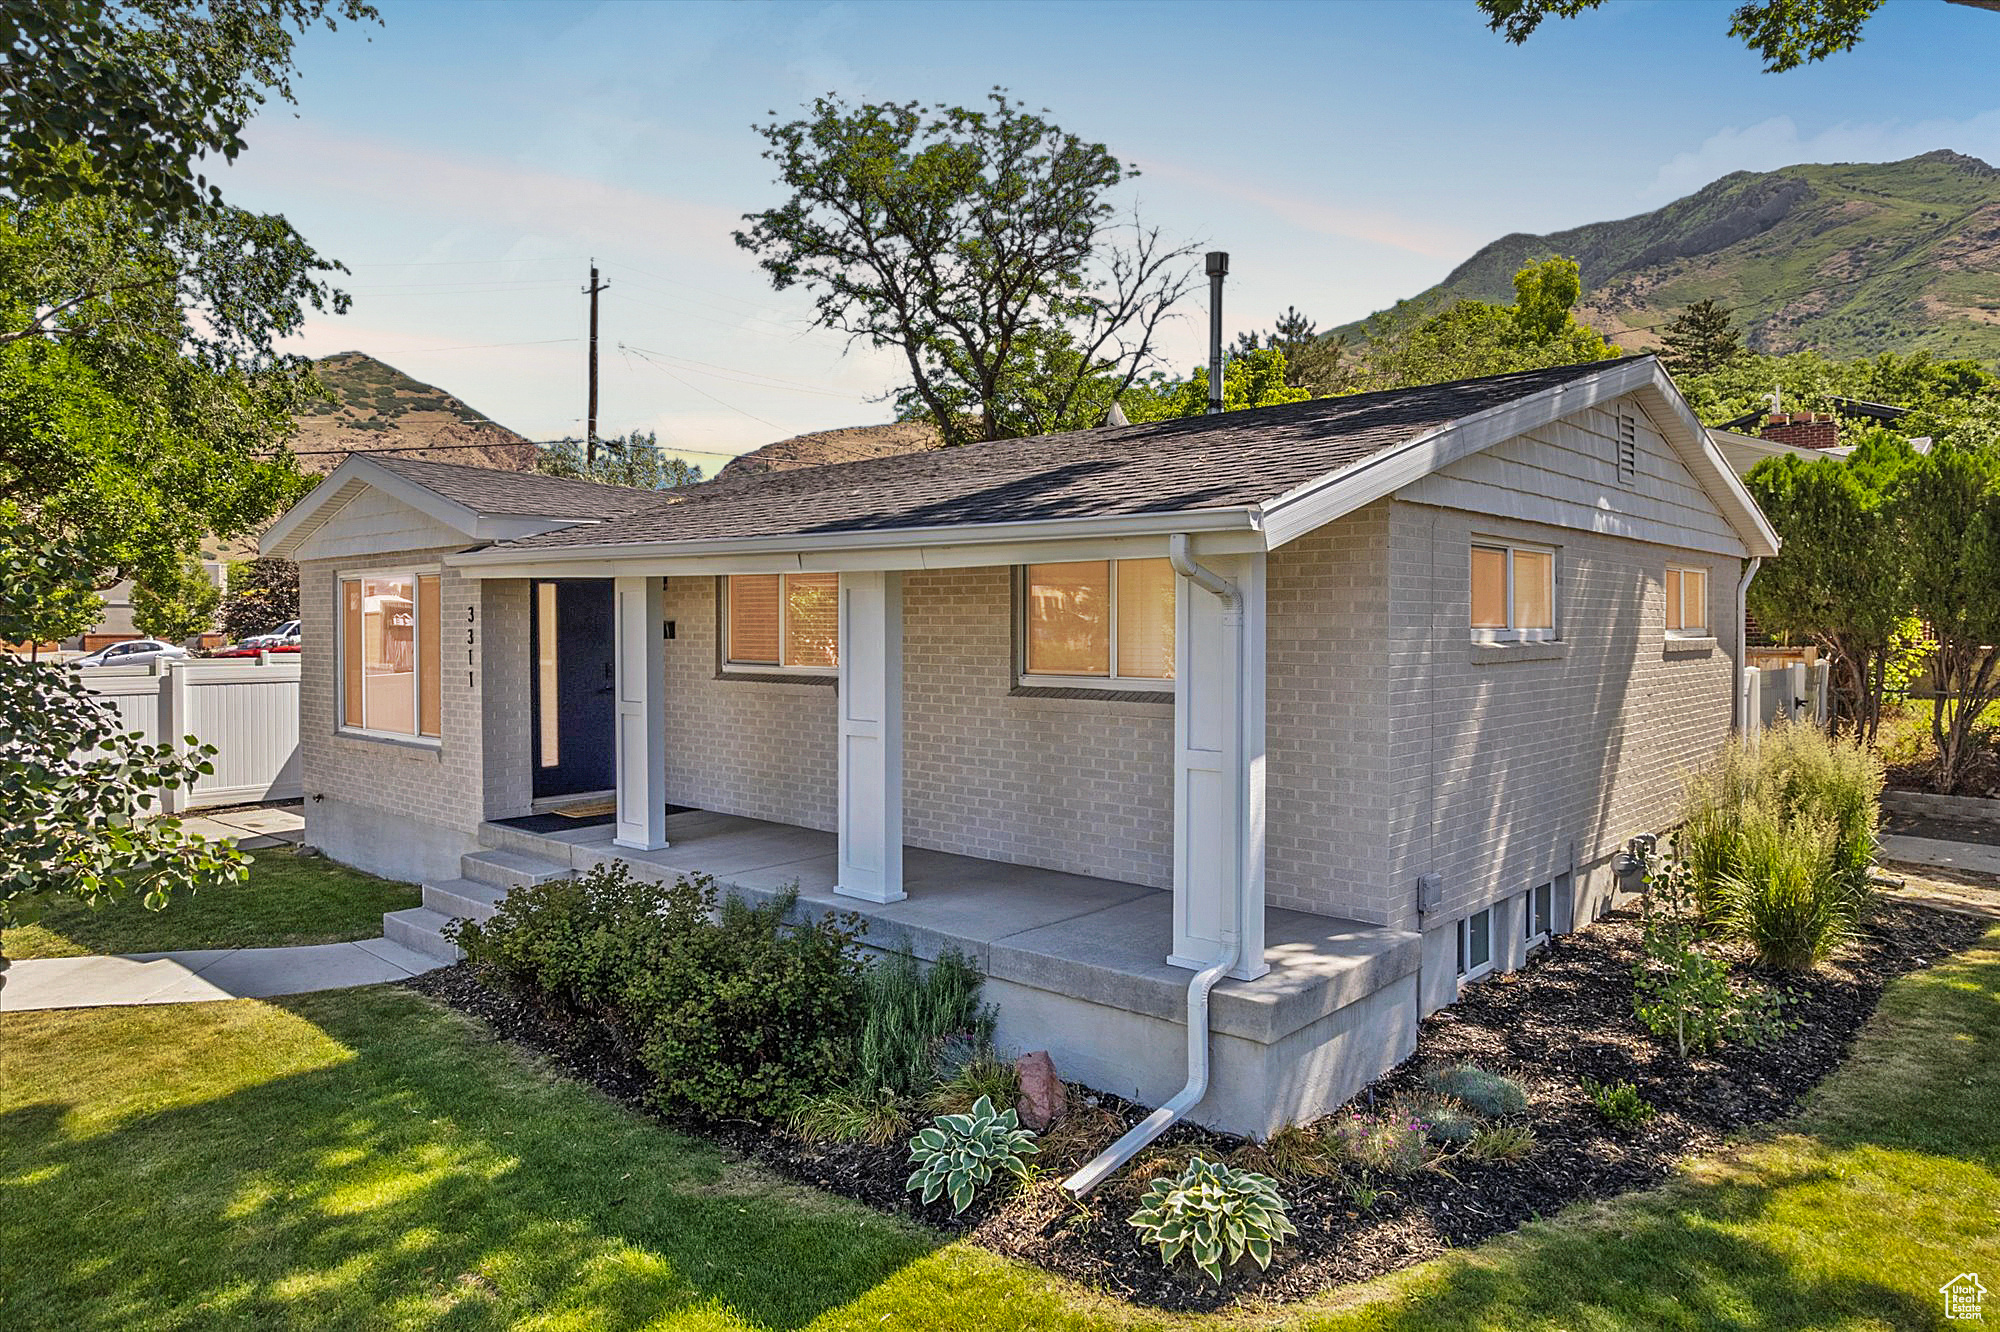
Active
$775,000
5
bds
|
2
ba
|
2,054
sqft
|
built
1954
3311 S 3300 E, Salt Lake City, UT 84109
$-1,916
Cash flow
-12.9%
Cash-on-Cash Return
3.3%
Cap rate
0.5%
Rent to Value Ratio
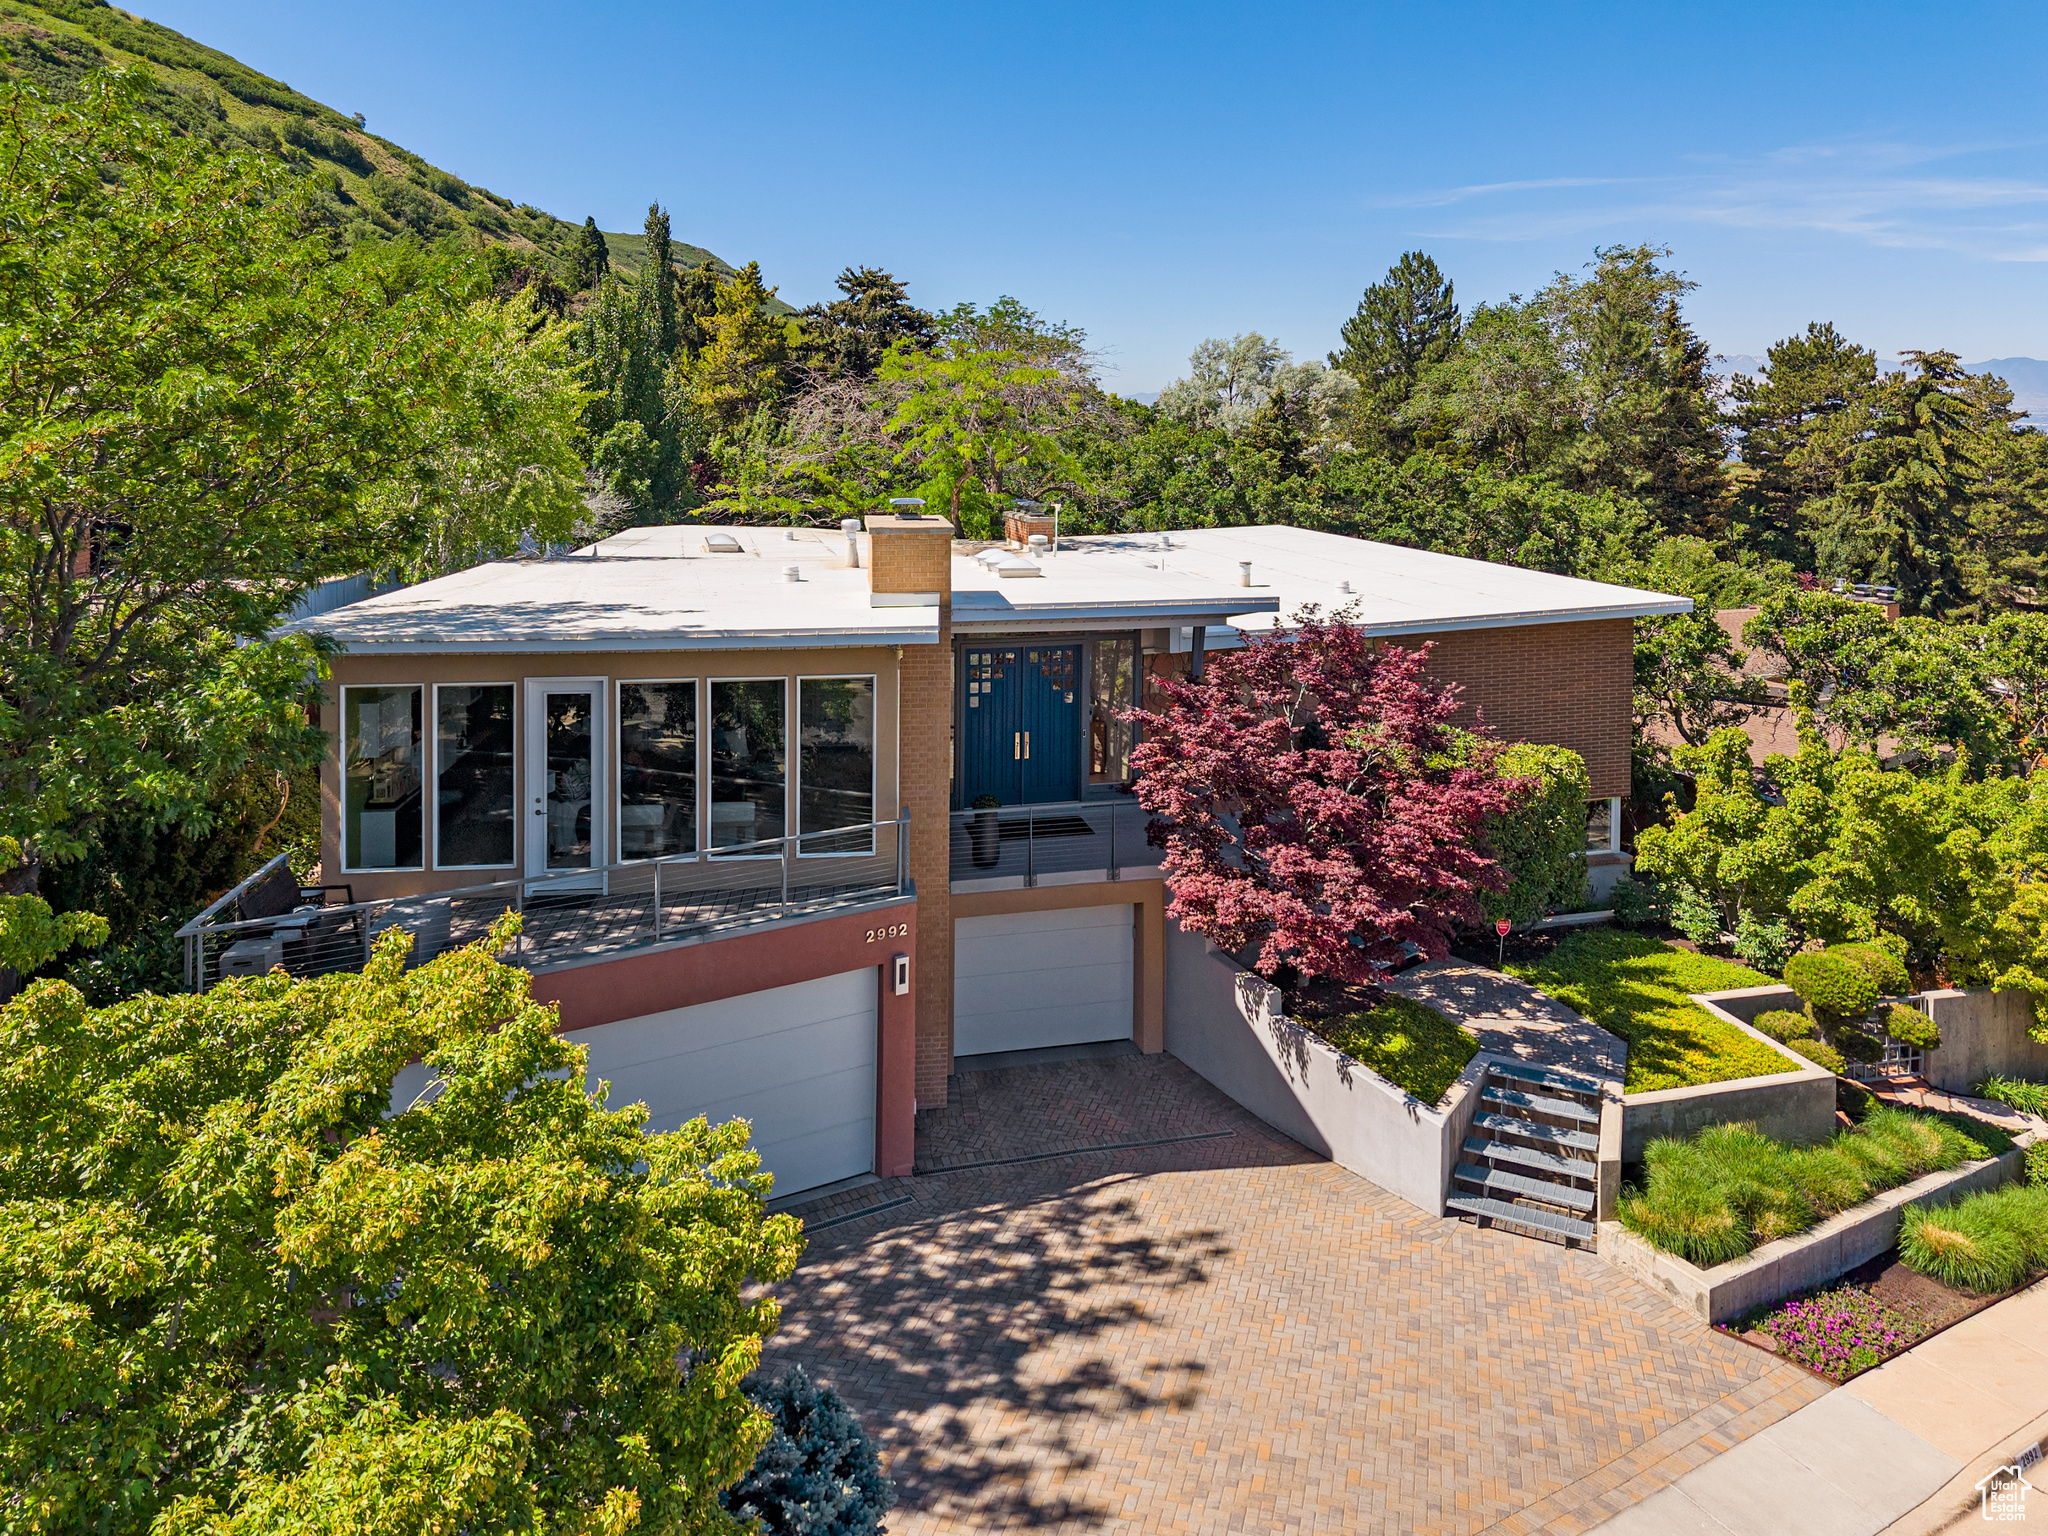
Active
$2,495,000
4
bds
|
5
ba
|
5,673
sqft
|
built
1956
2992 E Saint Marys Cir, Salt Lake City, UT 84108
$-8,285
Cash flow
-17.3%
Cash-on-Cash Return
2.3%
Cap rate
0.3%
Rent to Value Ratio
Active
$399,900
3
bds
|
2
ba
|
1,224
sqft
|
built
2001
1464 W Sunset Ave, Salt Lake City, UT 84119
$-852
Cash flow
-11.1%
Cash-on-Cash Return
3.7%
Cap rate
0.5%
Rent to Value Ratio
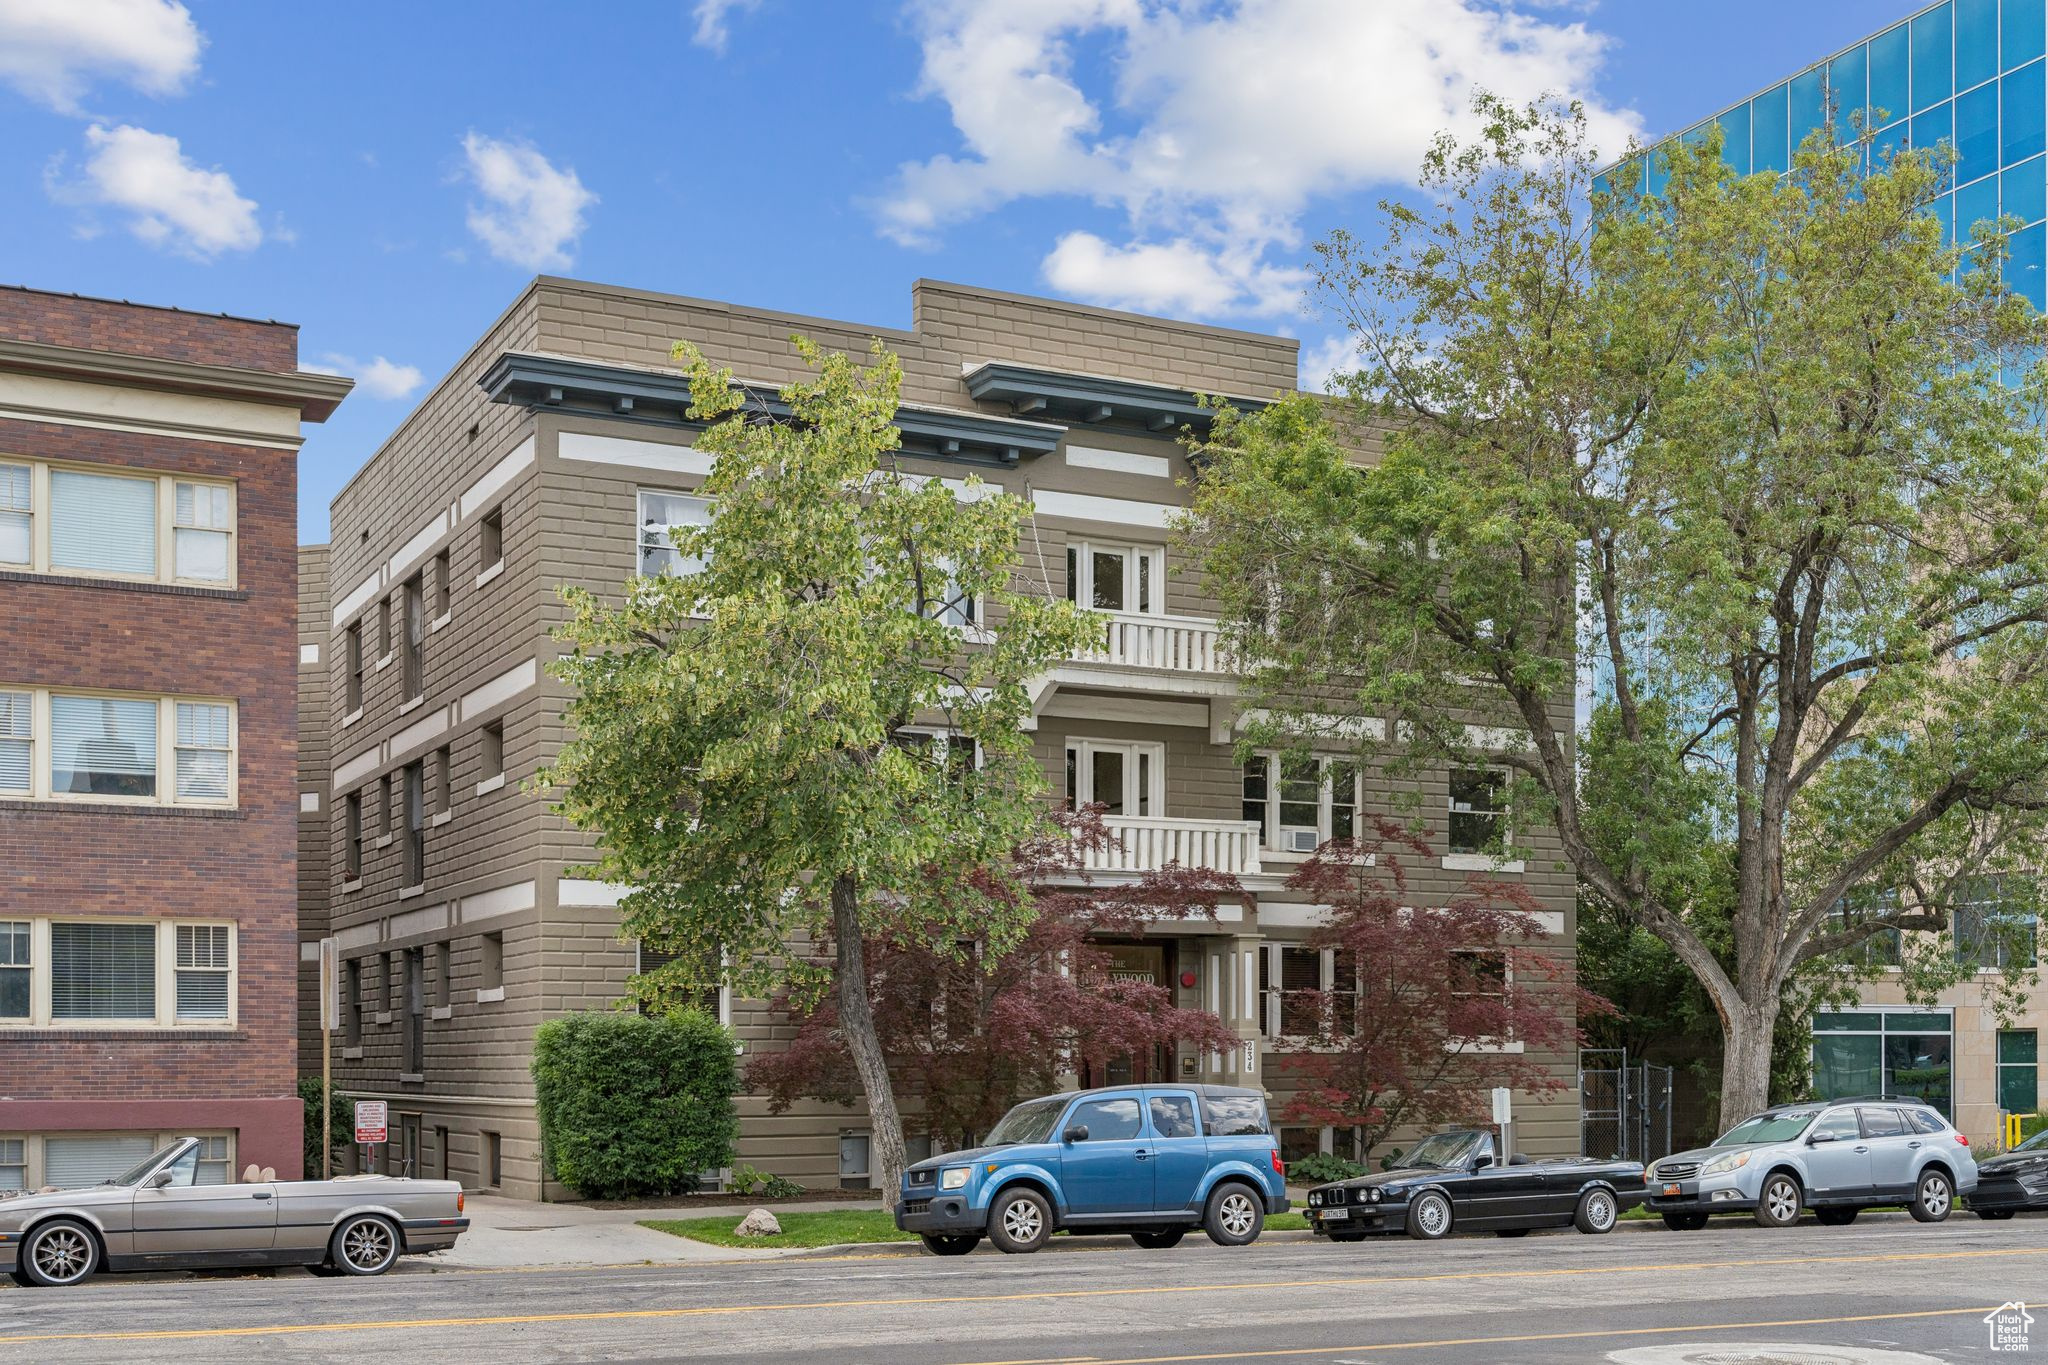
Active
$425,000
3
bds
|
2
ba
|
972
sqft
|
built
1909
234 E 100 S, Salt Lake City, UT 84111
$-1,348
Cash flow
-16.5%
Cash-on-Cash Return
2.5%
Cap rate
0.4%
Rent to Value Ratio
Active
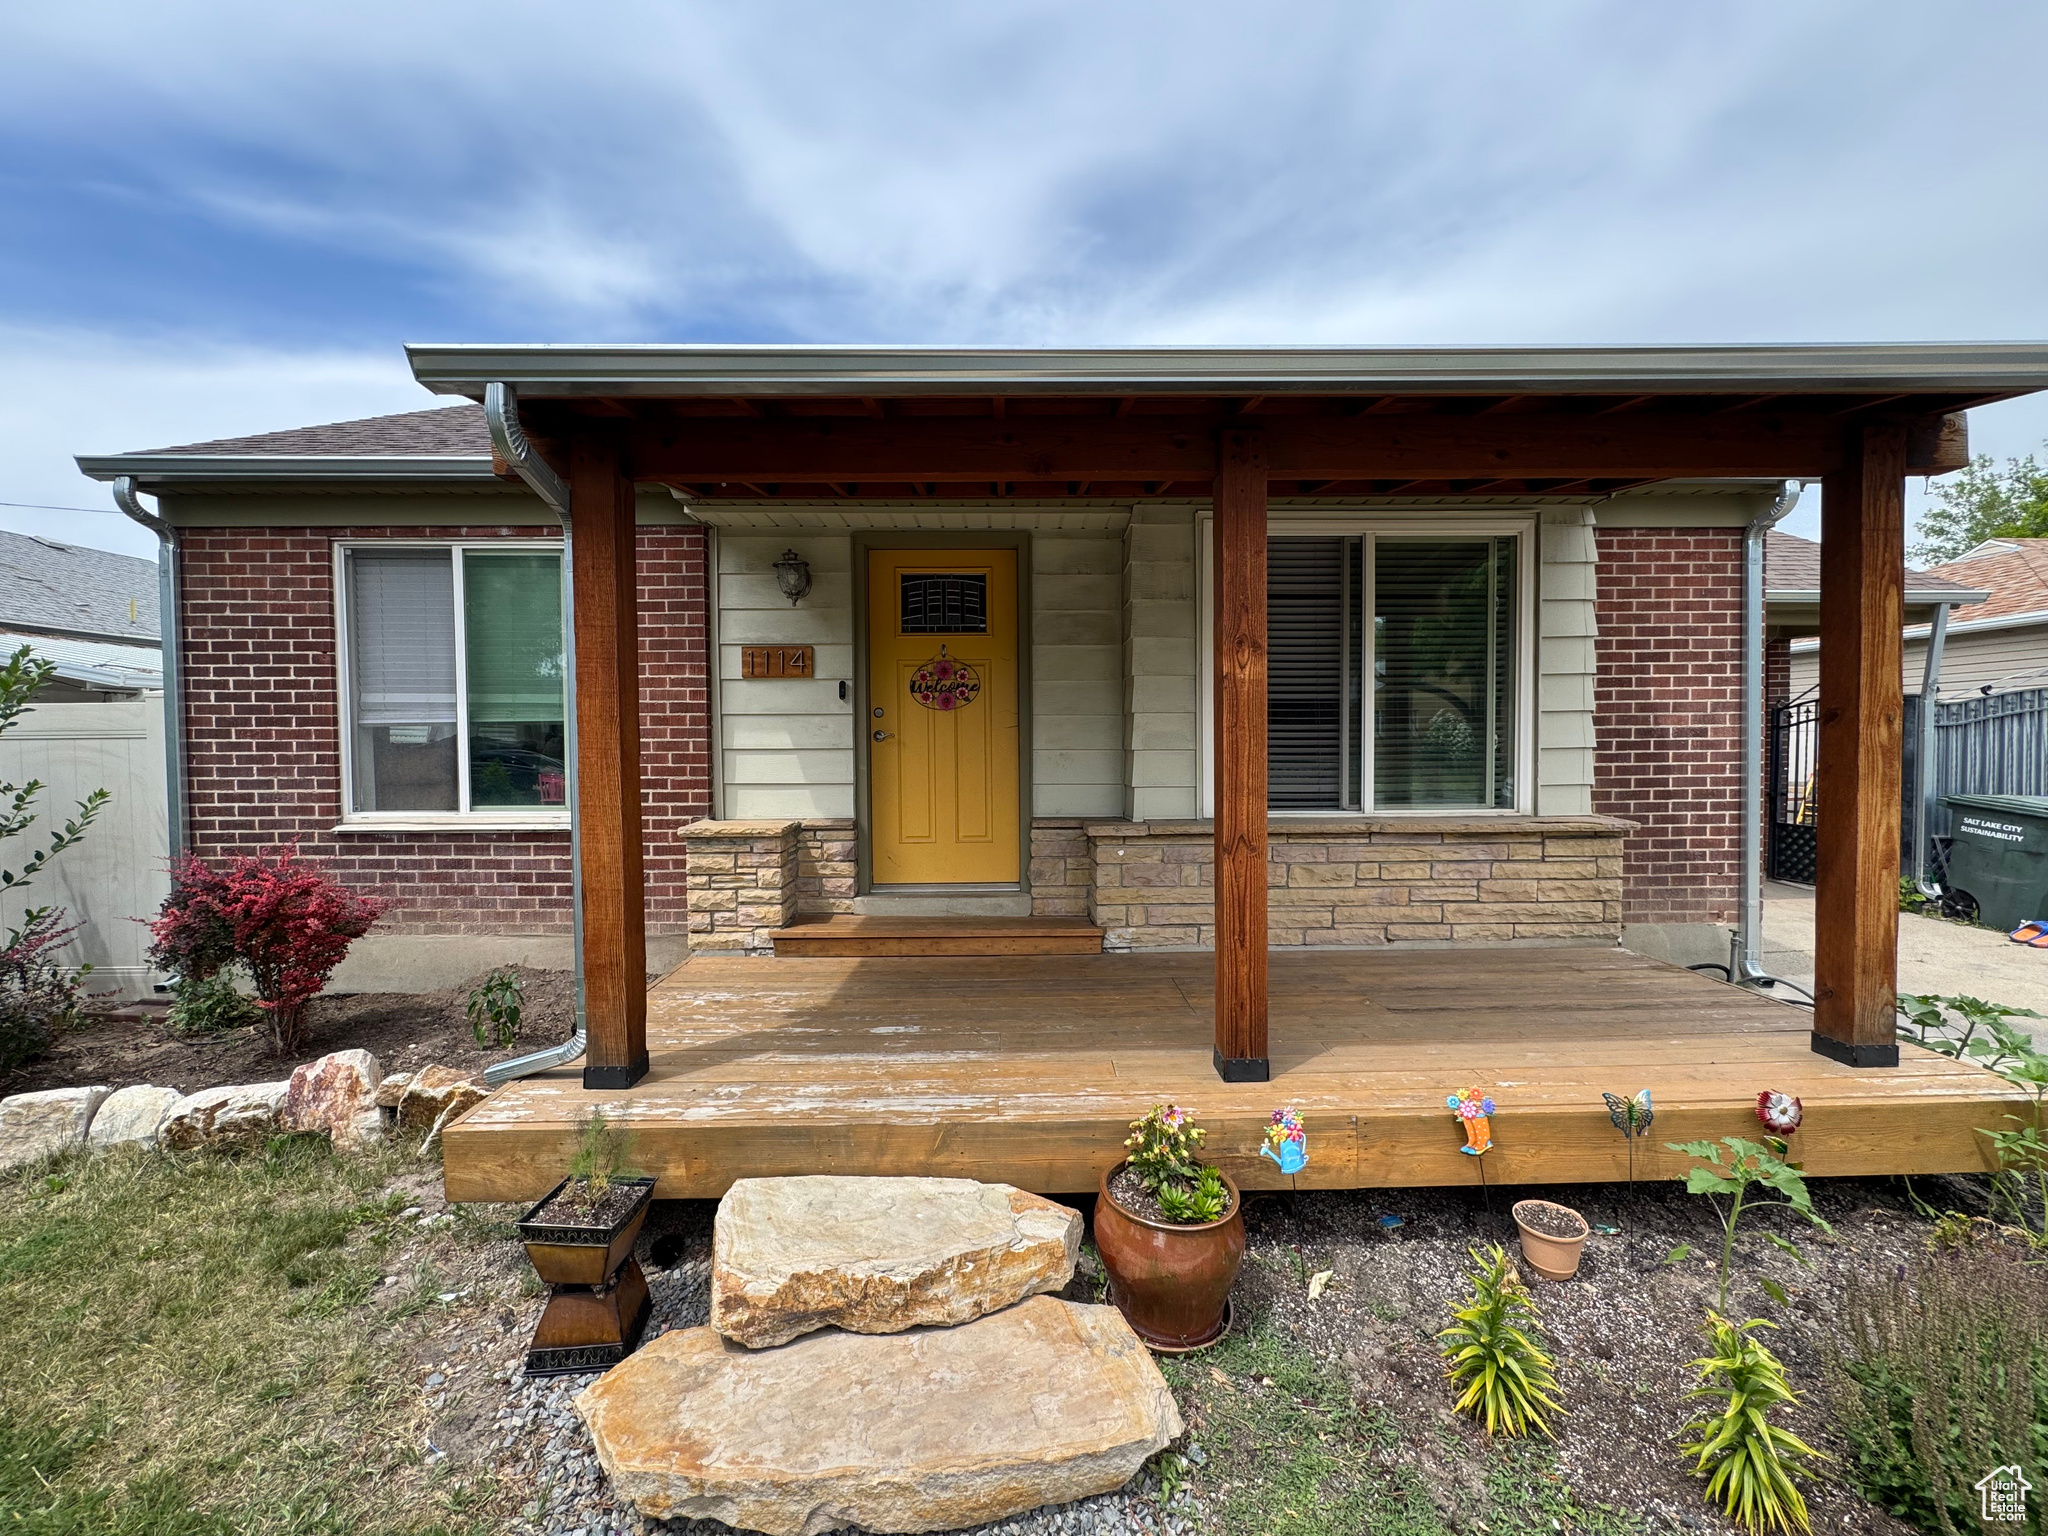
$495,000
4
bds
|
2
ba
|
1,511
sqft
|
built
1948
1114 W Briarcliff Ave, Salt Lake City, UT 84116
$-1,234
Cash flow
-13.0%
Cash-on-Cash Return
3.3%
Cap rate
0.5%
Rent to Value Ratio
Active
$488,000
3
bds
|
4
ba
|
2,258
sqft
|
built
2019
2717 W Redwick Ct, Salt Lake City, UT 84129
$-1,214
Cash flow
-13.0%
Cash-on-Cash Return
3.3%
Cap rate
0.5%
Rent to Value Ratio
Active
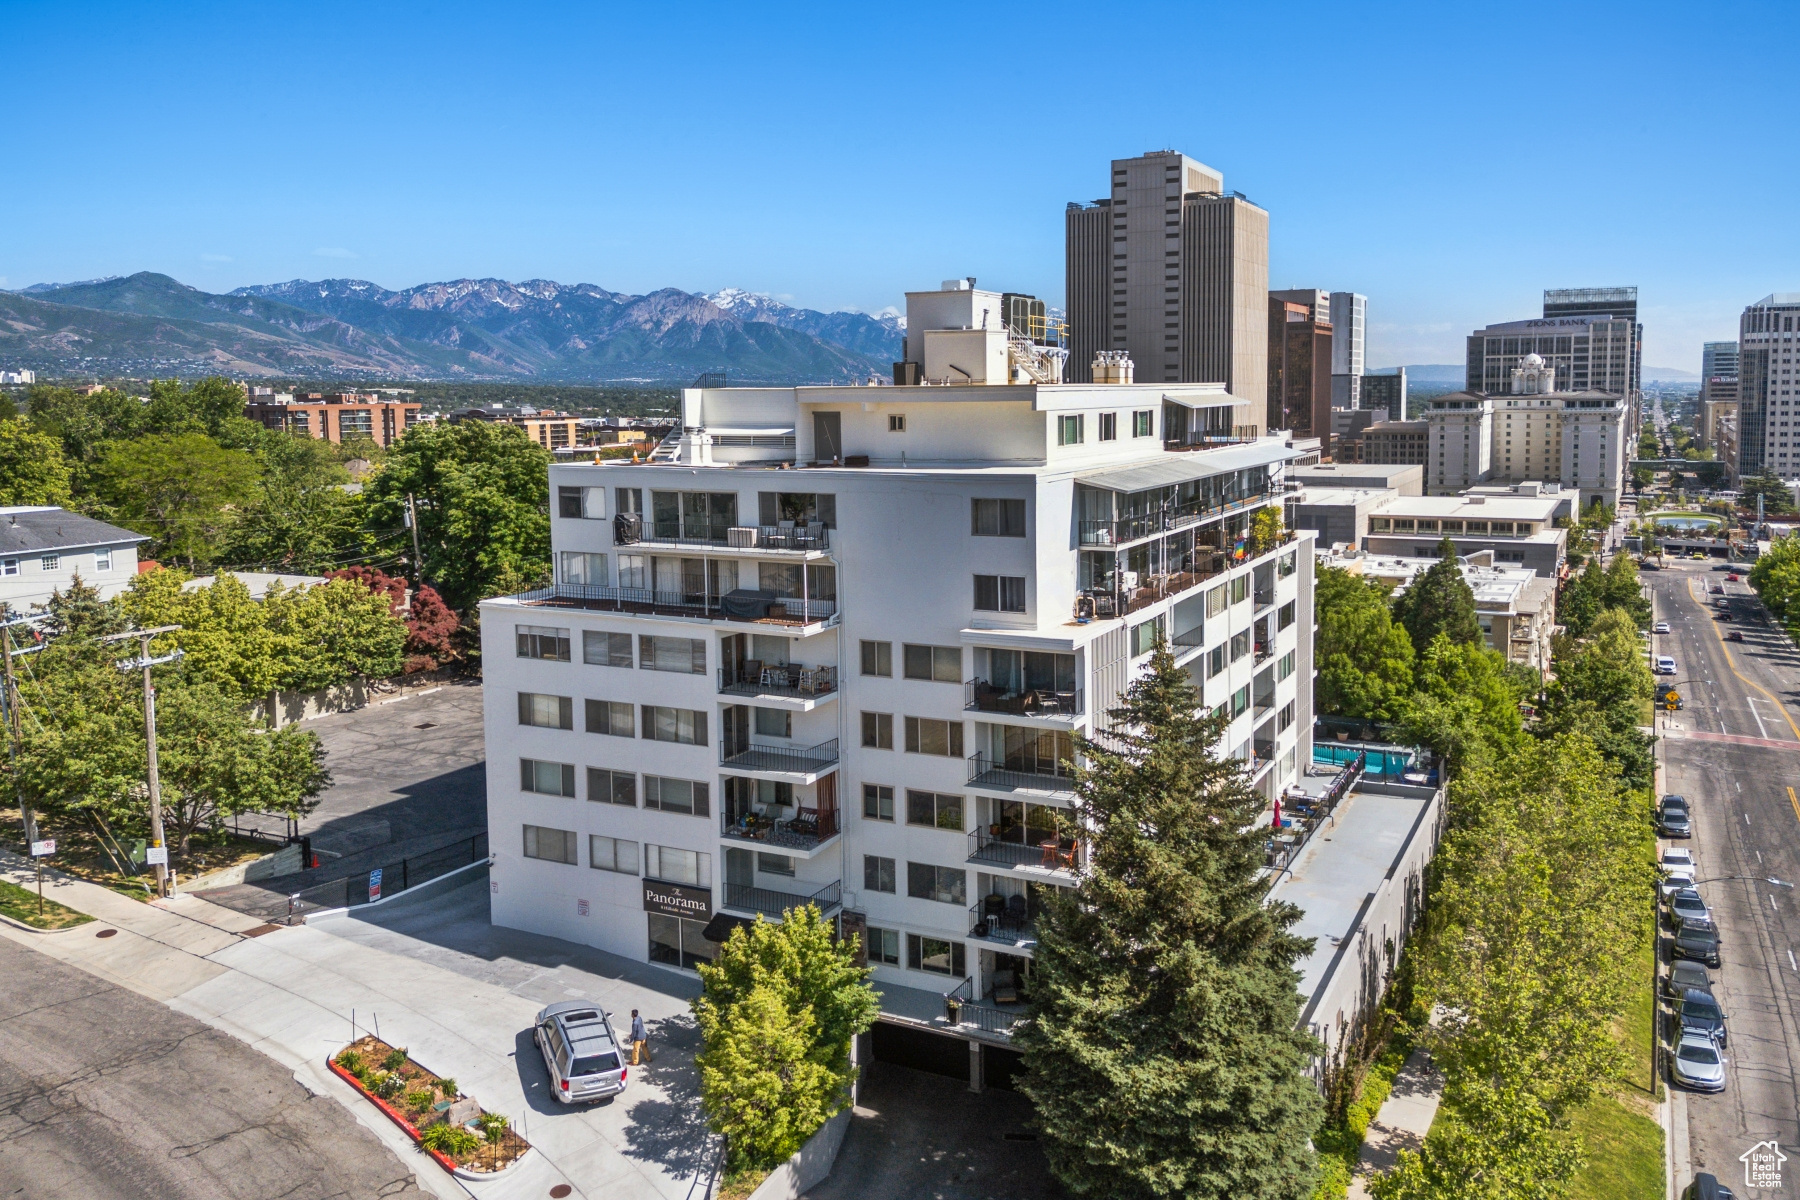
$343,000
1
bds
|
1
ba
|
755
sqft
|
built
1962
8 E Hillside Ave, Salt Lake City, UT 84103
$-996
Cash flow
-15.2%
Cash-on-Cash Return
2.8%
Cap rate
0.5%
Rent to Value Ratio
Active
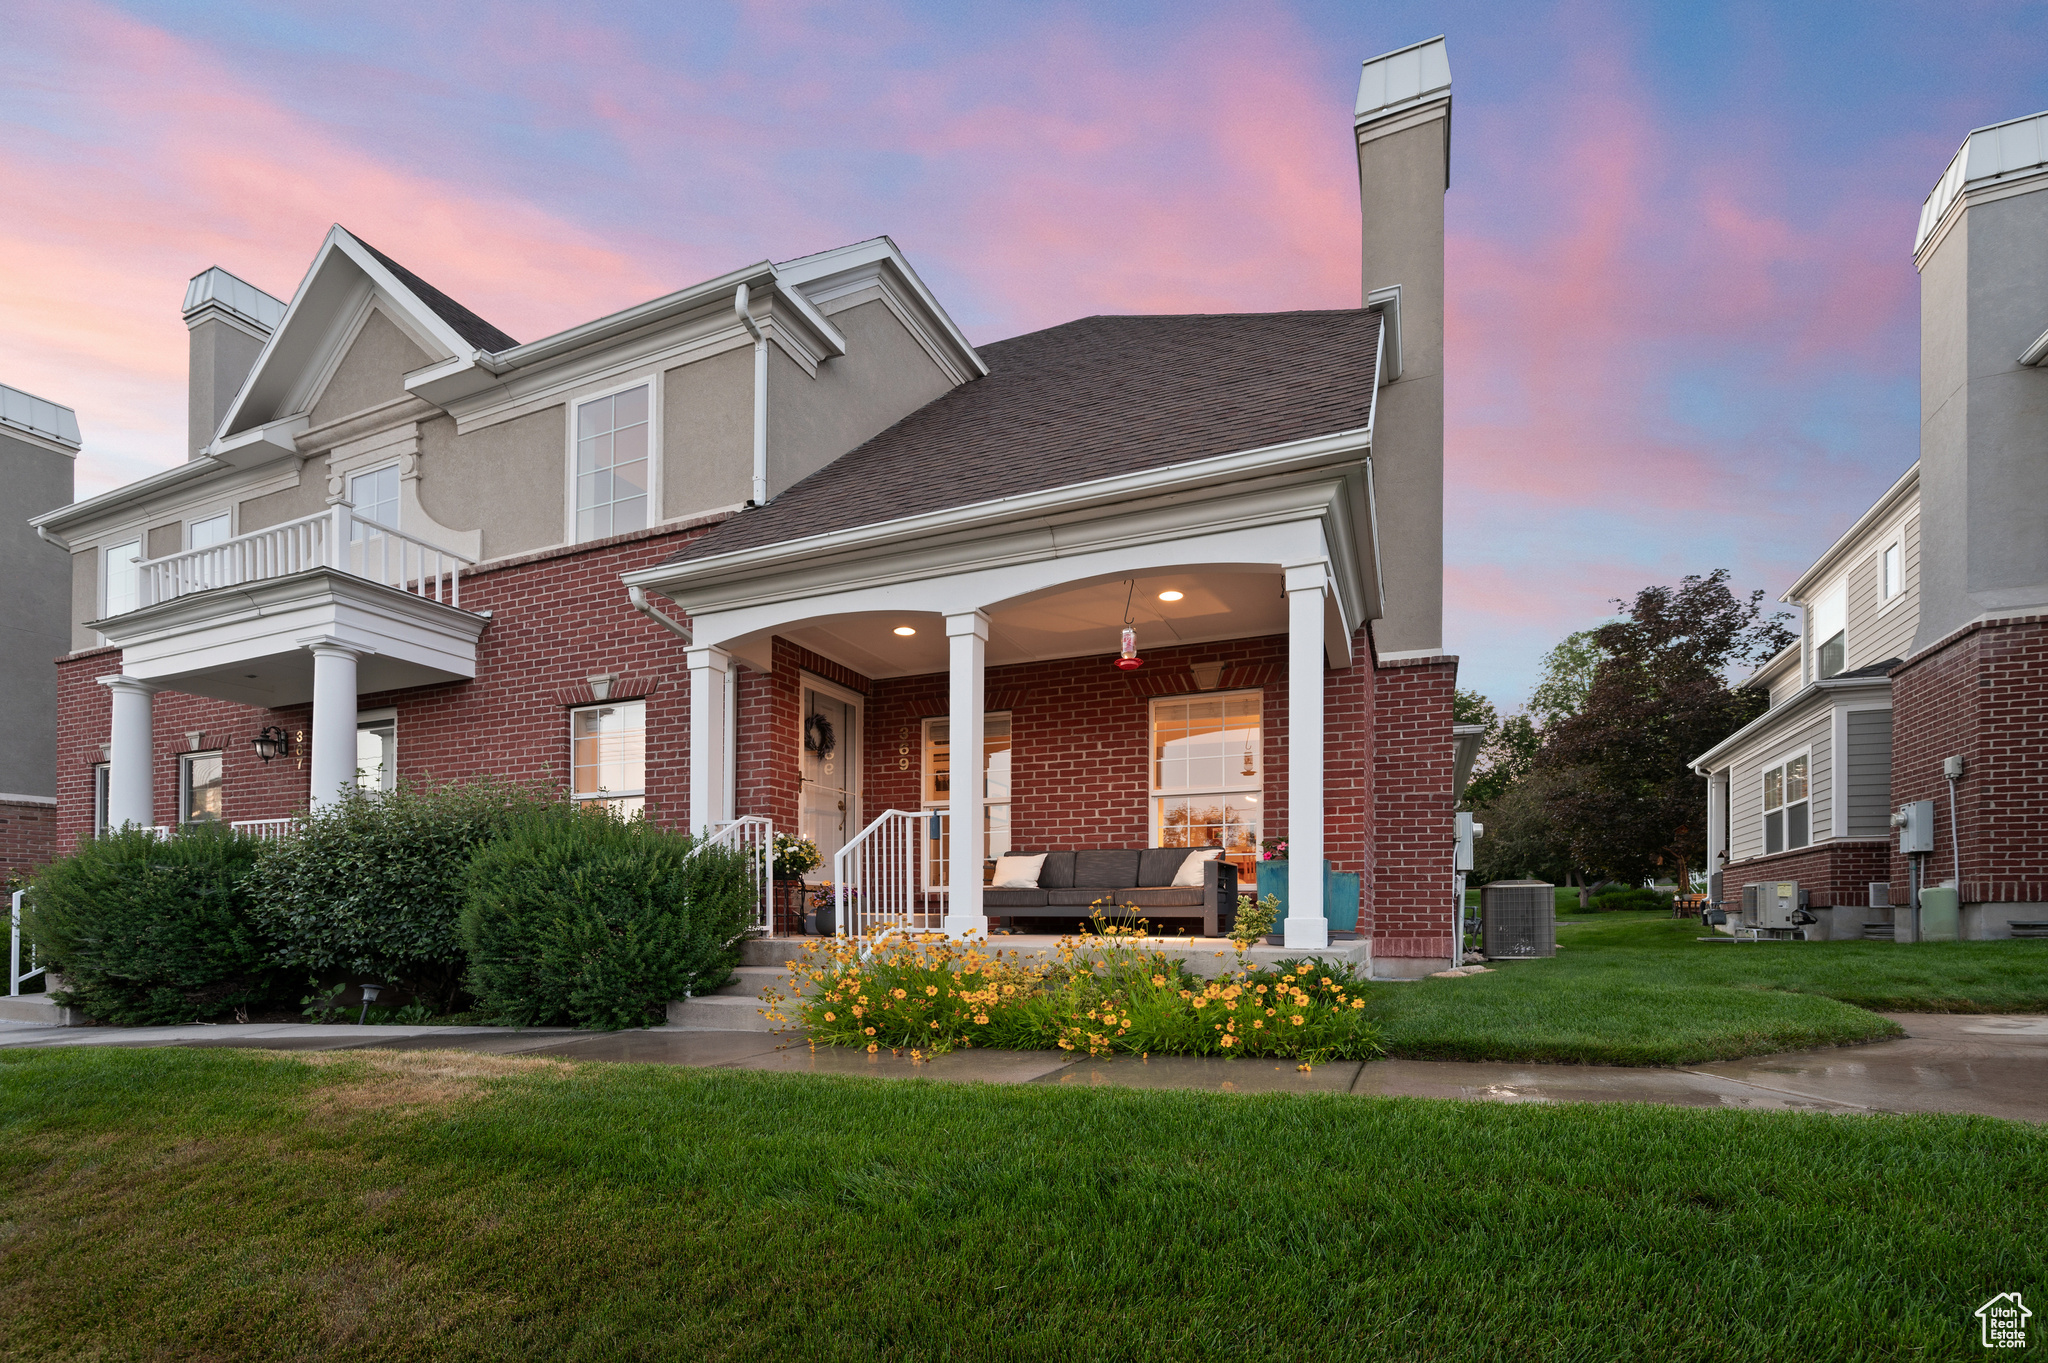
$950,000
3
bds
|
4
ba
|
2,378
sqft
|
built
1998
369 E 9th Ave, Salt Lake City, UT 84103
$-3,205
Cash flow
-17.6%
Cash-on-Cash Return
2.2%
Cap rate
0.4%
Rent to Value Ratio
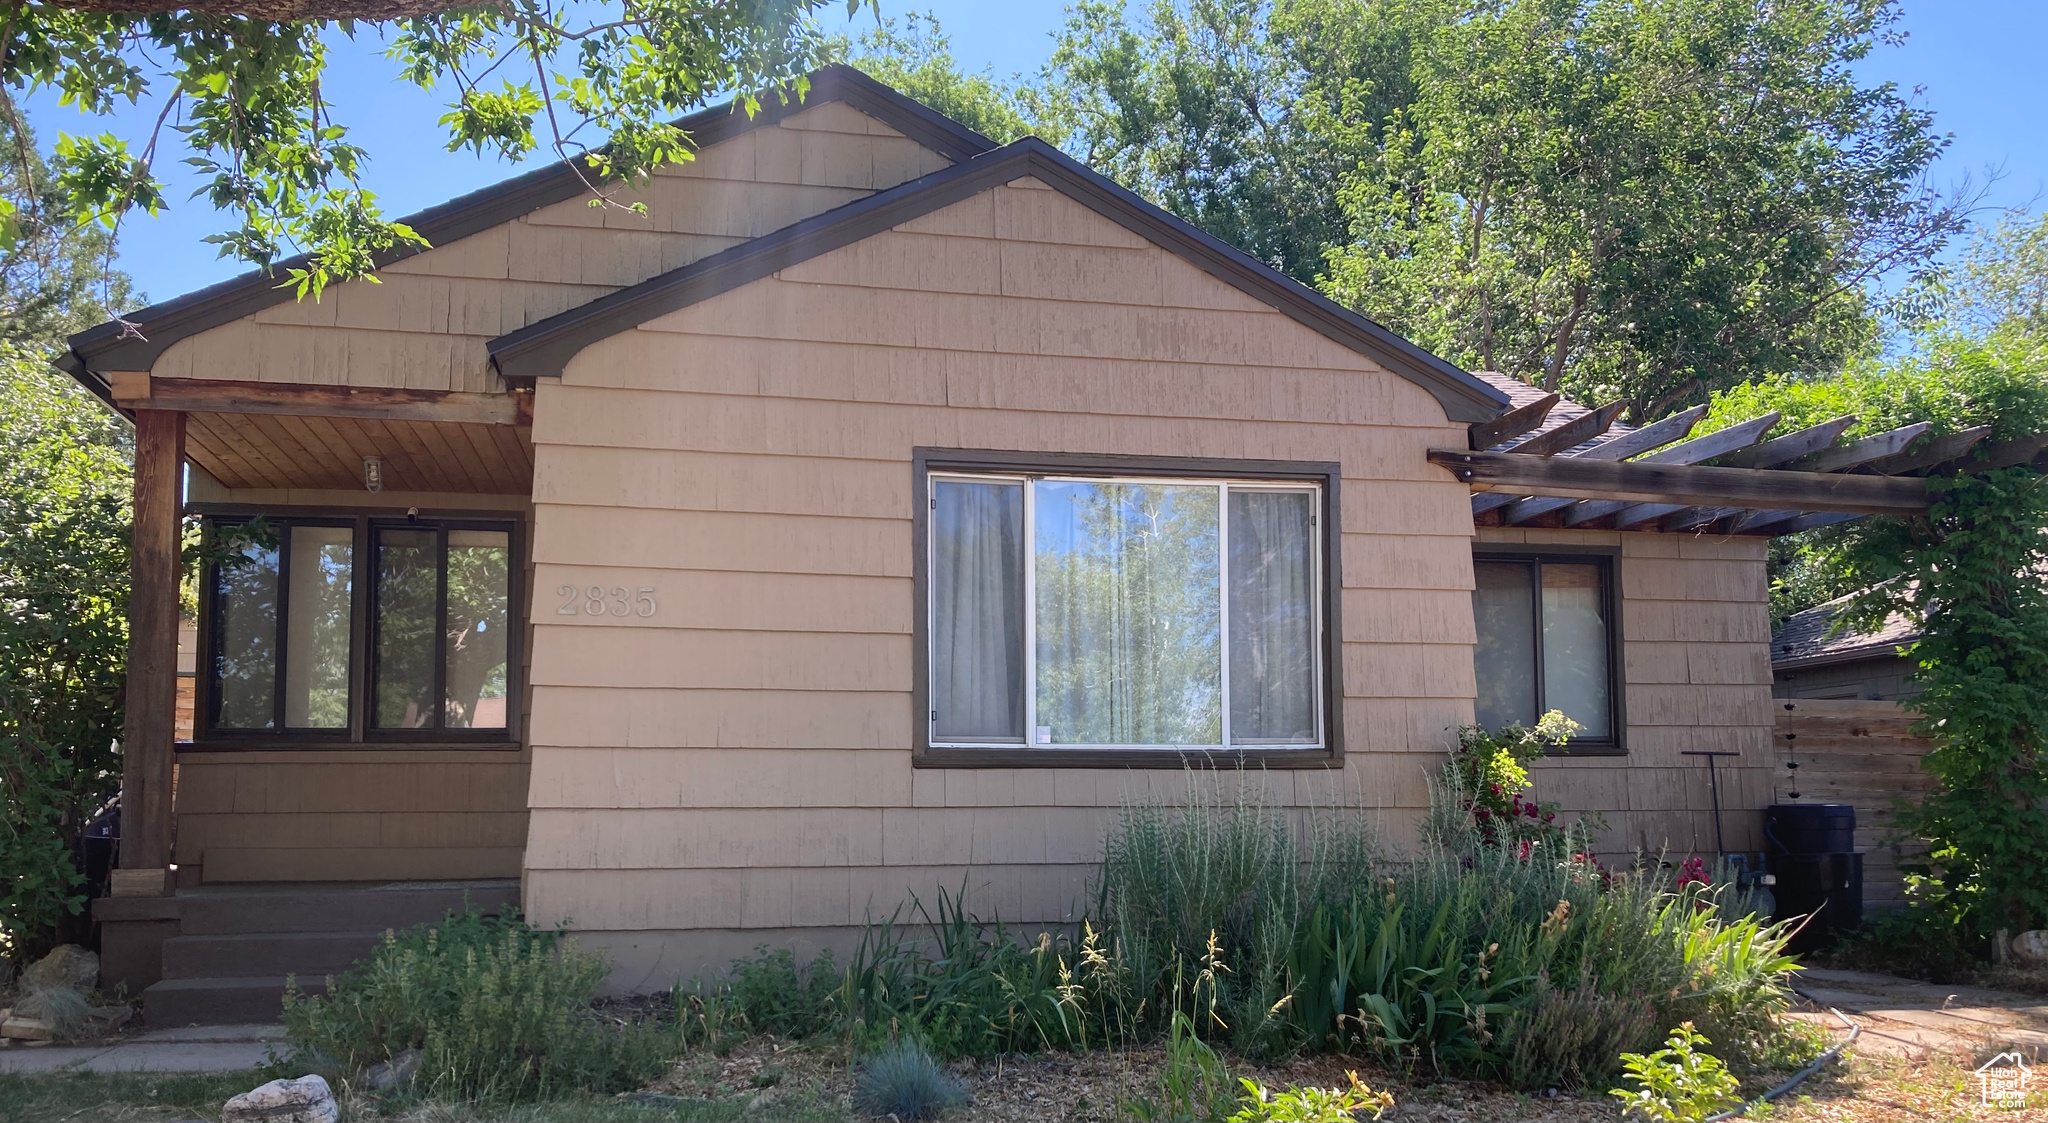
Active
$675,000
3
bds
|
2
ba
|
2,272
sqft
|
built
1948
2835 S 2475 E, Salt Lake City, UT 84109
$-1,800
Cash flow
-13.9%
Cash-on-Cash Return
3.1%
Cap rate
0.4%
Rent to Value Ratio
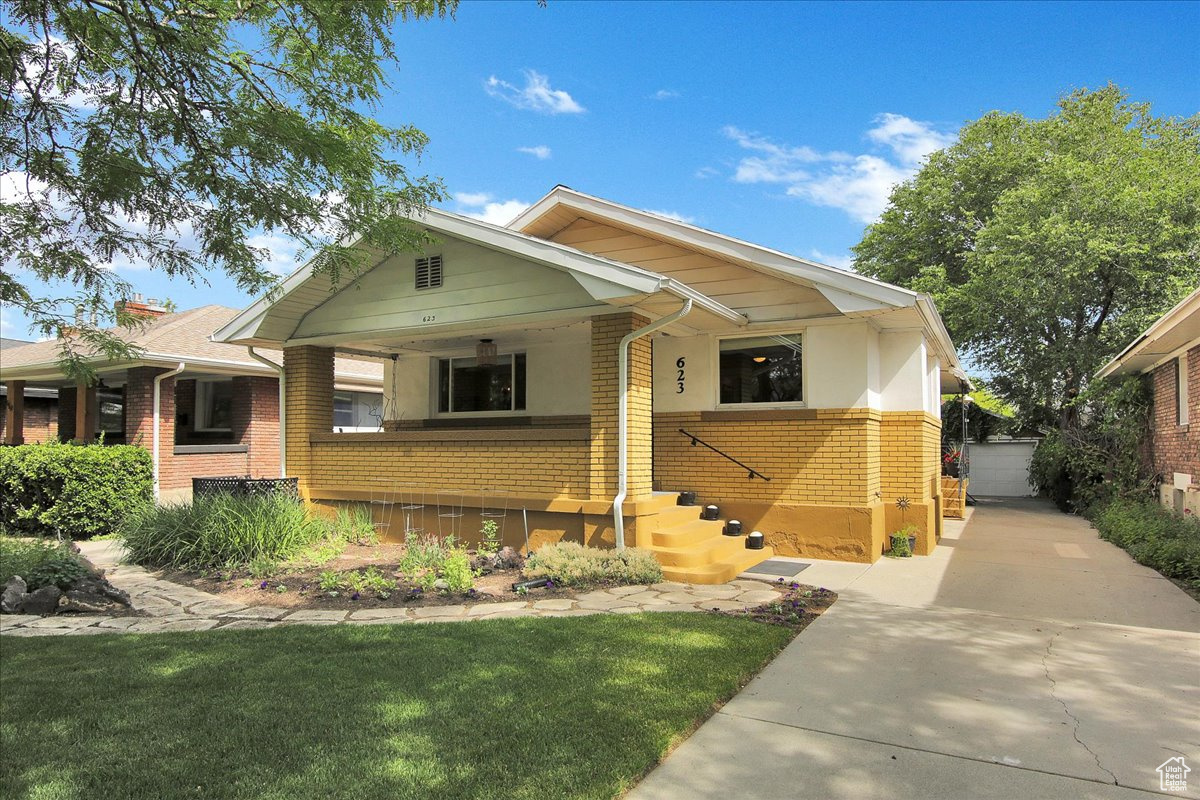
Active
$649,900
3
bds
|
2
ba
|
2,136
sqft
|
built
1919
623 E Milton Ave, Salt Lake City, UT 84105
$-2,007
Cash flow
-16.1%
Cash-on-Cash Return
2.6%
Cap rate
0.4%
Rent to Value Ratio
Active
$929,000
5
bds
|
4
ba
|
2,235
sqft
|
built
1955
1769 S Foothill Dr, Salt Lake City, UT 84108
$-3,321
Cash flow
-18.7%
Cash-on-Cash Return
2.0%
Cap rate
0.3%
Rent to Value Ratio
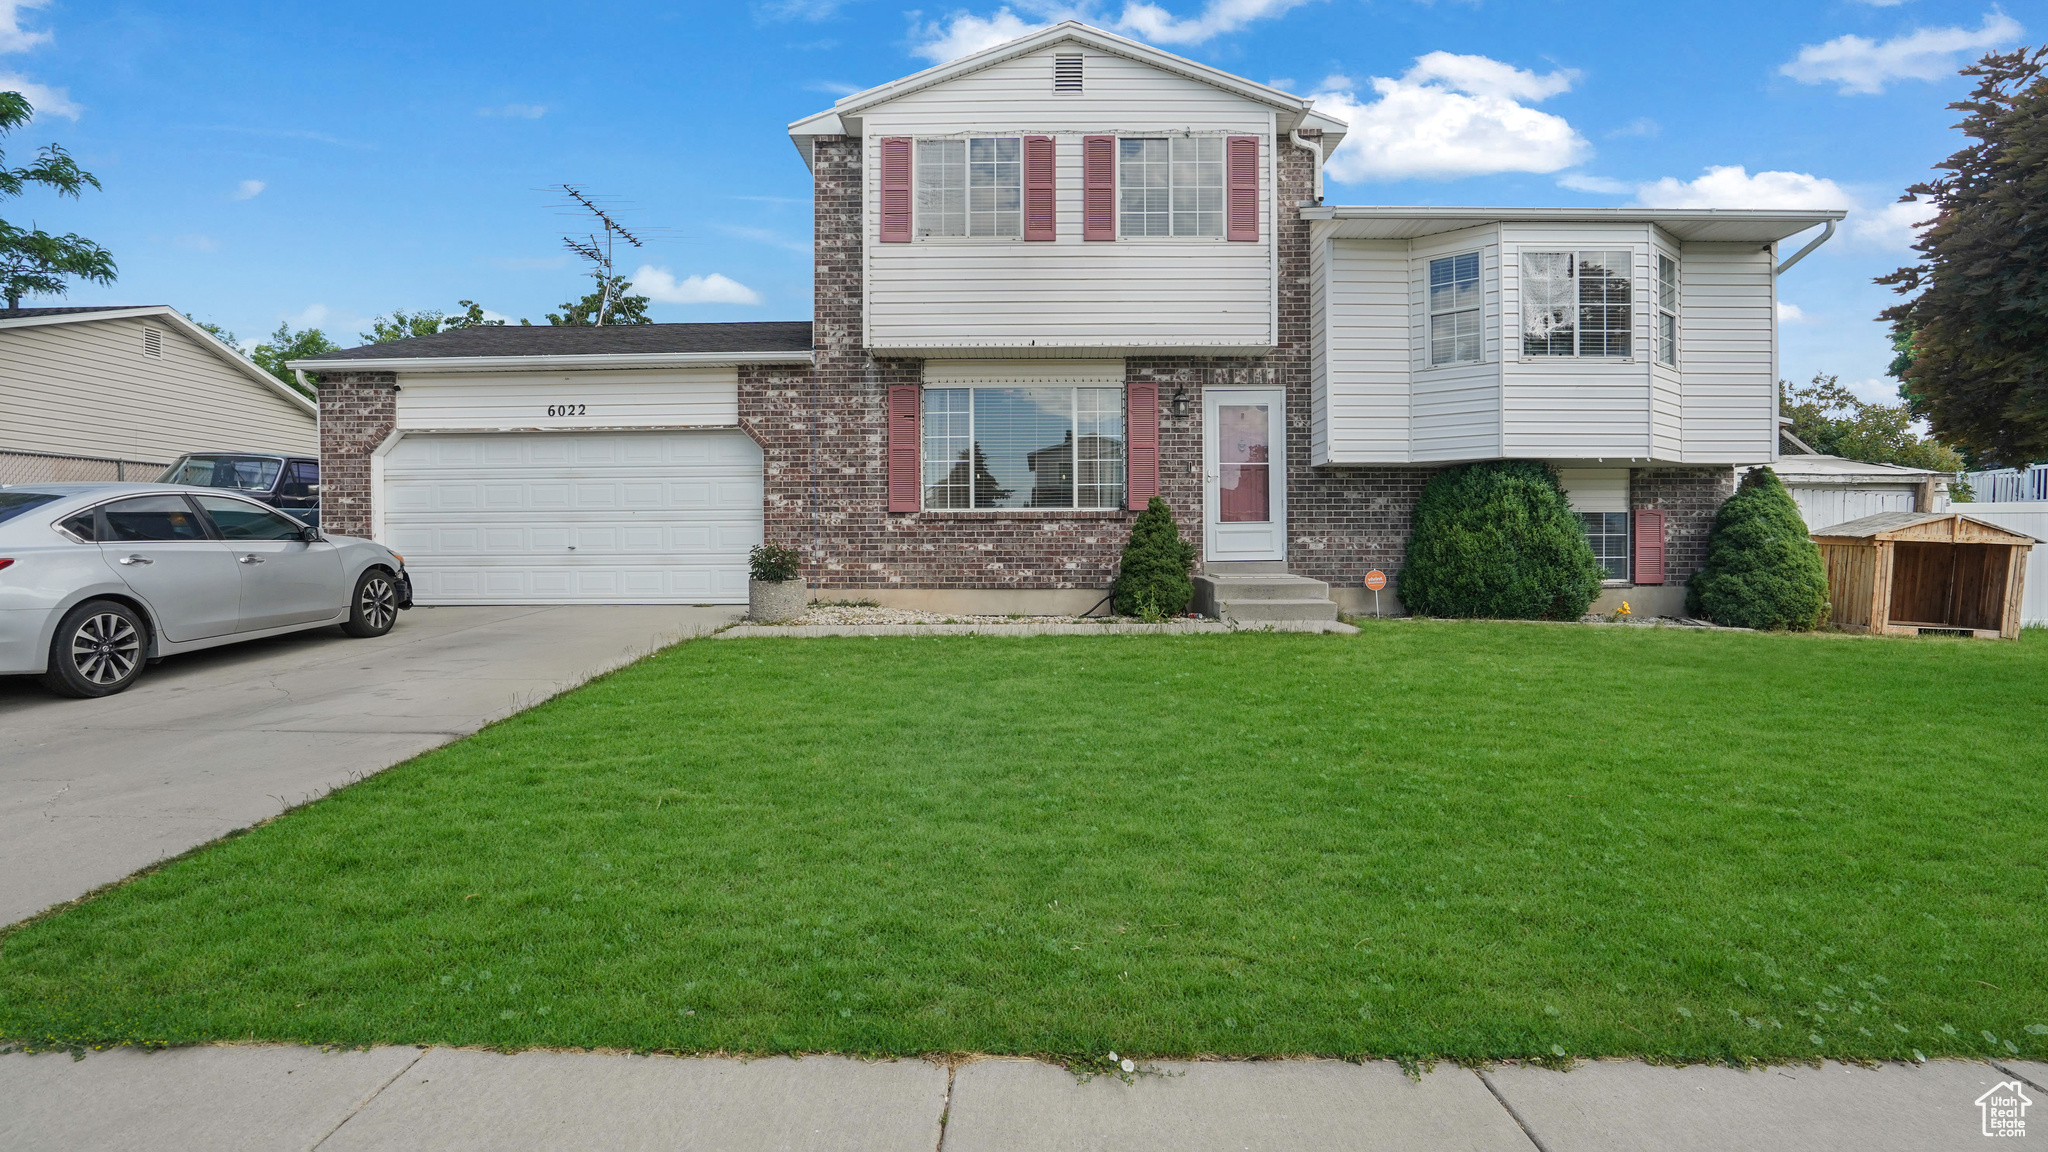
Active
$500,000
5
bds
|
3
ba
|
2,386
sqft
|
built
1993
6022 W Eaton Way, Salt Lake City, UT 84118
$-1,194
Cash flow
-12.5%
Cash-on-Cash Return
3.4%
Cap rate
0.5%
Rent to Value Ratio

Pending
$565,999
6
bds
|
3
ba
|
2,810
sqft
|
built
1995
4564 S Early Duke St, Salt Lake City, UT 84120
$-1,732
Cash flow
-16.0%
Cash-on-Cash Return
2.6%
Cap rate
0.4%
Rent to Value Ratio
Active
$450,000
2
bds
|
1
ba
|
953
sqft
|
built
1907
833 E Markea Ave, Salt Lake City, UT 84102
$-1,244
Cash flow
-14.4%
Cash-on-Cash Return
3.0%
Cap rate
0.4%
Rent to Value Ratio
Active
$1,100,000
5
bds
|
3
ba
|
2,788
sqft
|
built
1953
3704 S 2140 E, Salt Lake City, UT 84109
$-4,410
Cash flow
-20.9%
Cash-on-Cash Return
1.5%
Cap rate
0.2%
Rent to Value Ratio
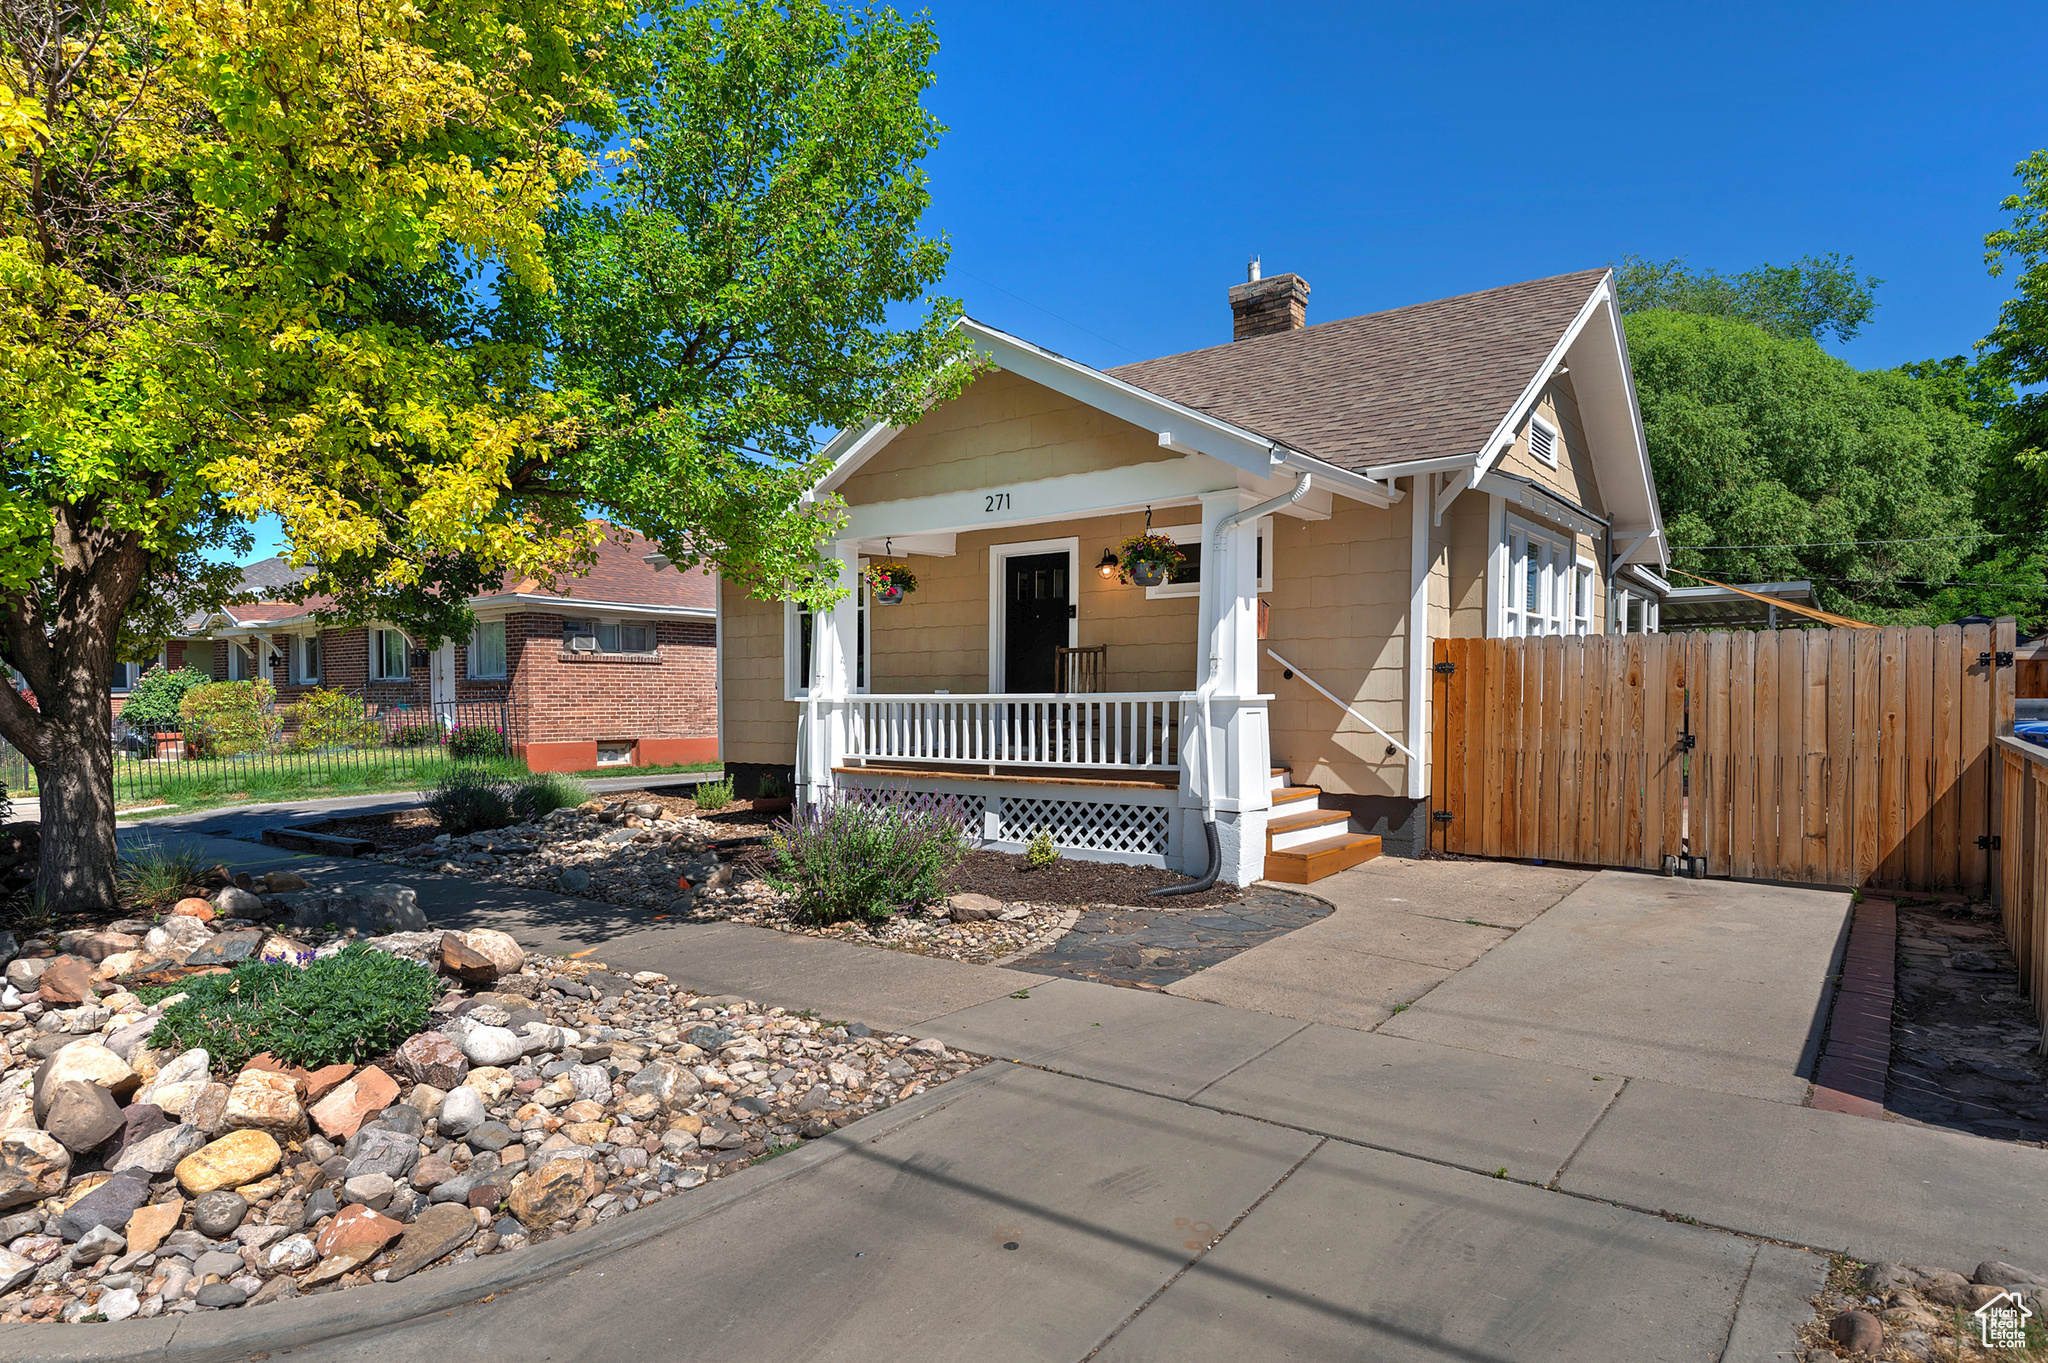
Active
$575,000
2
bds
|
2
ba
|
1,381
sqft
|
built
1929
271 E Kensington Ave, Salt Lake City, UT 84115
$-1,490
Cash flow
-13.5%
Cash-on-Cash Return
3.2%
Cap rate
0.4%
Rent to Value Ratio