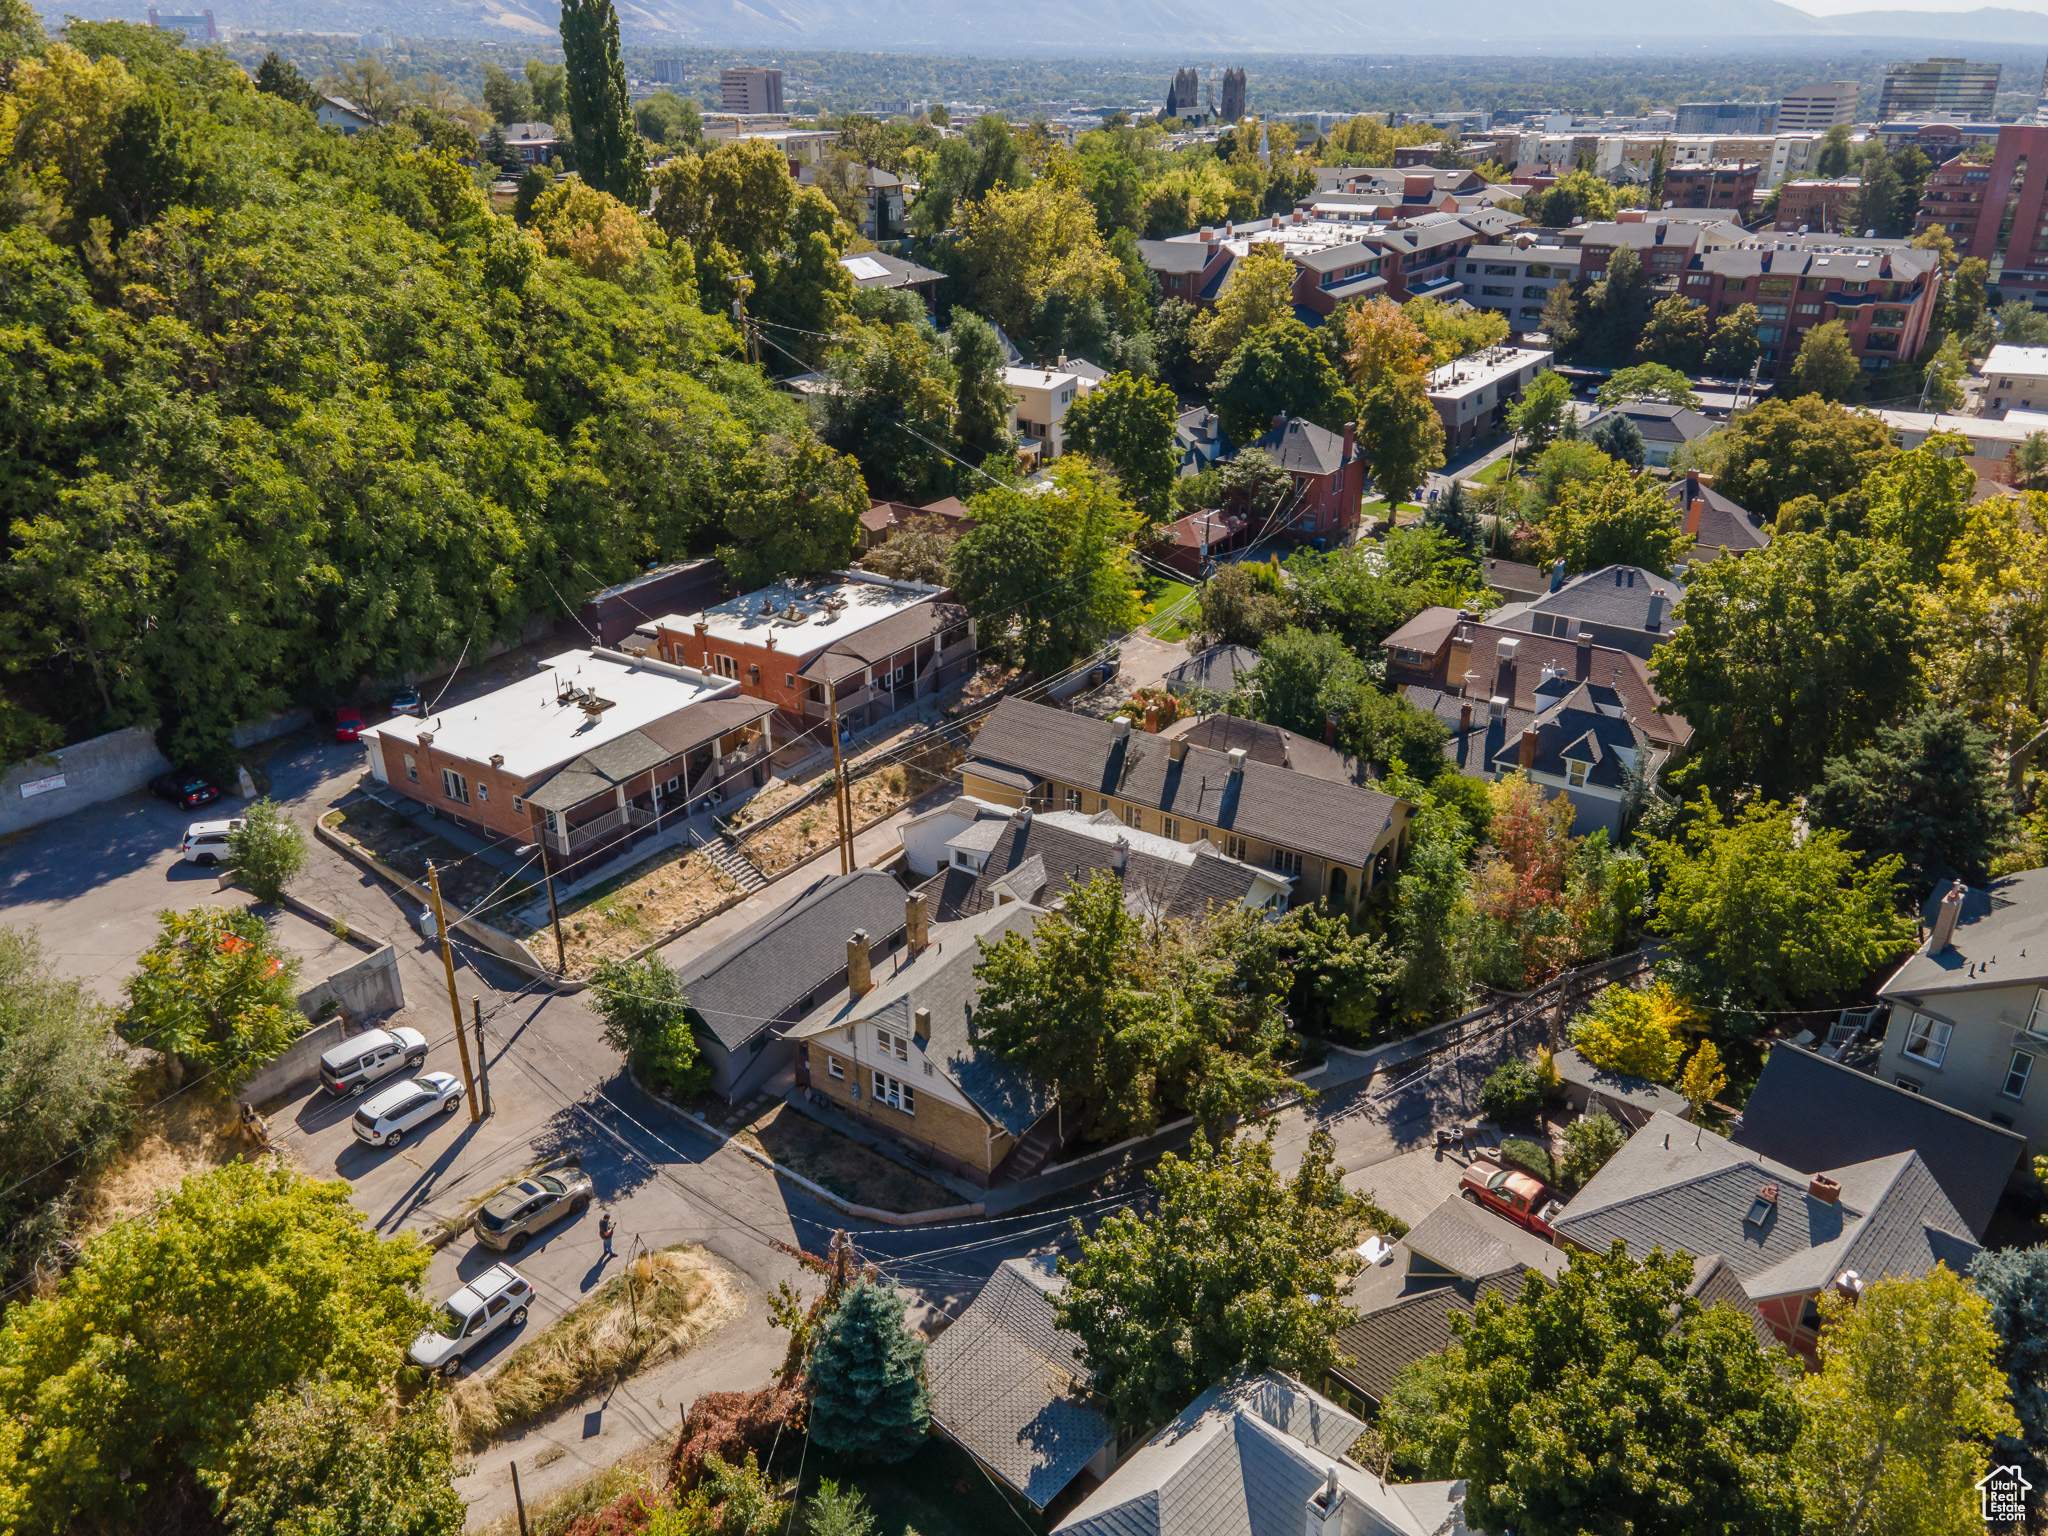
Salt Lake City, UT Investment Properties for Sale
Browse homes for sale and investment properties in Salt Lake City, UT. Refine your search by price, property type, or more.
Best cash flowing properties in Salt Lake City, UT
Active under contract
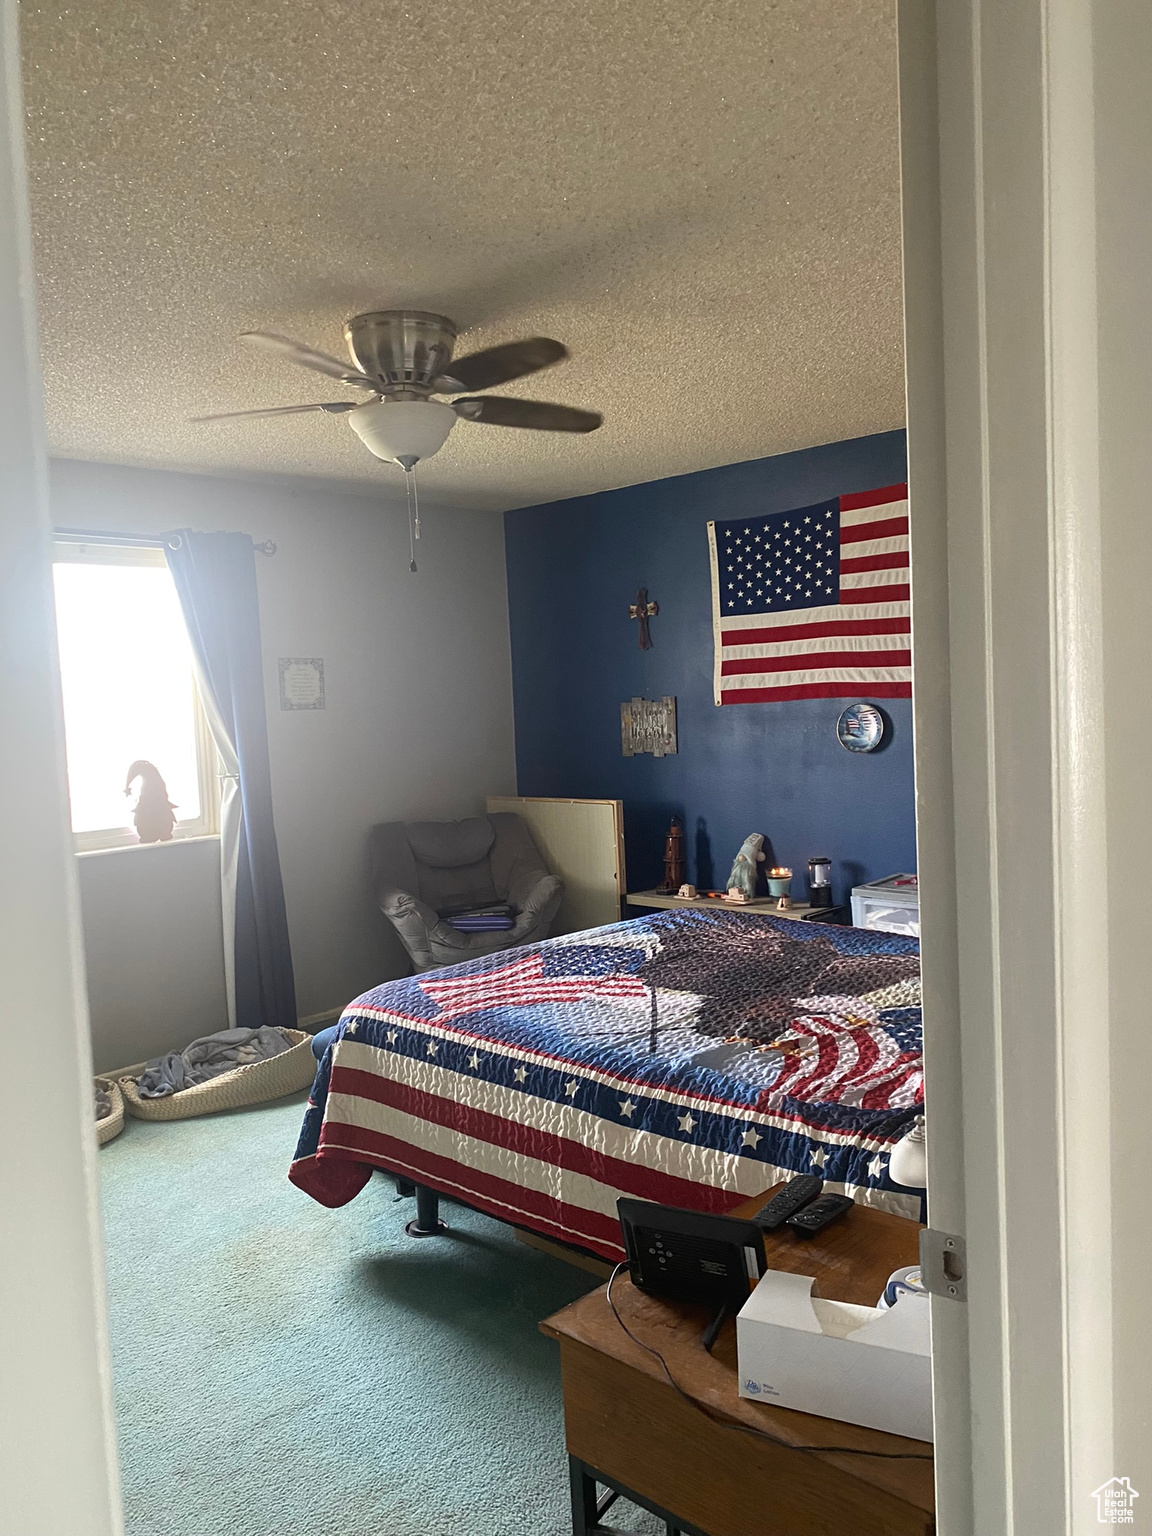
$354,900
3
bds
|
1
ba
|
962
sqft
|
built
1958
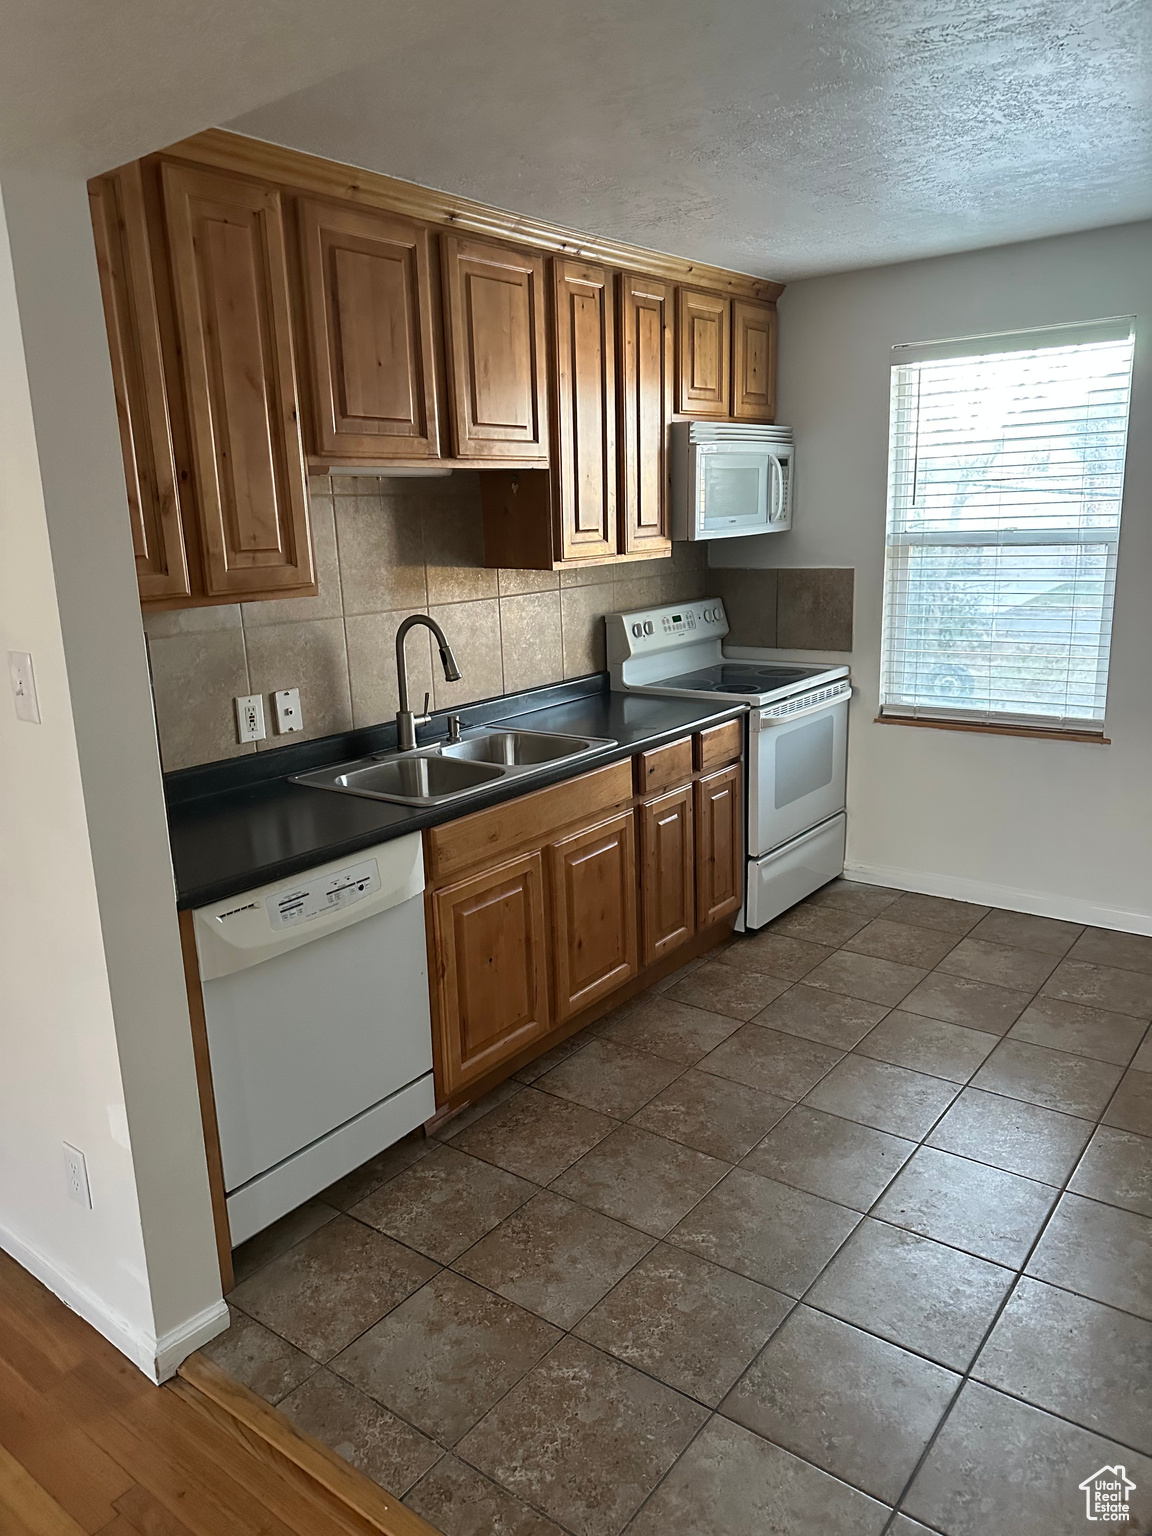
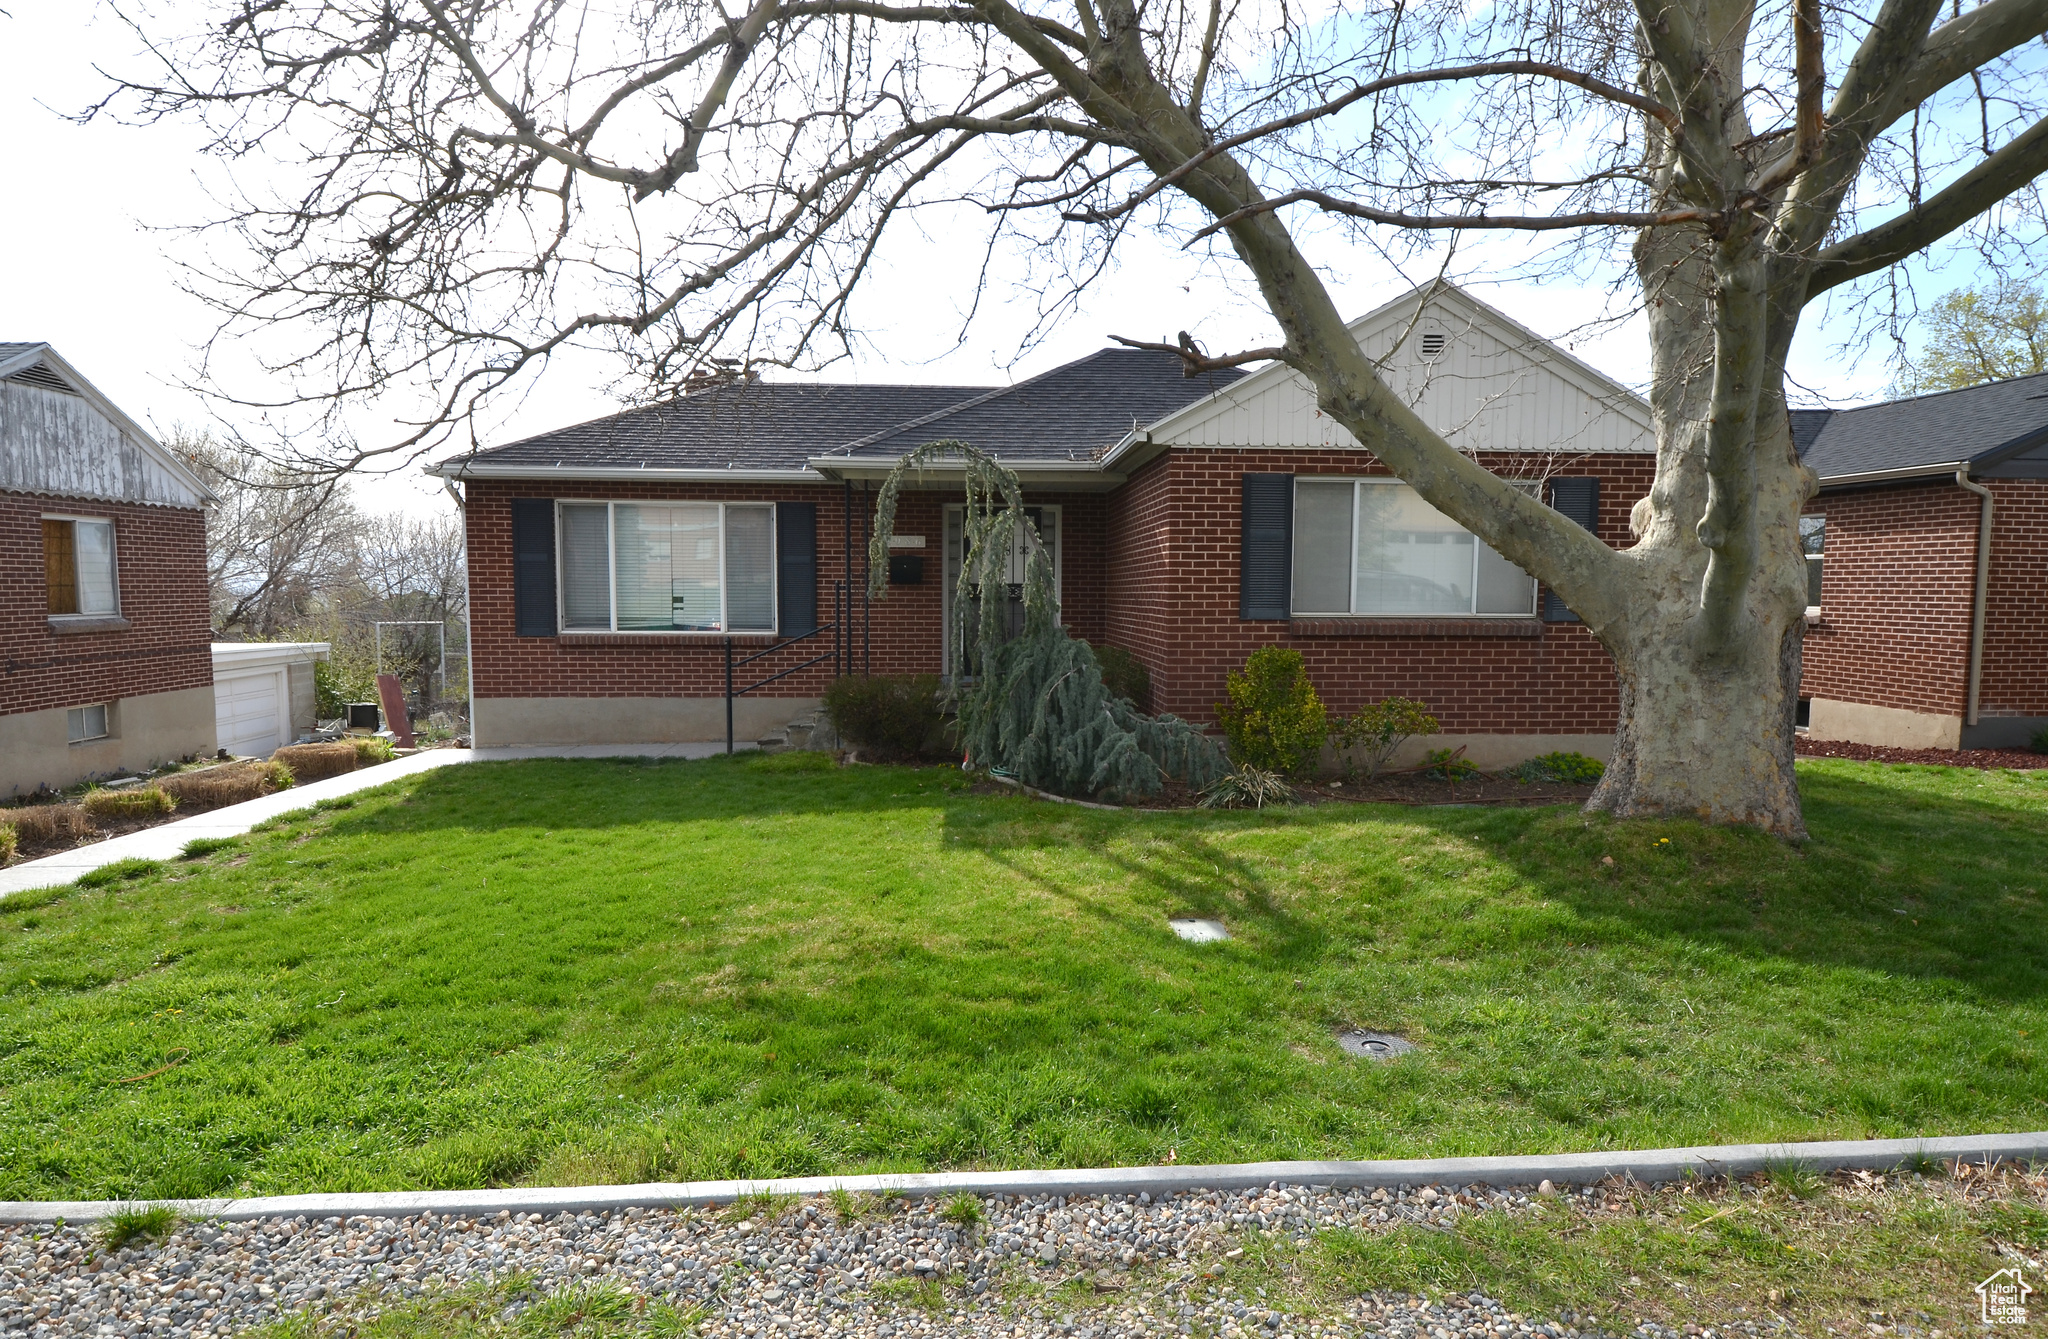
4165 W 4715 S, Salt Lake City, UT 84118
$-654
Cash flow
-9.6%
Cash-on-Cash Return
4.1%
Cap rate
0.6%
Rent to Value Ratio
Active
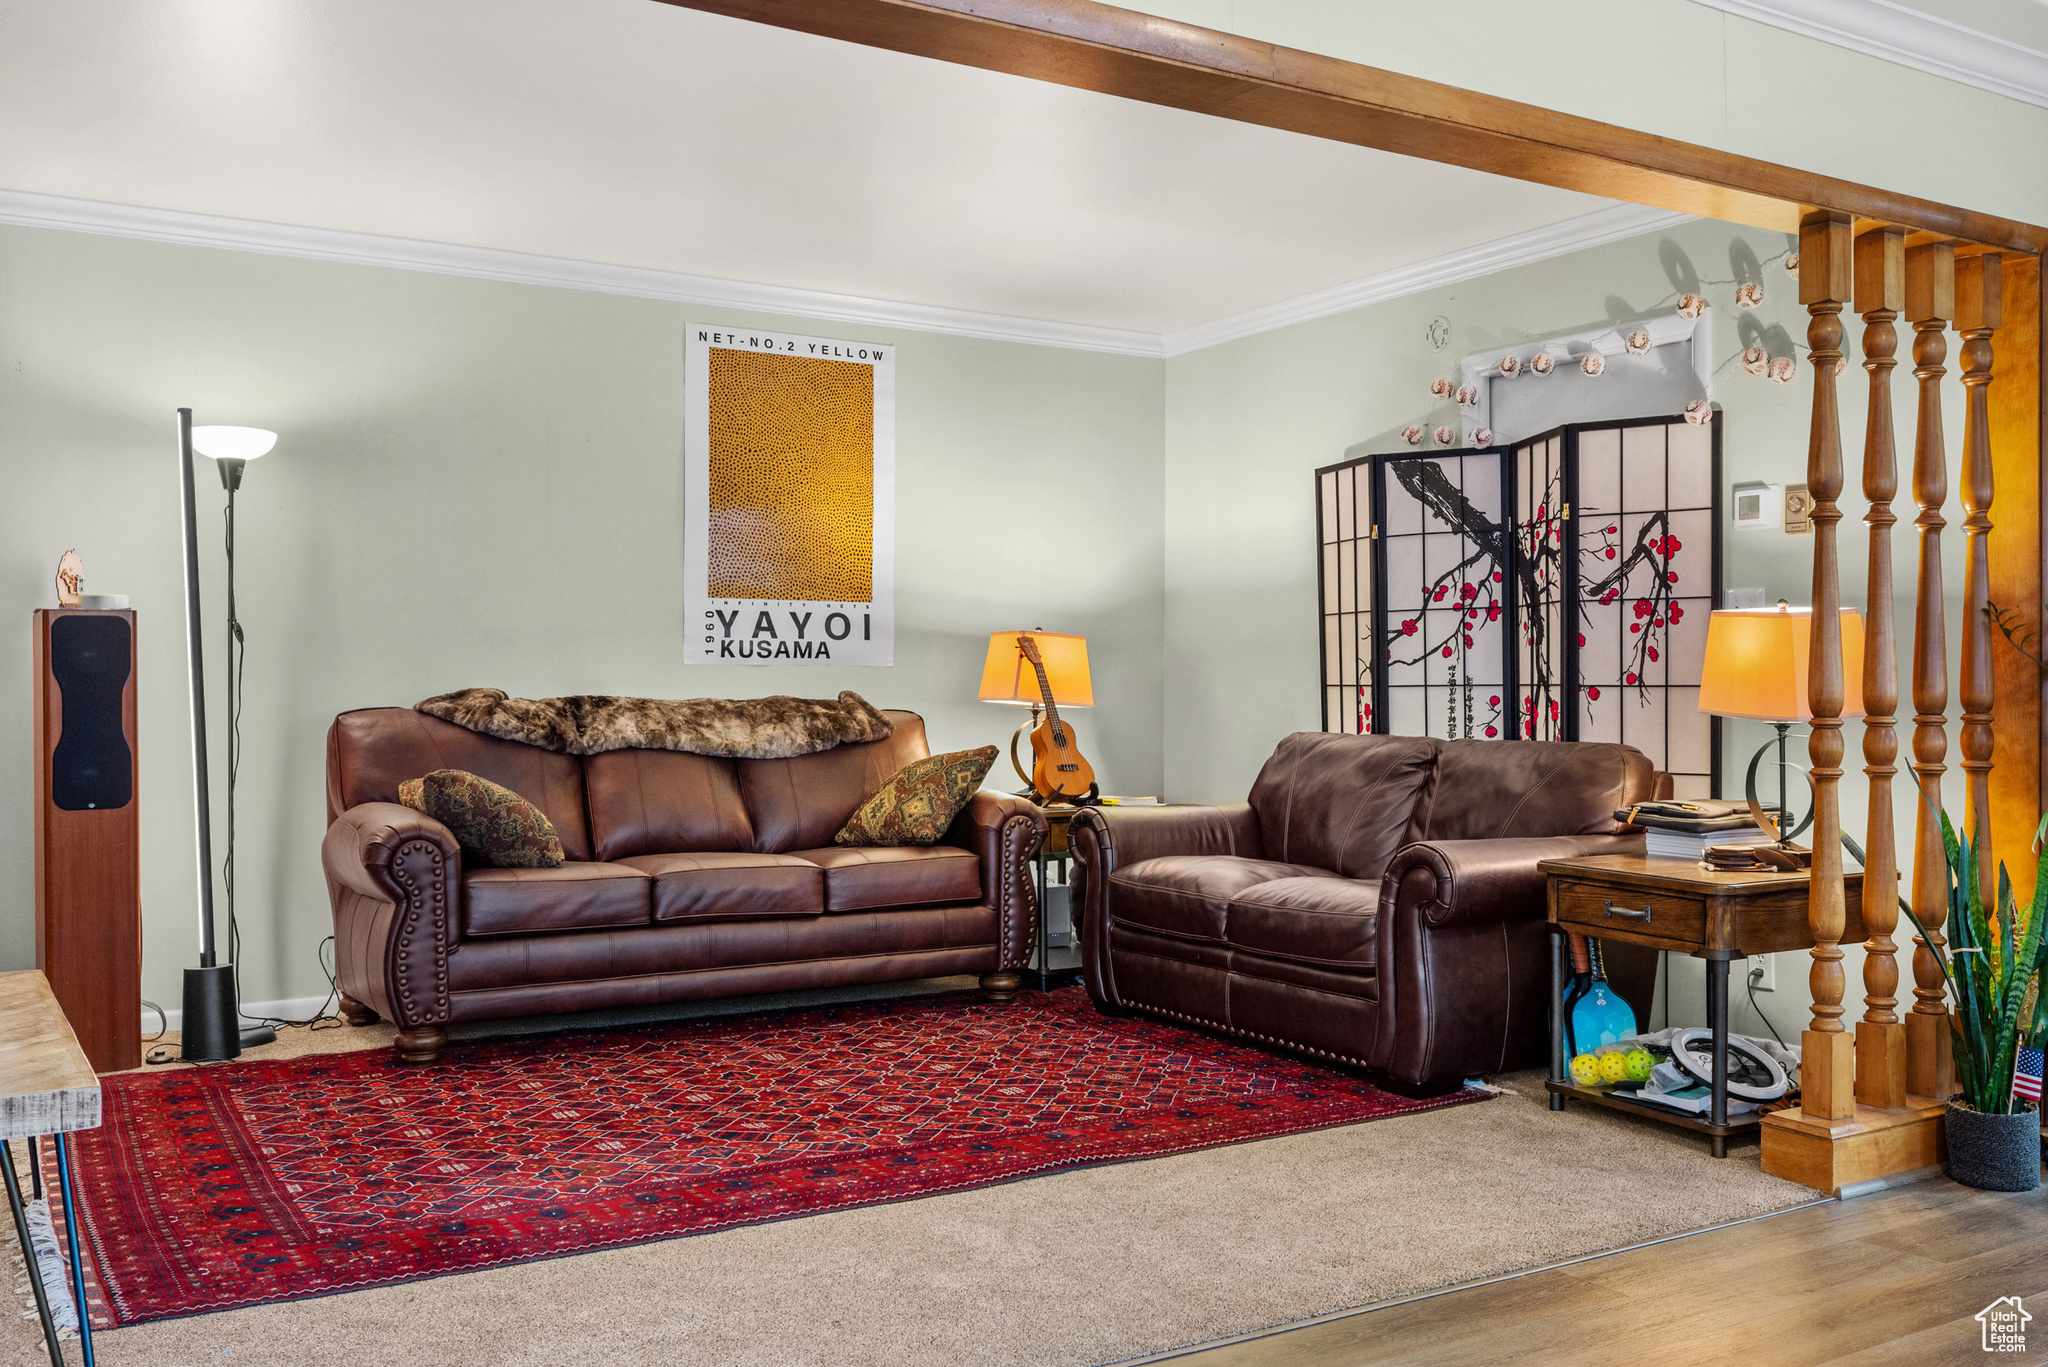
$278,000
2
bds
|
1
ba
|
747
sqft
|
built
1961
650 N 300 W, Salt Lake City, UT 84103
$-728
Cash flow
-13.7%
Cash-on-Cash Return
3.1%
Cap rate
0.6%
Rent to Value Ratio
674 out of 776 properties for sale in Salt Lake City, UT
Limited Results Shown
Create a free account, or log in to reveal all property listings and enjoy the complete experience.
Active
$1,309,999
5
bds
|
4
ba
|
5,108
sqft
|
built
2008
3059 S Lola Cir, Salt Lake City, UT 84109
$-4,230
Cash flow
-16.8%
Cash-on-Cash Return
2.4%
Cap rate
0.3%
Rent to Value Ratio
Active
$595,000
2
bds
|
2
ba
|
1,358
sqft
|
built
1985
3125 E Kennedy Dr, Salt Lake City, UT 84108
$-2,058
Cash flow
-18.0%
Cash-on-Cash Return
2.1%
Cap rate
0.4%
Rent to Value Ratio
Active
$475,000
4
bds
|
2
ba
|
1,960
sqft
|
built
1977
6489 W Castle View Dr, Salt Lake City, UT 84128
$-1,498
Cash flow
-16.5%
Cash-on-Cash Return
2.5%
Cap rate
0.4%
Rent to Value Ratio
Active
$374,999
2
bds
|
1
ba
|
1,175
sqft
|
built
1964
1130 E 2700 S, Salt Lake City, UT 84106
$-1,222
Cash flow
-17.0%
Cash-on-Cash Return
2.4%
Cap rate
0.4%
Rent to Value Ratio
Active
$385,000
3
bds
|
2
ba
|
1,440
sqft
|
built
1954
4490 W 5055 S, Salt Lake City, UT 84118
$-976
Cash flow
-13.2%
Cash-on-Cash Return
3.2%
Cap rate
0.5%
Rent to Value Ratio
Active
$1,979,000
4
bds
|
4
ba
|
3,523
sqft
|
built
2024
707 E 9th Ave, Salt Lake City, UT 84103
$-5,524
Cash flow
-14.6%
Cash-on-Cash Return
2.9%
Cap rate
0.4%
Rent to Value Ratio
Active
$3,700,000
30
bds
|
22
ba
|
14,859
sqft
|
built
1916
240 N Spencer Ct, Salt Lake City, UT 84103
$-18,994
Cash flow
-26.8%
Cash-on-Cash Return
0.1%
Cap rate
0.1%
Rent to Value Ratio
Active
$609,000
3
bds
|
3
ba
|
1,698
sqft
|
built
2021
1739 S Main St, Salt Lake City, UT 84115
$-1,704
Cash flow
-14.6%
Cash-on-Cash Return
2.9%
Cap rate
0.5%
Rent to Value Ratio
Active
$511,400
4
bds
|
2
ba
|
2,229
sqft
|
built
1955
4880 S 4380 W, Salt Lake City, UT 84118
$-1,162
Cash flow
-11.9%
Cash-on-Cash Return
3.6%
Cap rate
0.5%
Rent to Value Ratio

Active
$1,890,000
6
bds
|
4
ba
|
4,874
sqft
|
built
1960
4756 S Deercreek Rd, Salt Lake City, UT 84124
$-7,233
Cash flow
-20.0%
Cash-on-Cash Return
1.7%
Cap rate
0.2%
Rent to Value Ratio
Active
$570,000
6
bds
|
3
ba
|
2,705
sqft
|
built
1995
2956 W Mac Kay Meadows Pl, Salt Lake City, UT 84119
$-1,777
Cash flow
-16.3%
Cash-on-Cash Return
2.5%
Cap rate
0.4%
Rent to Value Ratio
Active
$1,600,000
12
bds
|
6
ba
|
5,556
sqft
|
built
1950
3334 S 825 E, Salt Lake City, UT 84106
$-6,883
Cash flow
-22.4%
Cash-on-Cash Return
1.1%
Cap rate
0.2%
Rent to Value Ratio
Active
$560,000
1
bds
|
1
ba
|
1,599
sqft
|
built
1907
1197 S 700 E, Salt Lake City, UT 84105
$-983
Cash flow
-9.2%
Cash-on-Cash Return
4.2%
Cap rate
0.6%
Rent to Value Ratio
Active
$2,750,000
5
bds
|
4
ba
|
3,749
sqft
|
built
2022
4471 S Covecrest Dr, Salt Lake City, UT 84124
$-12,138
Cash flow
-23.0%
Cash-on-Cash Return
1.0%
Cap rate
0.2%
Rent to Value Ratio
Active
$2,575,000
5
bds
|
5
ba
|
5,130
sqft
|
built
1976
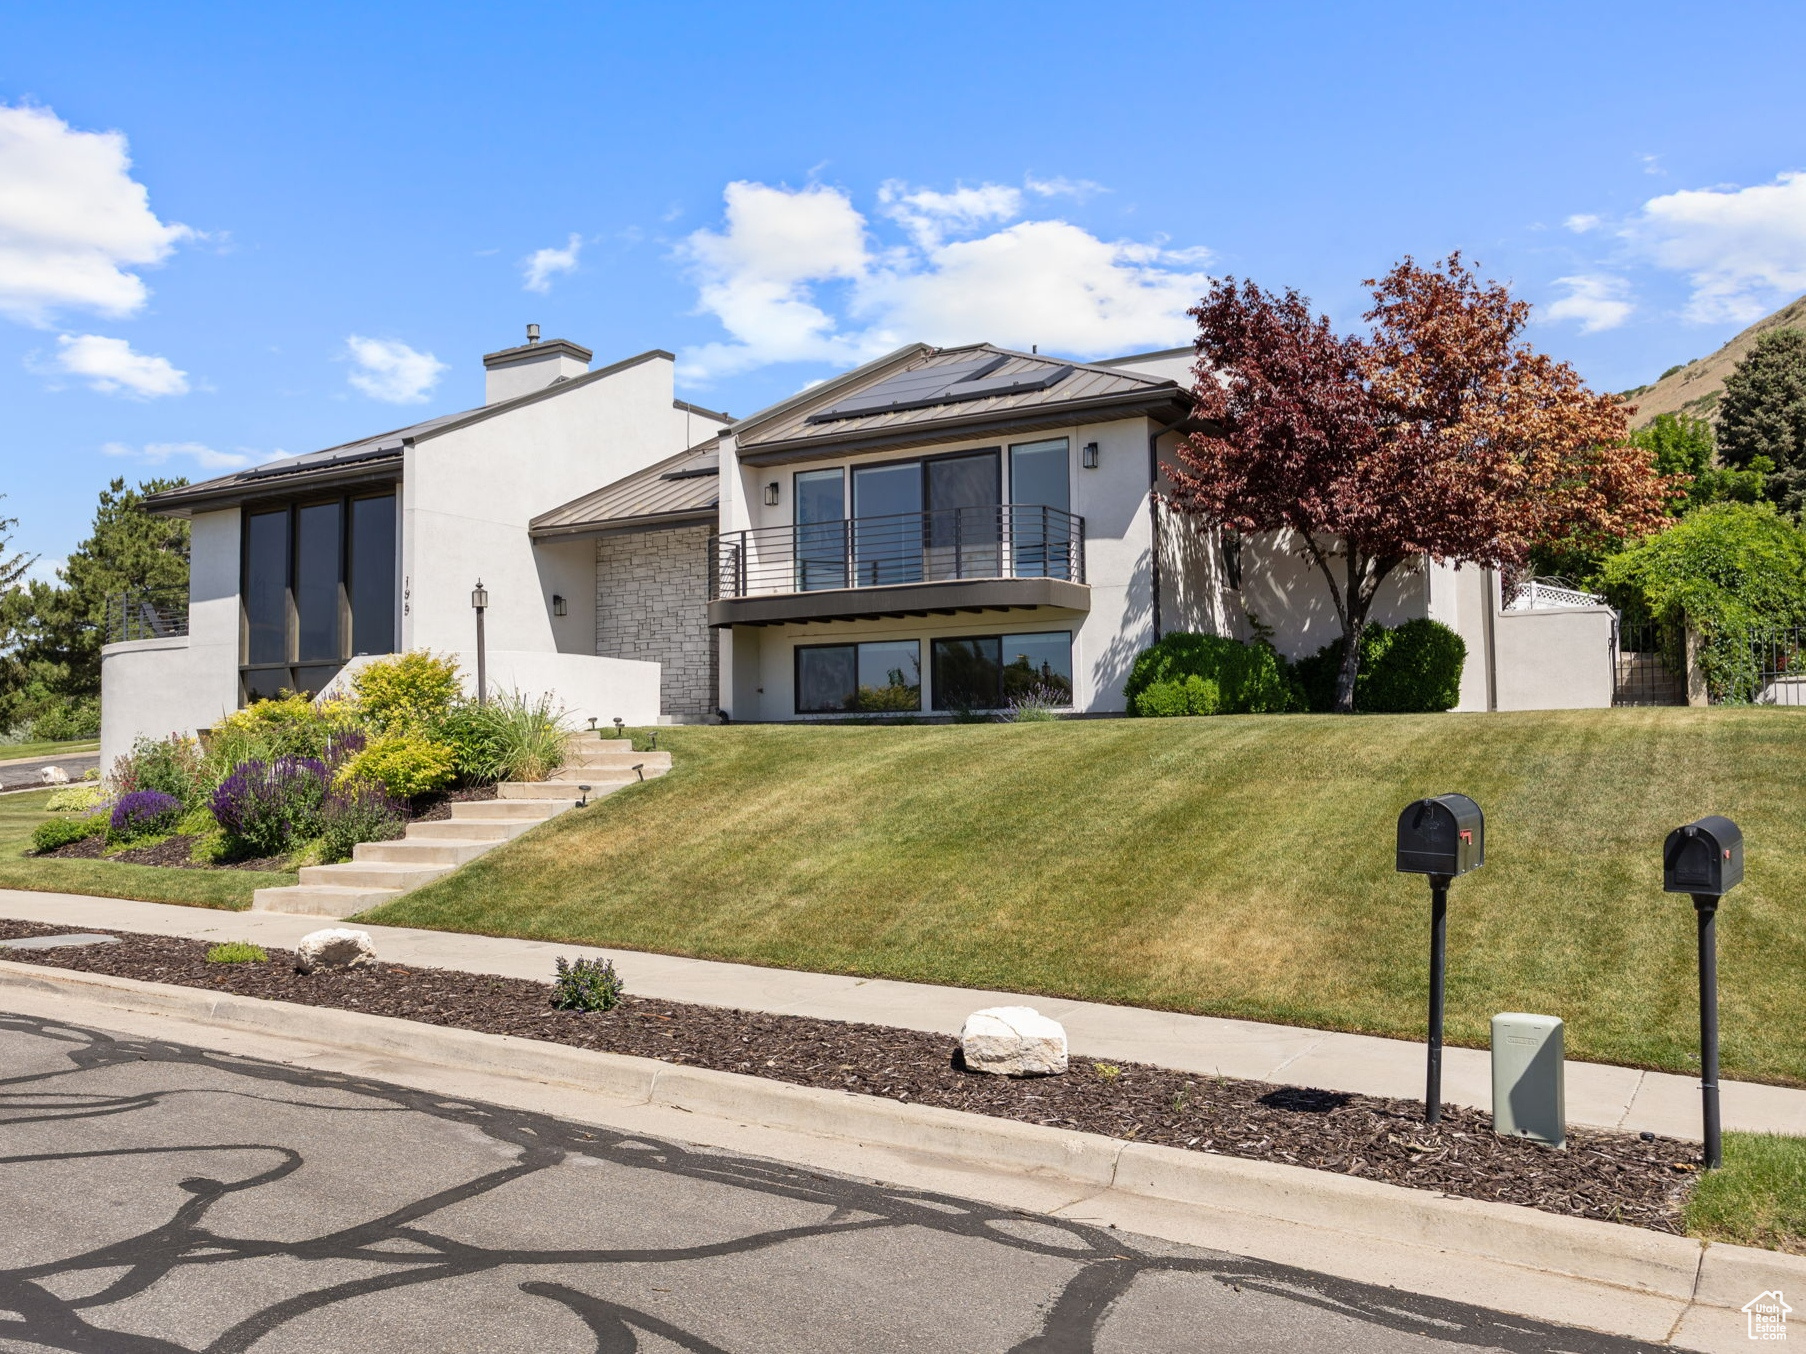
195 N Sandrun Rd, Salt Lake City, UT 84103
$-8,970
Cash flow
-18.2%
Cash-on-Cash Return
2.1%
Cap rate
0.3%
Rent to Value Ratio
Active
$4,900,000
28
bds
|
21
ba
|
14,850
sqft
|
built
1923
146 E 2nd Ave, Salt Lake City, UT 84103
$-26,074
Cash flow
-27.8%
Cash-on-Cash Return
-0.1%
Cap rate
0.0%
Rent to Value Ratio
Pending
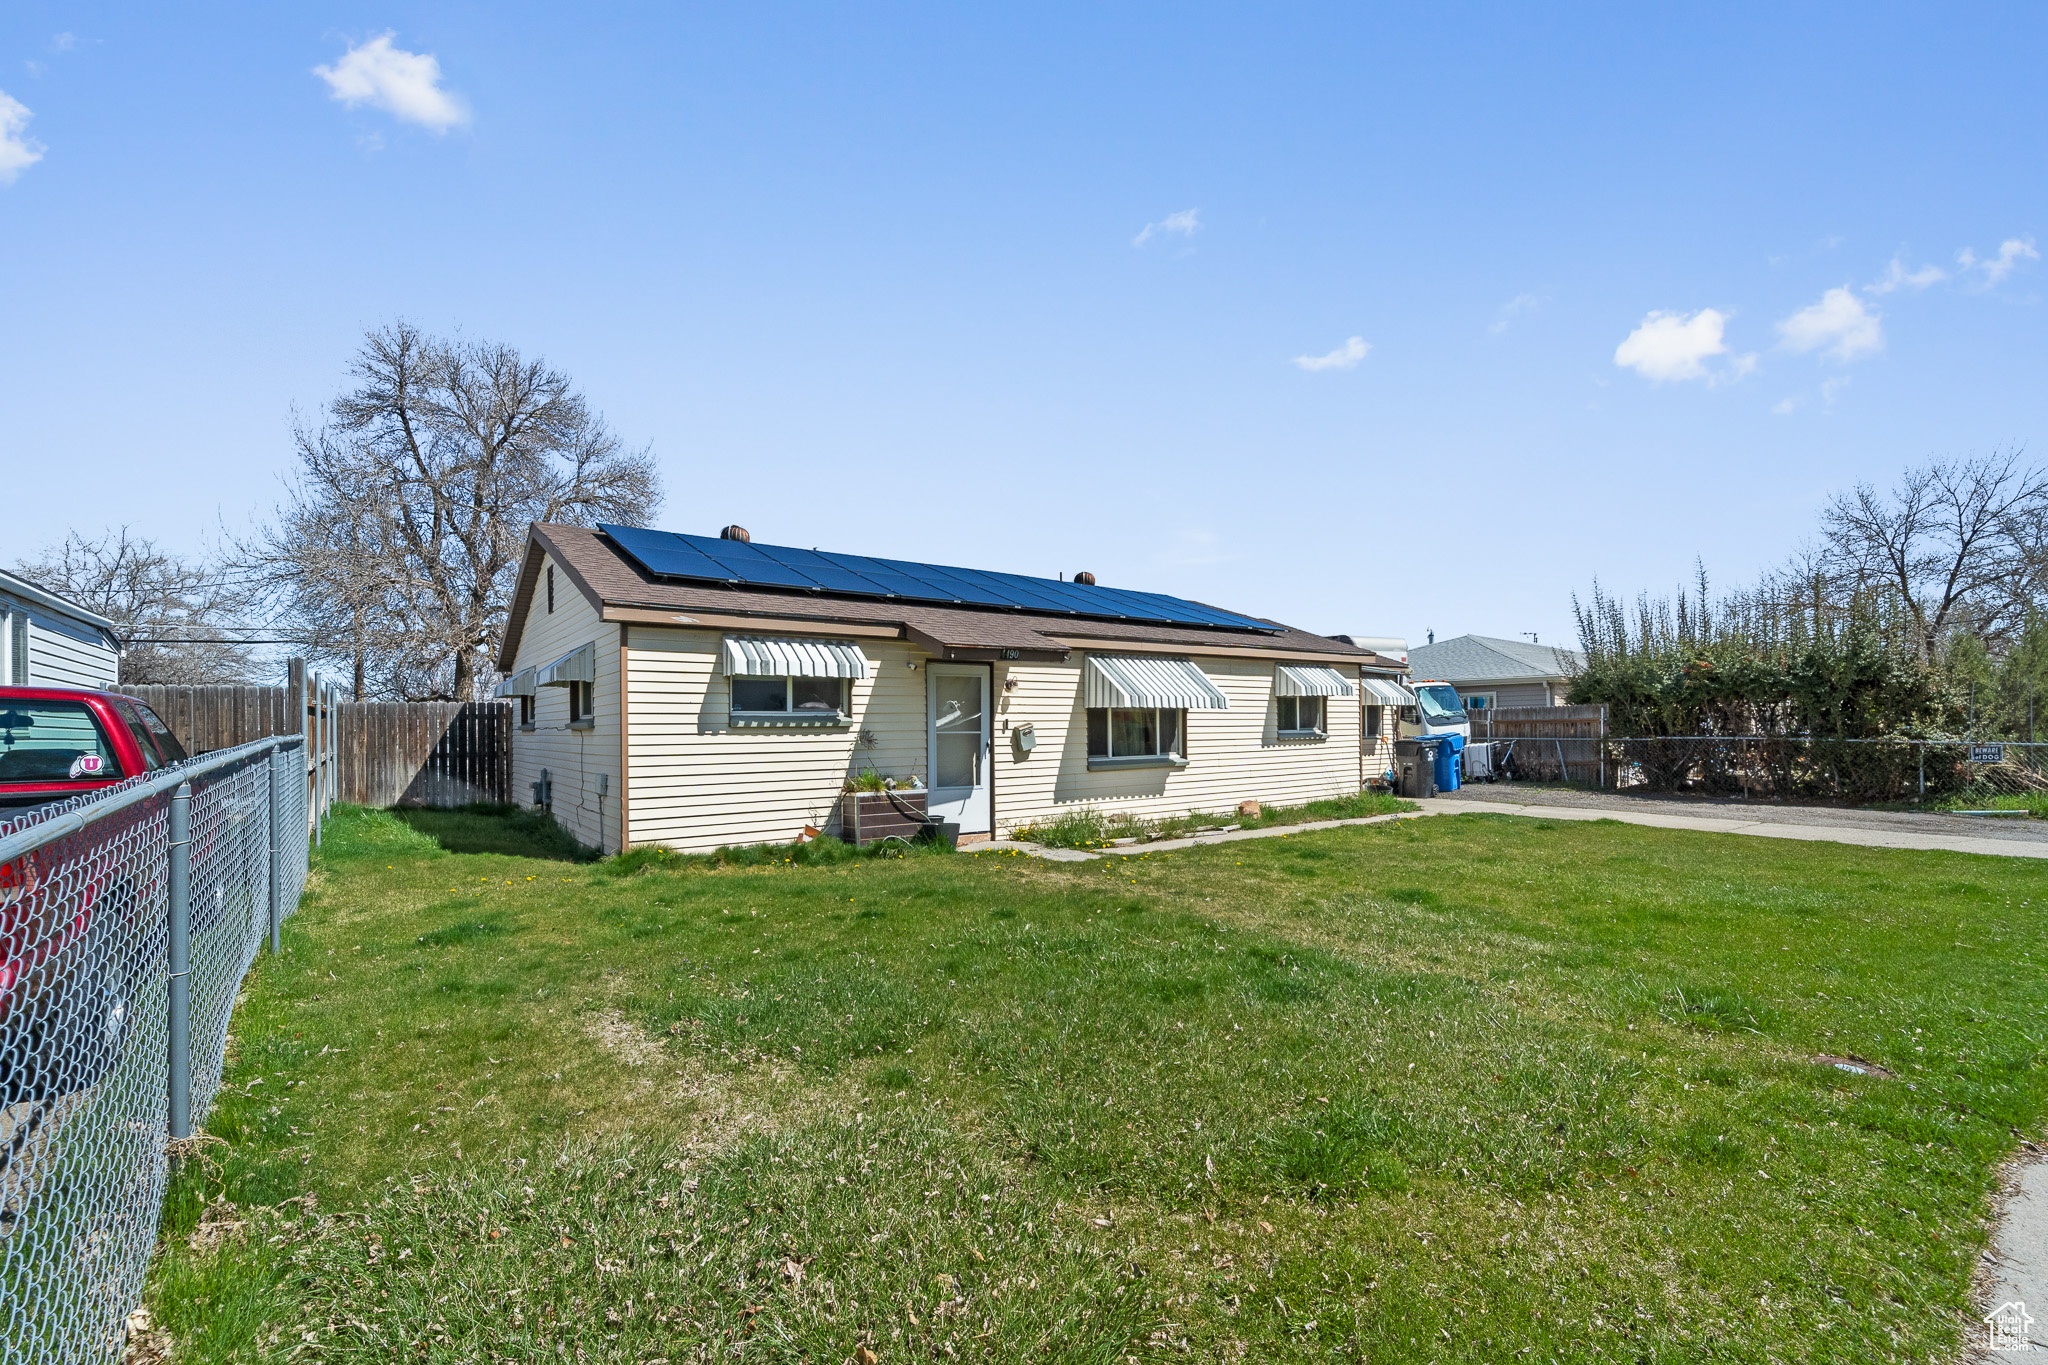
$409,900
4
bds
|
2
ba
|
1,280
sqft
|
built
1977
4920 W Milos Dr, Salt Lake City, UT 84120
$-961
Cash flow
-12.2%
Cash-on-Cash Return
3.5%
Cap rate
0.5%
Rent to Value Ratio
Active
$470,000
5
bds
|
2
ba
|
1,608
sqft
|
built
1950
1150 W Girard Ave, Salt Lake City, UT 84116
$-1,026
Cash flow
-11.4%
Cash-on-Cash Return
3.7%
Cap rate
0.5%
Rent to Value Ratio
Active
$949,000
4
bds
|
2
ba
|
2,218
sqft
|
built
1955
692 N Cortez St, Salt Lake City, UT 84103
$-4,063
Cash flow
-22.3%
Cash-on-Cash Return
1.1%
Cap rate
0.2%
Rent to Value Ratio
Active
$695,000
4
bds
|
2
ba
|
2,190
sqft
|
built
1951
2986 S 2900 E, Salt Lake City, UT 84109
$-2,348
Cash flow
-17.6%
Cash-on-Cash Return
2.2%
Cap rate
0.3%
Rent to Value Ratio
Active
$749,900
4
bds
|
3
ba
|
2,237
sqft
|
built
1962
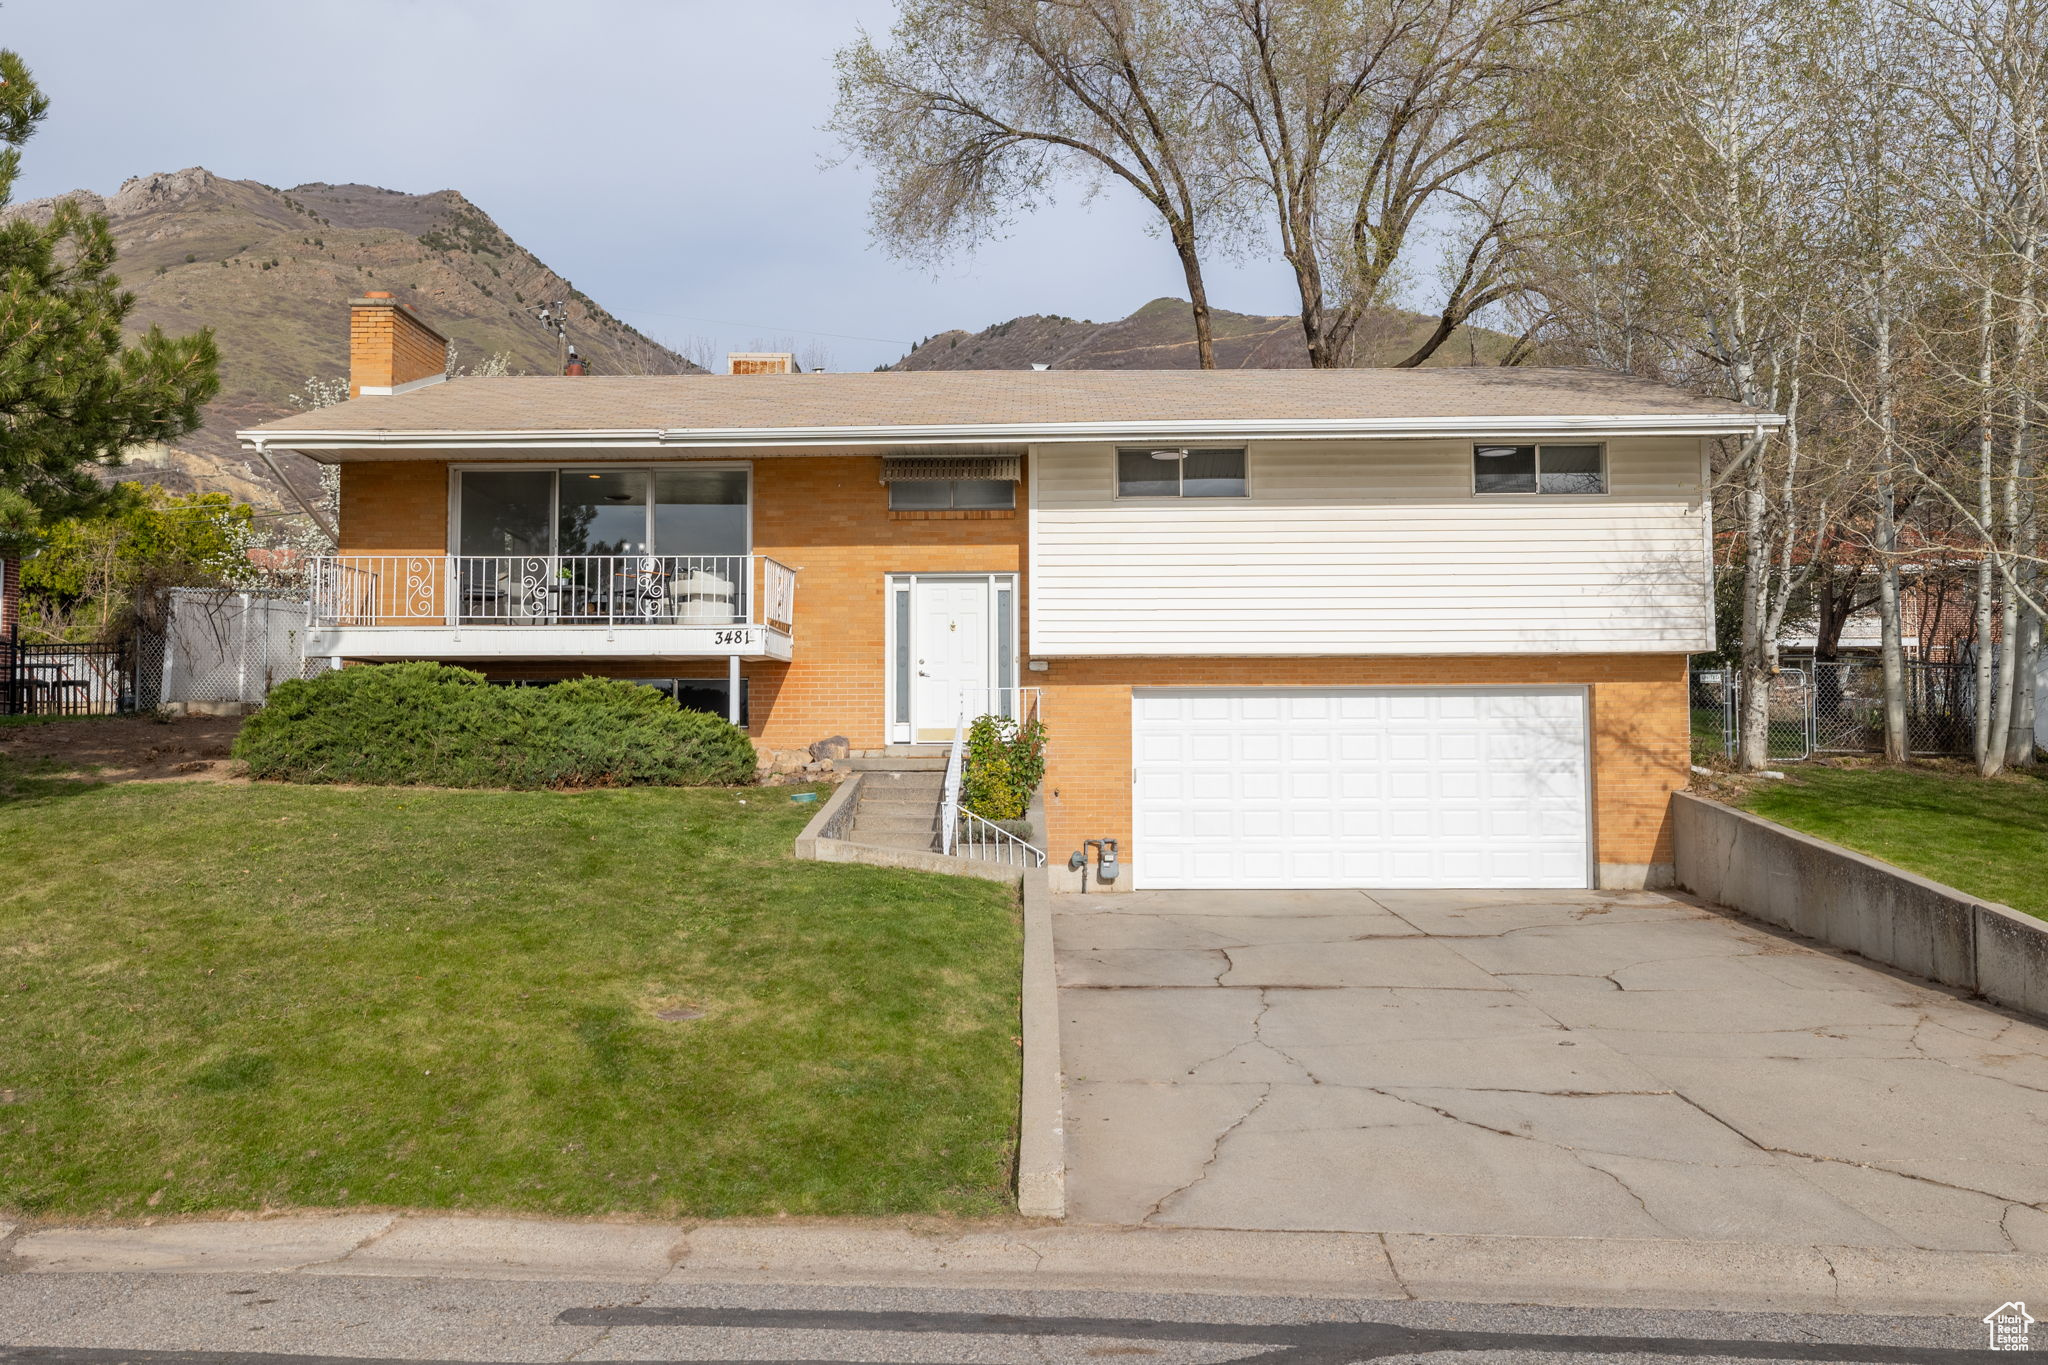
3481 S 3530 E, Salt Lake City, UT 84109
$-2,335
Cash flow
-16.2%
Cash-on-Cash Return
2.5%
Cap rate
0.4%
Rent to Value Ratio
Active
$439,000
3
bds
|
2
ba
|
1,676
sqft
|
built
1976
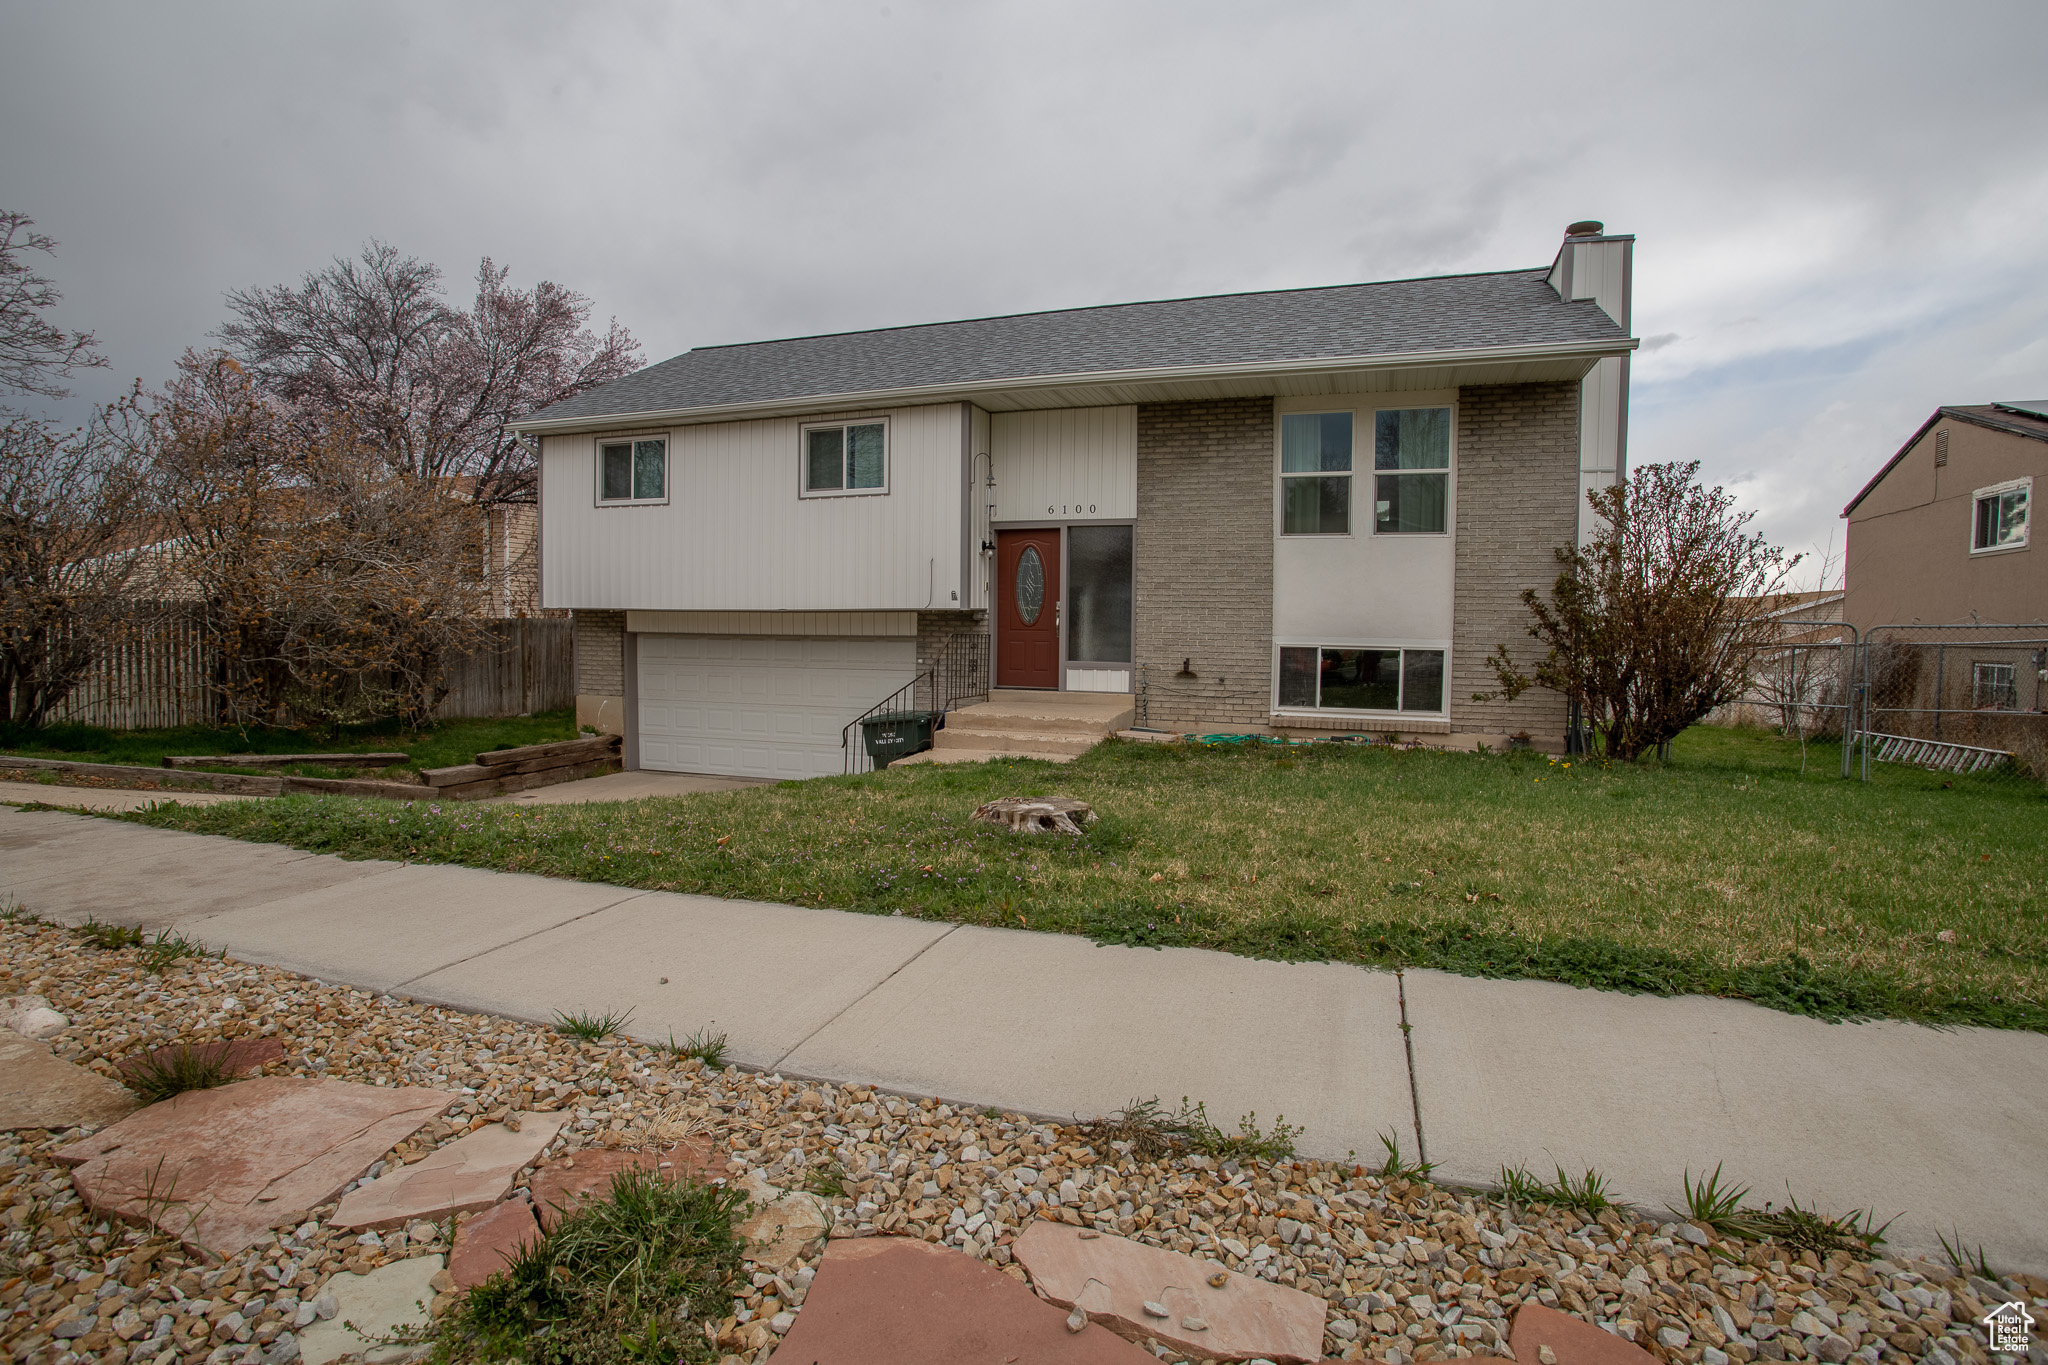
6100 W 3725 S, Salt Lake City, UT 84128
$-1,405
Cash flow
-16.7%
Cash-on-Cash Return
2.4%
Cap rate
0.4%
Rent to Value Ratio
Active
$575,000
6
bds
|
3
ba
|
2,452
sqft
|
built
2000
3018 S Asplund Cir, Salt Lake City, UT 84119
$-2,045
Cash flow
-18.6%
Cash-on-Cash Return
2.0%
Cap rate
0.3%
Rent to Value Ratio
Active
$959,000
5
bds
|
4
ba
|
3,872
sqft
|
built
1901
427 E 1st Ave, Salt Lake City, UT 84103
$-3,214
Cash flow
-17.5%
Cash-on-Cash Return
2.3%
Cap rate
0.3%
Rent to Value Ratio
Active
$549,900
2
bds
|
1
ba
|
1,538
sqft
|
built
1906
736 E 800 S, Salt Lake City, UT 84102
$-1,178
Cash flow
-11.2%
Cash-on-Cash Return
3.7%
Cap rate
0.5%
Rent to Value Ratio
Pending
$549,900
6
bds
|
3
ba
|
1,926
sqft
|
built
1976
5455 W Peggy Ln, Salt Lake City, UT 84120
$-1,353
Cash flow
-12.8%
Cash-on-Cash Return
3.3%
Cap rate
0.5%
Rent to Value Ratio
Active
$650,000
4
bds
|
2
ba
|
1,854
sqft
|
built
1915
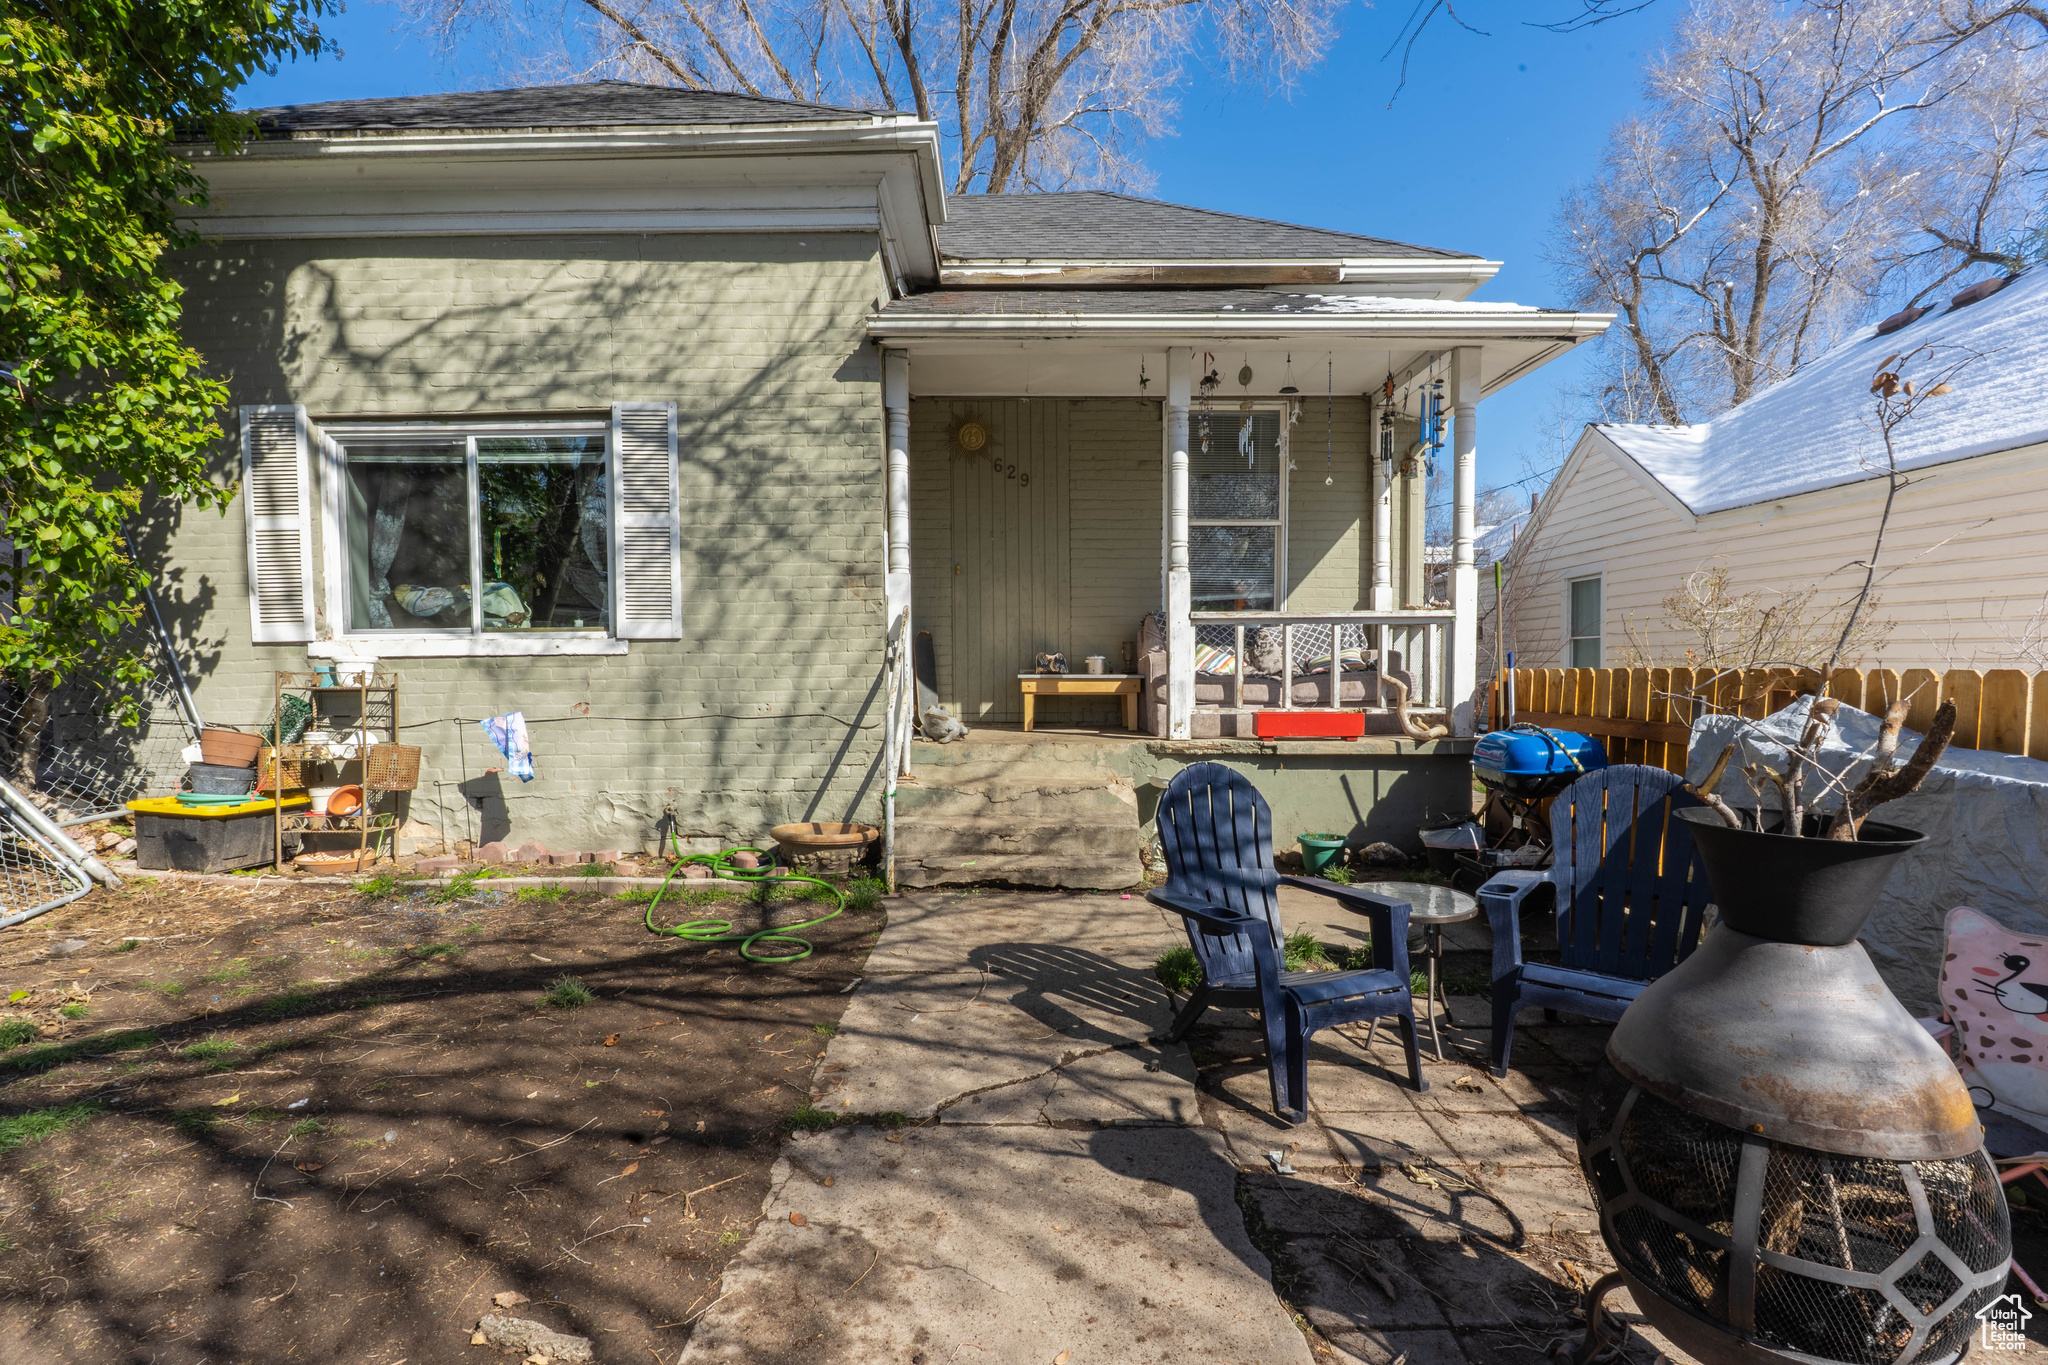
629 S 400 E, Salt Lake City, UT 84111
$-1,897
Cash flow
-15.2%
Cash-on-Cash Return
2.8%
Cap rate
0.4%
Rent to Value Ratio
Active
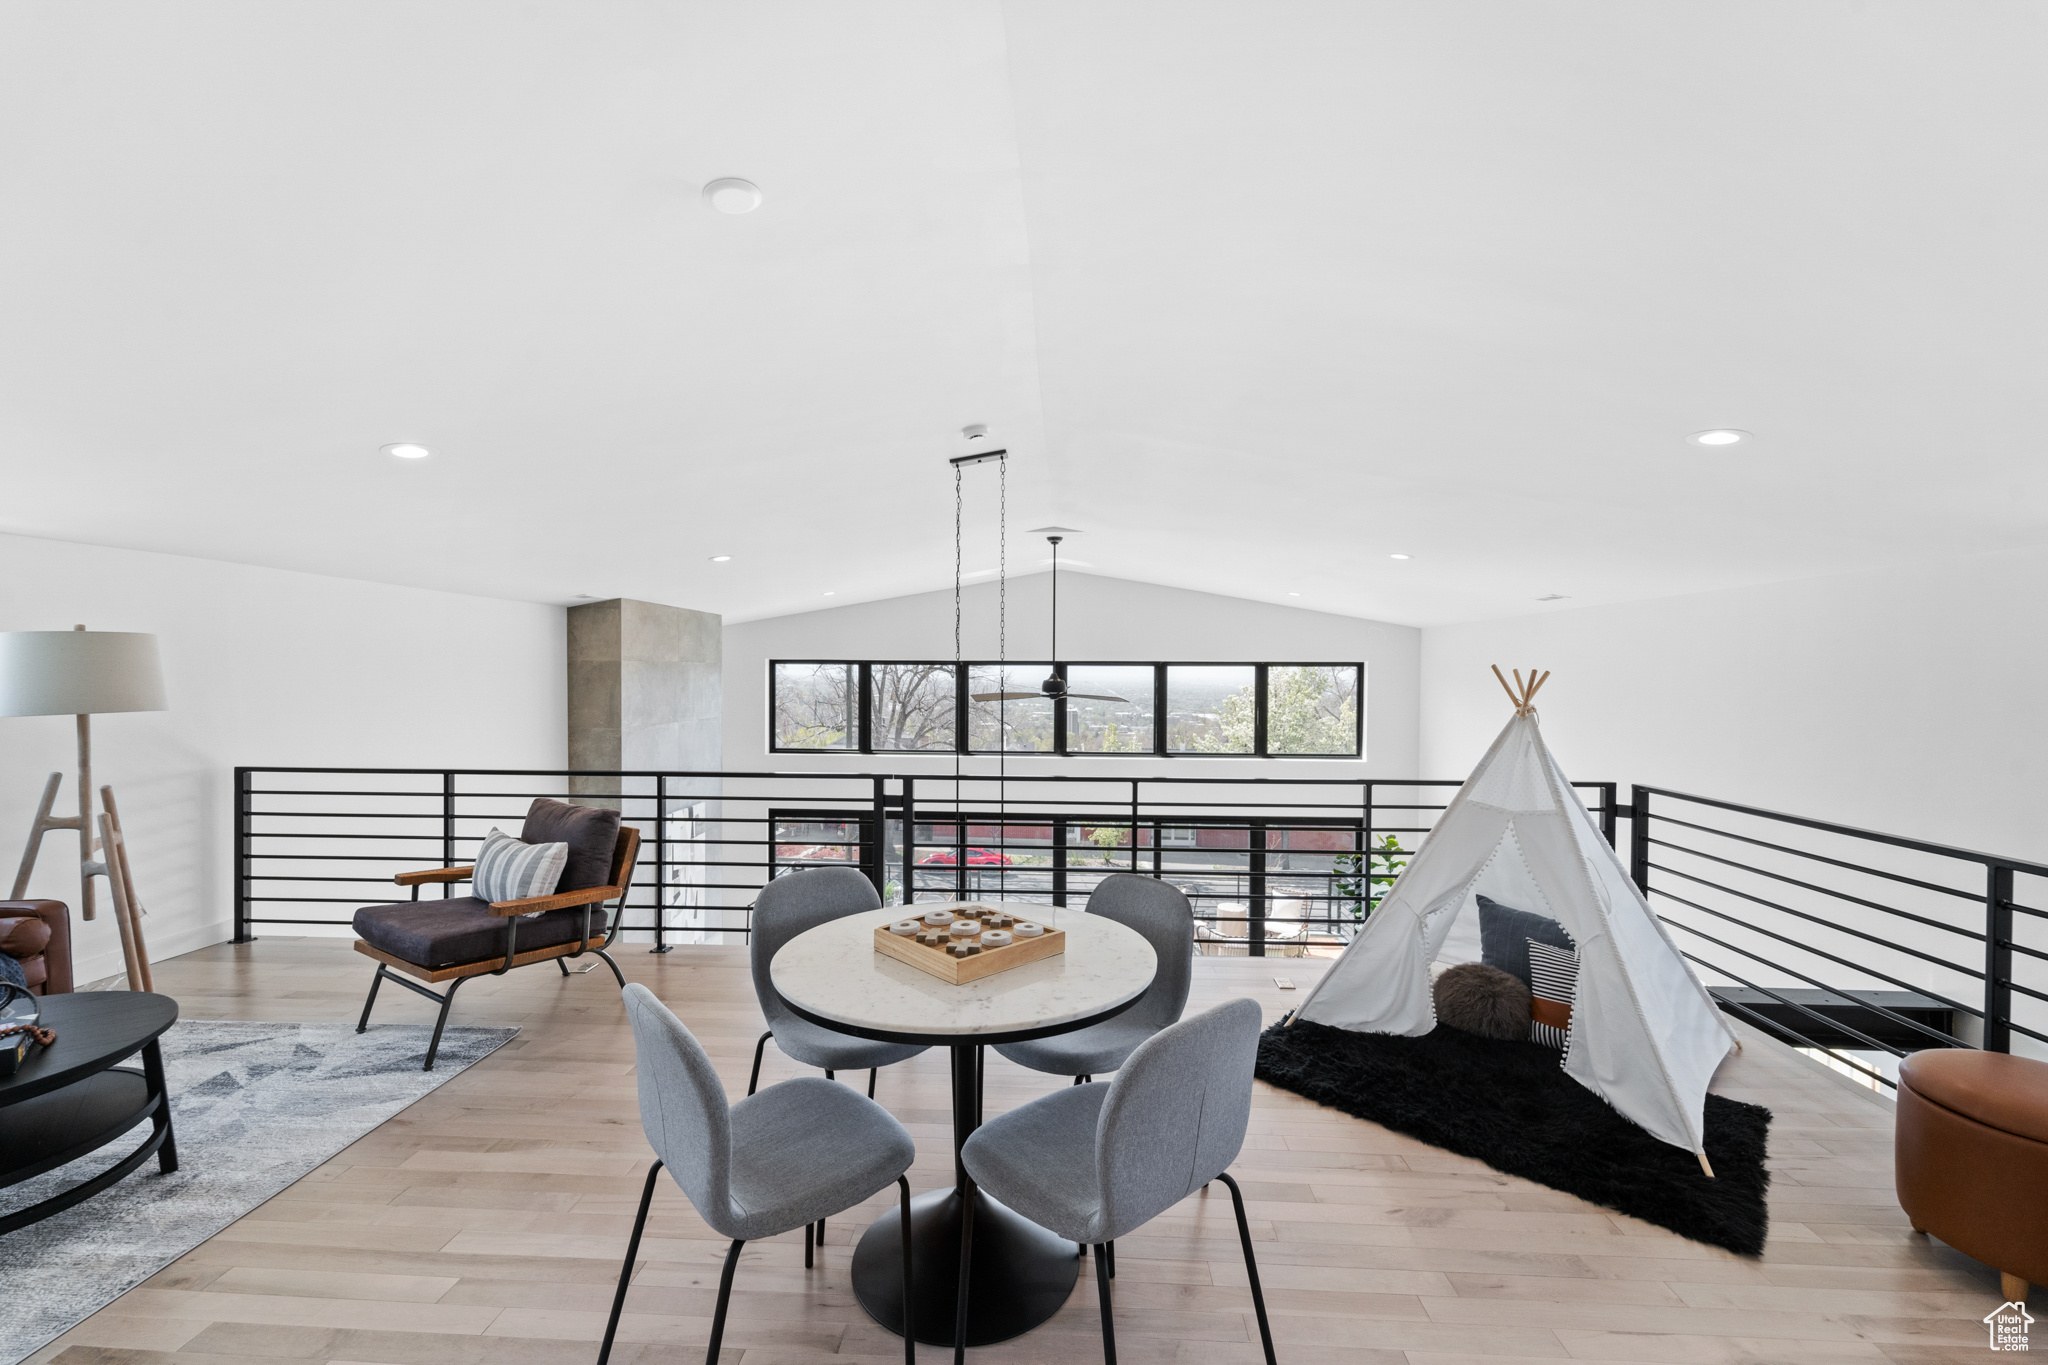
$1,699,000
6
bds
|
4
ba
|
3,380
sqft
|
built
1939
1585 S 2300 E, Salt Lake City, UT 84108
$-6,934
Cash flow
-21.3%
Cash-on-Cash Return
1.4%
Cap rate
0.2%
Rent to Value Ratio
Active
$2,995,000
5
bds
|
4
ba
|
5,886
sqft
|
built
1951
2532 E Maywood Dr, Salt Lake City, UT 84109
$-11,436
Cash flow
-19.9%
Cash-on-Cash Return
1.7%
Cap rate
0.2%
Rent to Value Ratio
Active
$2,000,000
4
bds
|
6
ba
|
6,889
sqft
|
built
1997
2726 E Wasatch Dr, Salt Lake City, UT 84108
$-9,670
Cash flow
-25.2%
Cash-on-Cash Return
0.5%
Cap rate
0.2%
Rent to Value Ratio
Active
$889,900
2
bds
|
2
ba
|
1,643
sqft
|
built
1976
245 N Vine St, Salt Lake City, UT 84103
$-3,330
Cash flow
-19.5%
Cash-on-Cash Return
1.8%
Cap rate
0.4%
Rent to Value Ratio
Active
$278,000
2
bds
|
1
ba
|
747
sqft
|
built
1961
650 N 300 W, Salt Lake City, UT 84103
$-728
Cash flow
-13.7%
Cash-on-Cash Return
3.1%
Cap rate
0.6%
Rent to Value Ratio
Active under contract
$354,900
3
bds
|
1
ba
|
962
sqft
|
built
1958
4165 W 4715 S, Salt Lake City, UT 84118
$-654
Cash flow
-9.6%
Cash-on-Cash Return
4.1%
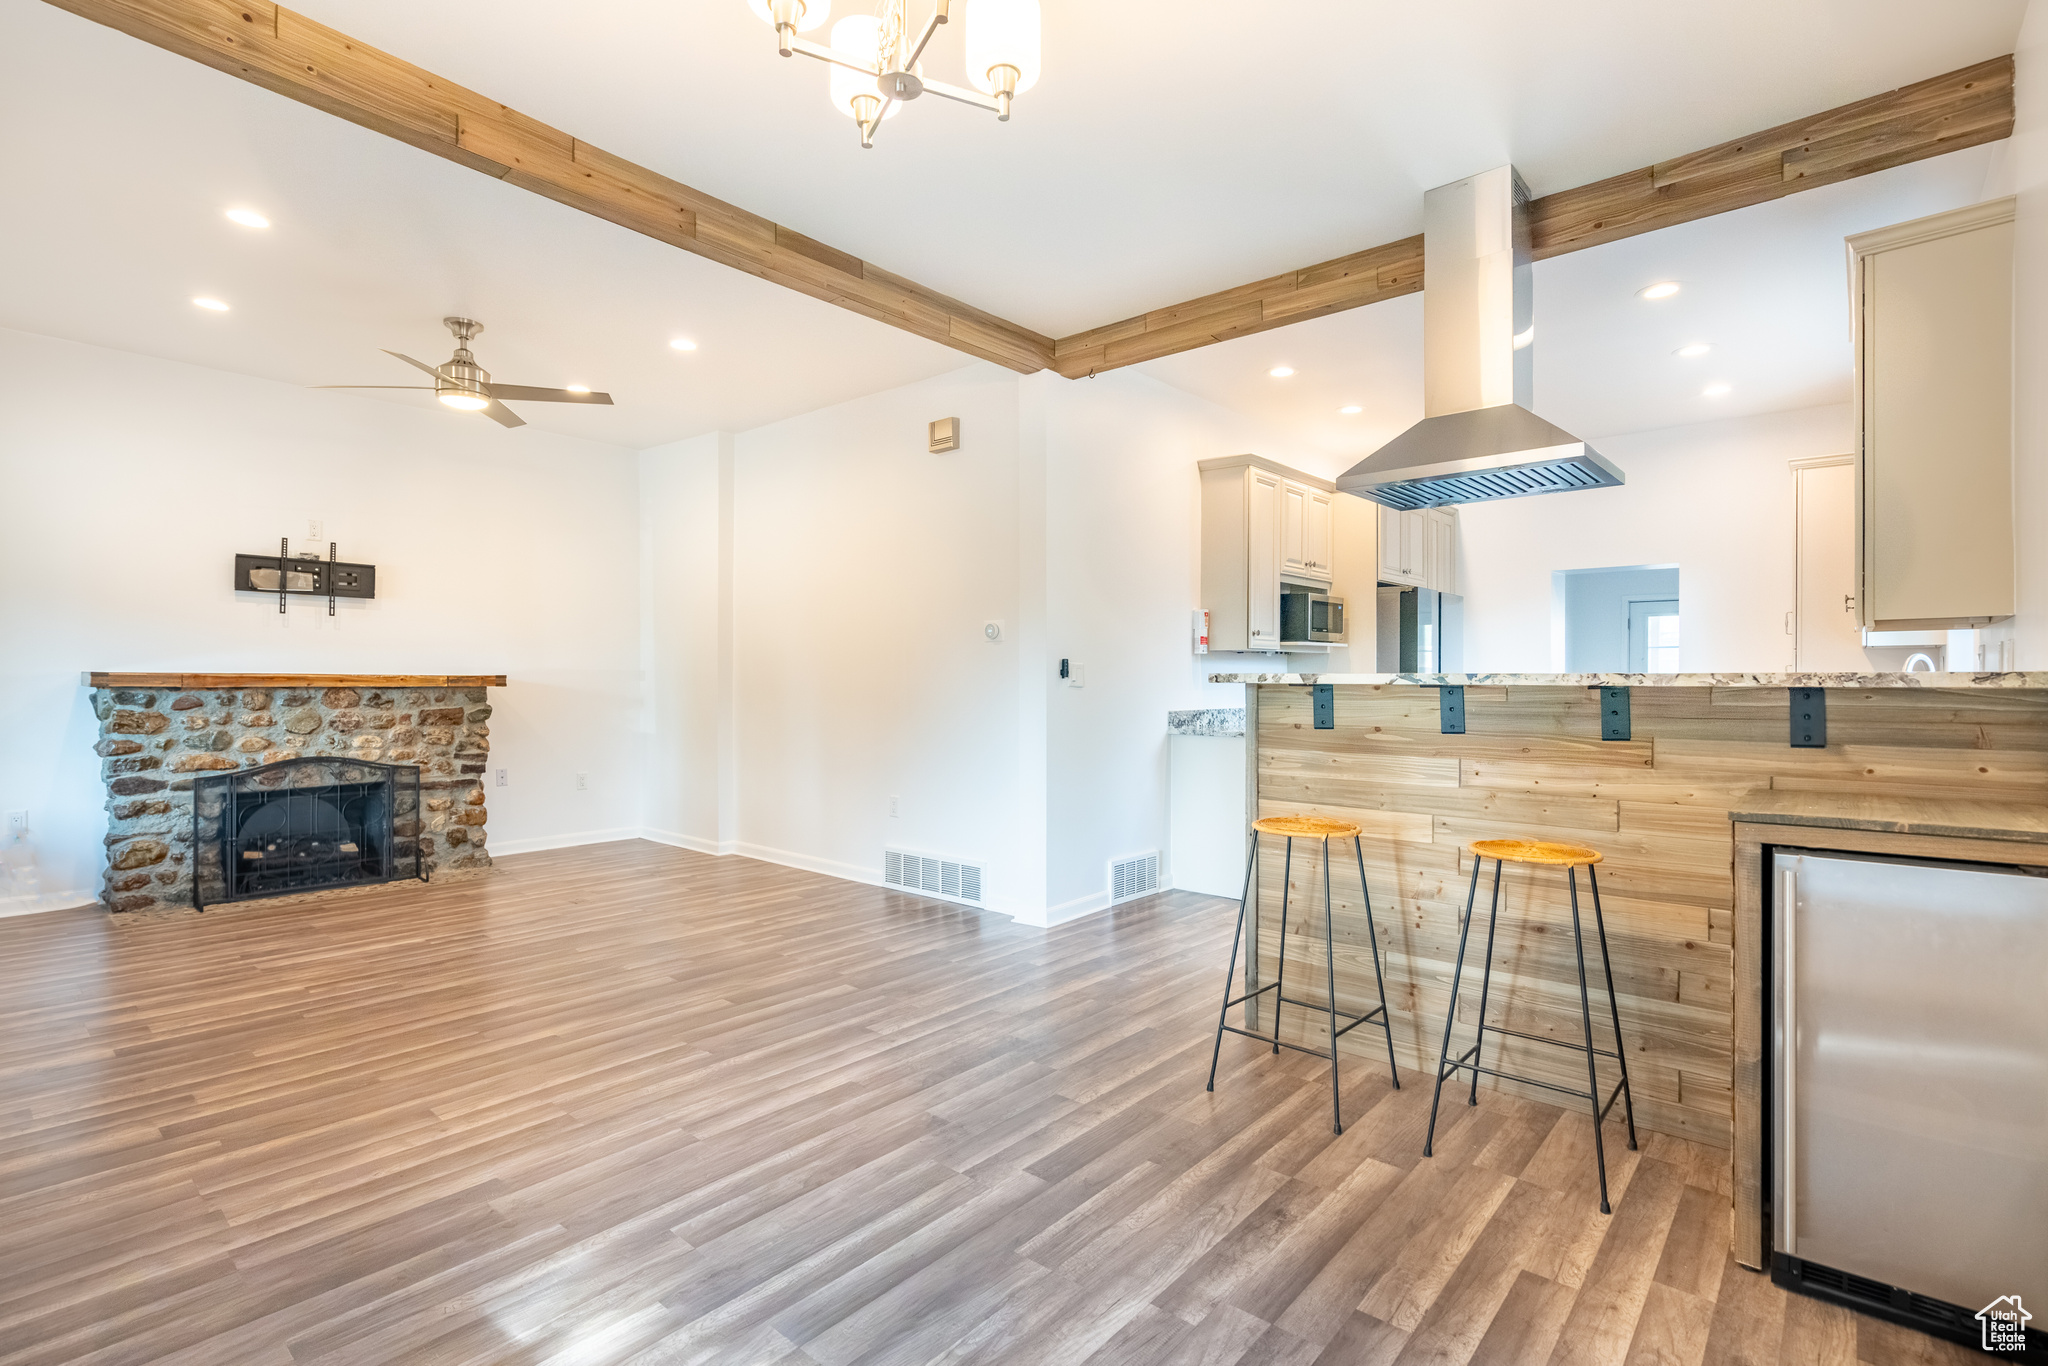
Cap rate
0.6%
Rent to Value Ratio
Active
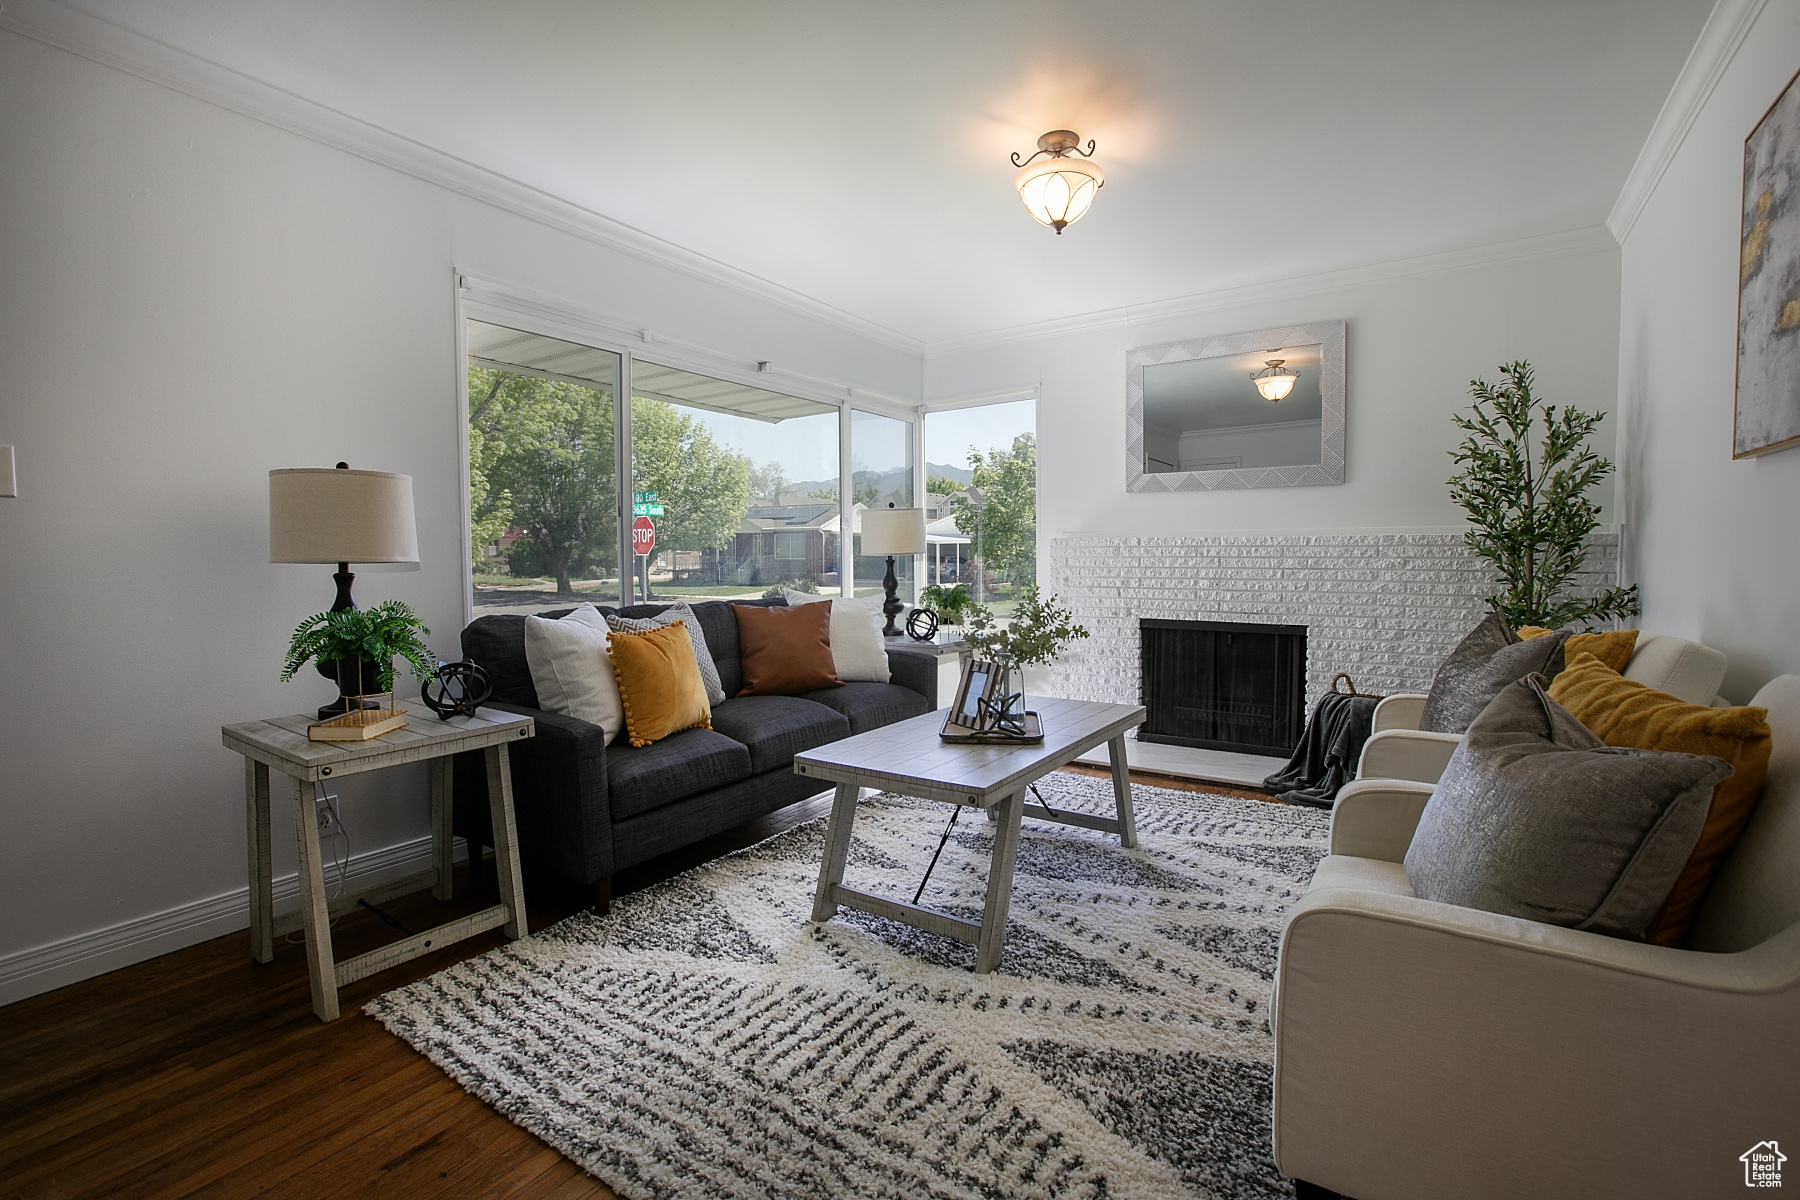
$539,900
3
bds
|
2
ba
|
1,602
sqft
|
built
1951
604 E 3635 S, Salt Lake City, UT 84106
$-1,549
Cash flow
-15.0%
Cash-on-Cash Return
2.8%
Cap rate
0.4%
Rent to Value Ratio
Active
$543,000
2
bds
|
1
ba
|
1,426
sqft
|
built
1930
771 E Belmont Ave, Salt Lake City, UT 84105
$-1,667
Cash flow
-16.0%
Cash-on-Cash Return
2.6%
Cap rate
0.4%
Rent to Value Ratio

Active
$888,888
4
bds
|
3
ba
|
1,800
sqft
|
built
1959
3491 S 3530 E, Salt Lake City, UT 84109
$-2,818
Cash flow
-16.5%
Cash-on-Cash Return
2.5%
Cap rate
0.4%
Rent to Value Ratio
Active
$2,300,000
16
bds
|
8
ba
|
9,563
sqft
|
built
1973
1162 E 400 S, Salt Lake City, UT 84102
$-11,496
Cash flow
-26.1%
Cash-on-Cash Return
0.3%
Cap rate
0.1%
Rent to Value Ratio
Active
$1,165,000
8
bds
|
4
ba
|
4,000
sqft
|
built
1921
672 N 200 W, Salt Lake City, UT 84103
$-4,410
Cash flow
-19.7%
Cash-on-Cash Return
1.7%
Cap rate
0.3%
Rent to Value Ratio
Active
$450,000
2
bds
|
2
ba
|
1,280
sqft
|
built
1964
777 E South Temple, Salt Lake City, UT 84102
$-2,029
Cash flow
-23.5%
Cash-on-Cash Return
0.9%
Cap rate
0.5%
Rent to Value Ratio
Active
$749,900
2
bds
|
3
ba
|
2,240
sqft
|
built
1981
71 W Apricot Ave, Salt Lake City, UT 84103
$-1,904
Cash flow
-13.2%
Cash-on-Cash Return
3.2%
Cap rate
0.5%
Rent to Value Ratio