Salt Lake City, UT Investment Properties for Sale
Browse homes for sale and investment properties in Salt Lake City, UT. Refine your search by price, property type, or more.
Best cash flowing properties in Salt Lake City, UT
Active
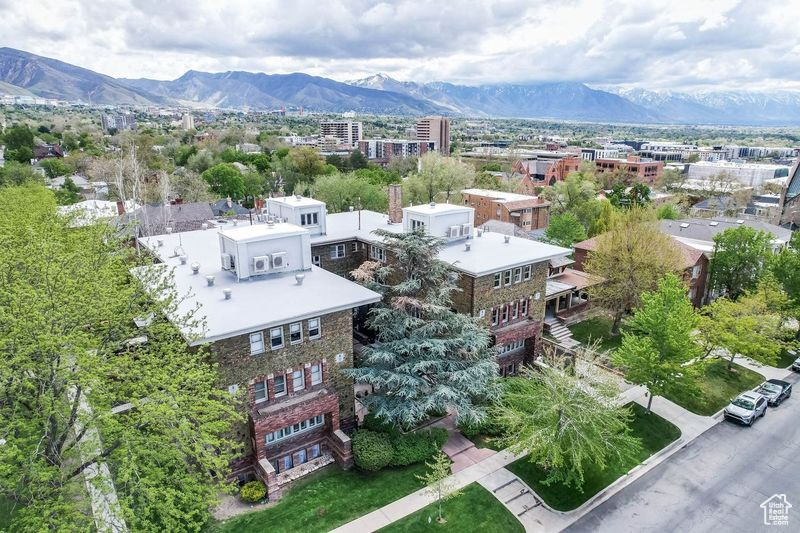
$180,000
1
bds
|
1
ba
|
400
sqft
|
built
1909
86 B St, Salt Lake City, UT 84103
$-479
Cash flow
-13.9%
Cash-on-Cash Return
3.1%
Cap rate
0.8%
Rent to Value Ratio
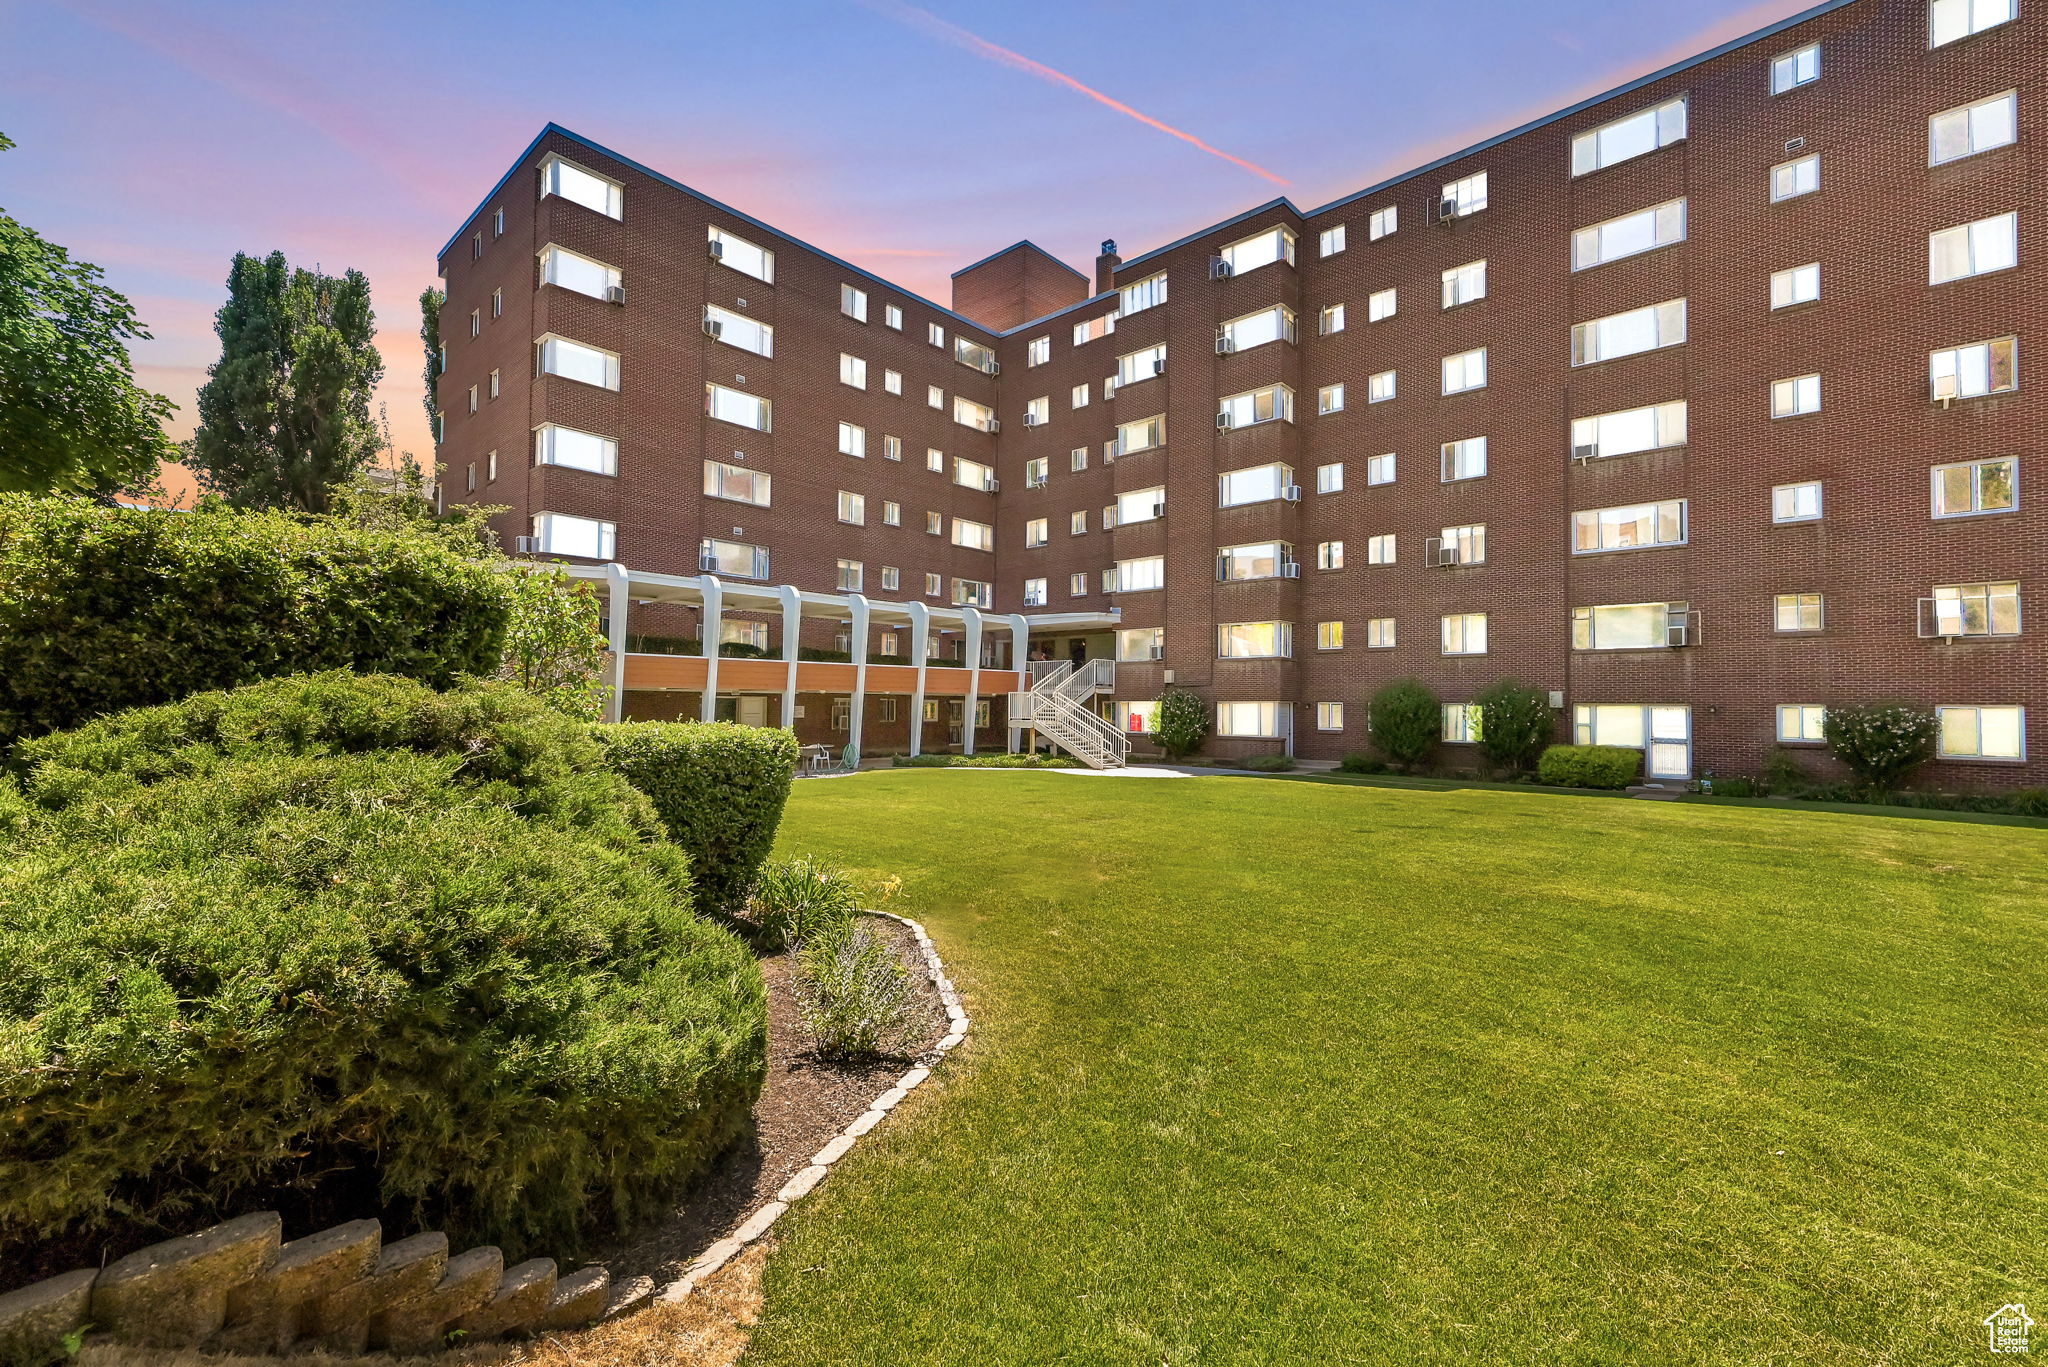
Active
$239,000
1
bds
|
1
ba
|
533
sqft
|
built
1951
130 S 1300 E, Salt Lake City, UT 84102
$-810
Cash flow
-17.7%
Cash-on-Cash Return
2.2%
Cap rate
0.5%
Rent to Value Ratio
677 out of 779 properties for sale in Salt Lake City, UT
Limited Results Shown
Create a free account, or log in to reveal all property listings and enjoy the complete experience.
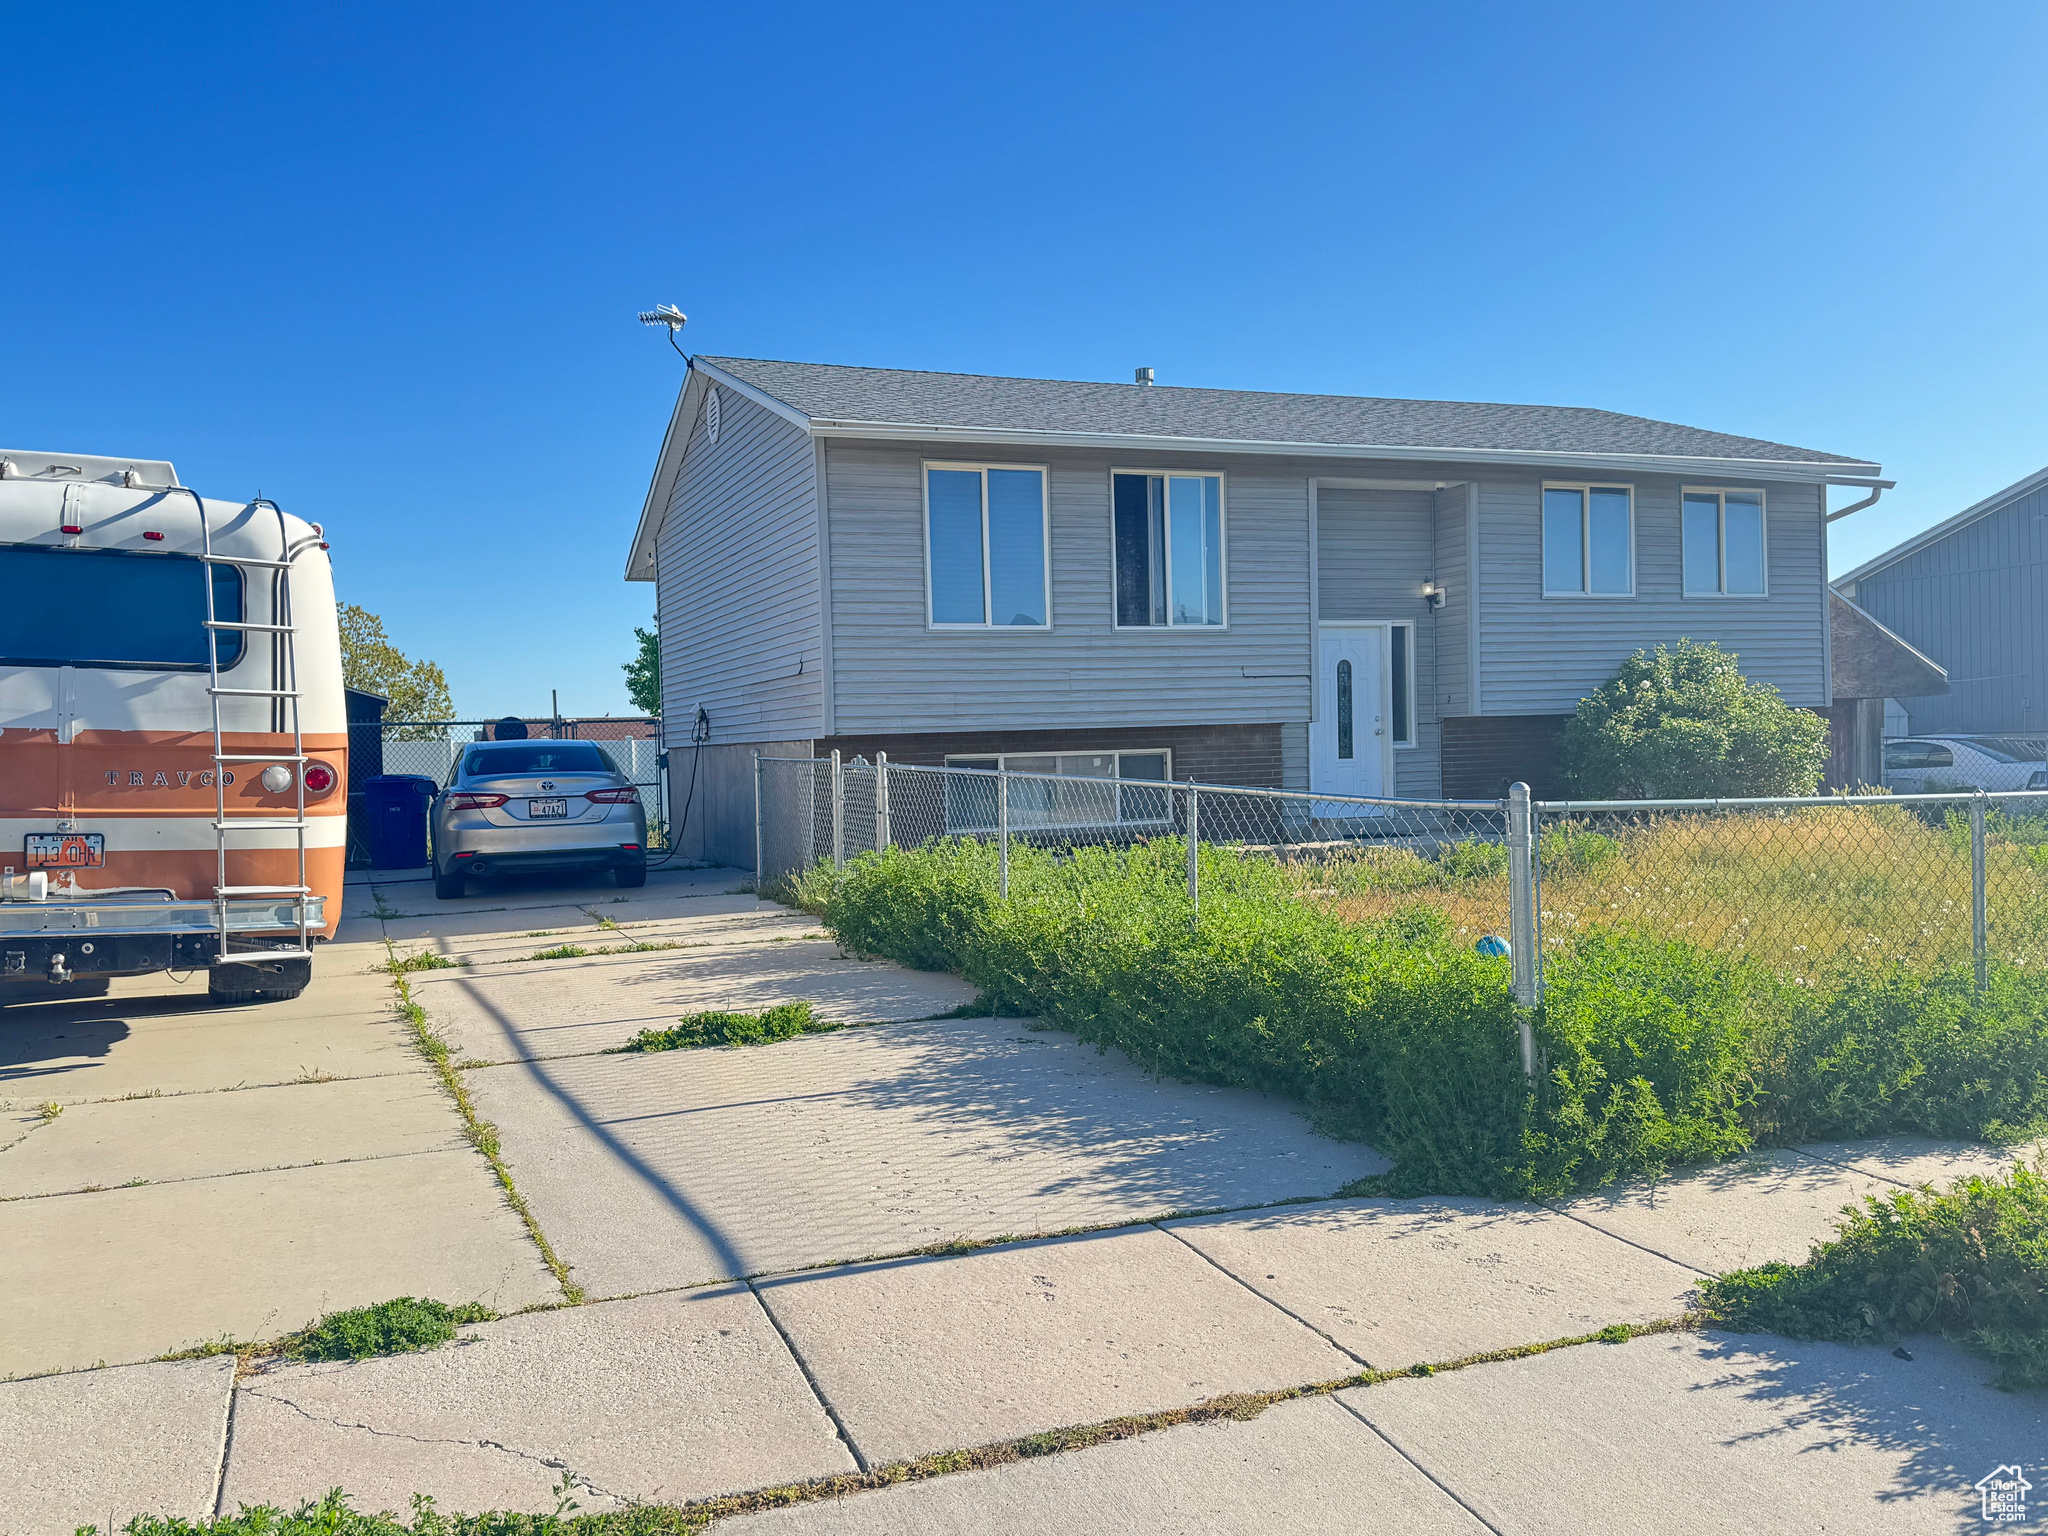
Active
$415,000
4
bds
|
2
ba
|
1,938
sqft
|
built
1976
5350 W 5150 S, Salt Lake City, UT 84118
$-814
Cash flow
-10.2%
Cash-on-Cash Return
3.9%
Cap rate
0.6%
Rent to Value Ratio
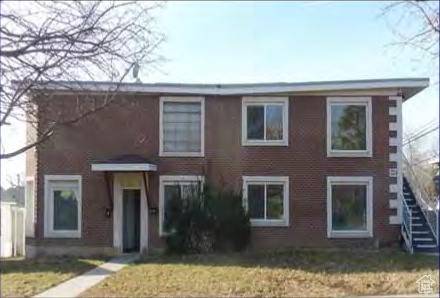
Active
$1,899,000
16
bds
|
8
ba
|
7,793
sqft
|
built
1900
228 E 900 S, Salt Lake City, UT 84111
$-8,435
Cash flow
-23.2%
Cash-on-Cash Return
1.0%
Cap rate
0.2%
Rent to Value Ratio
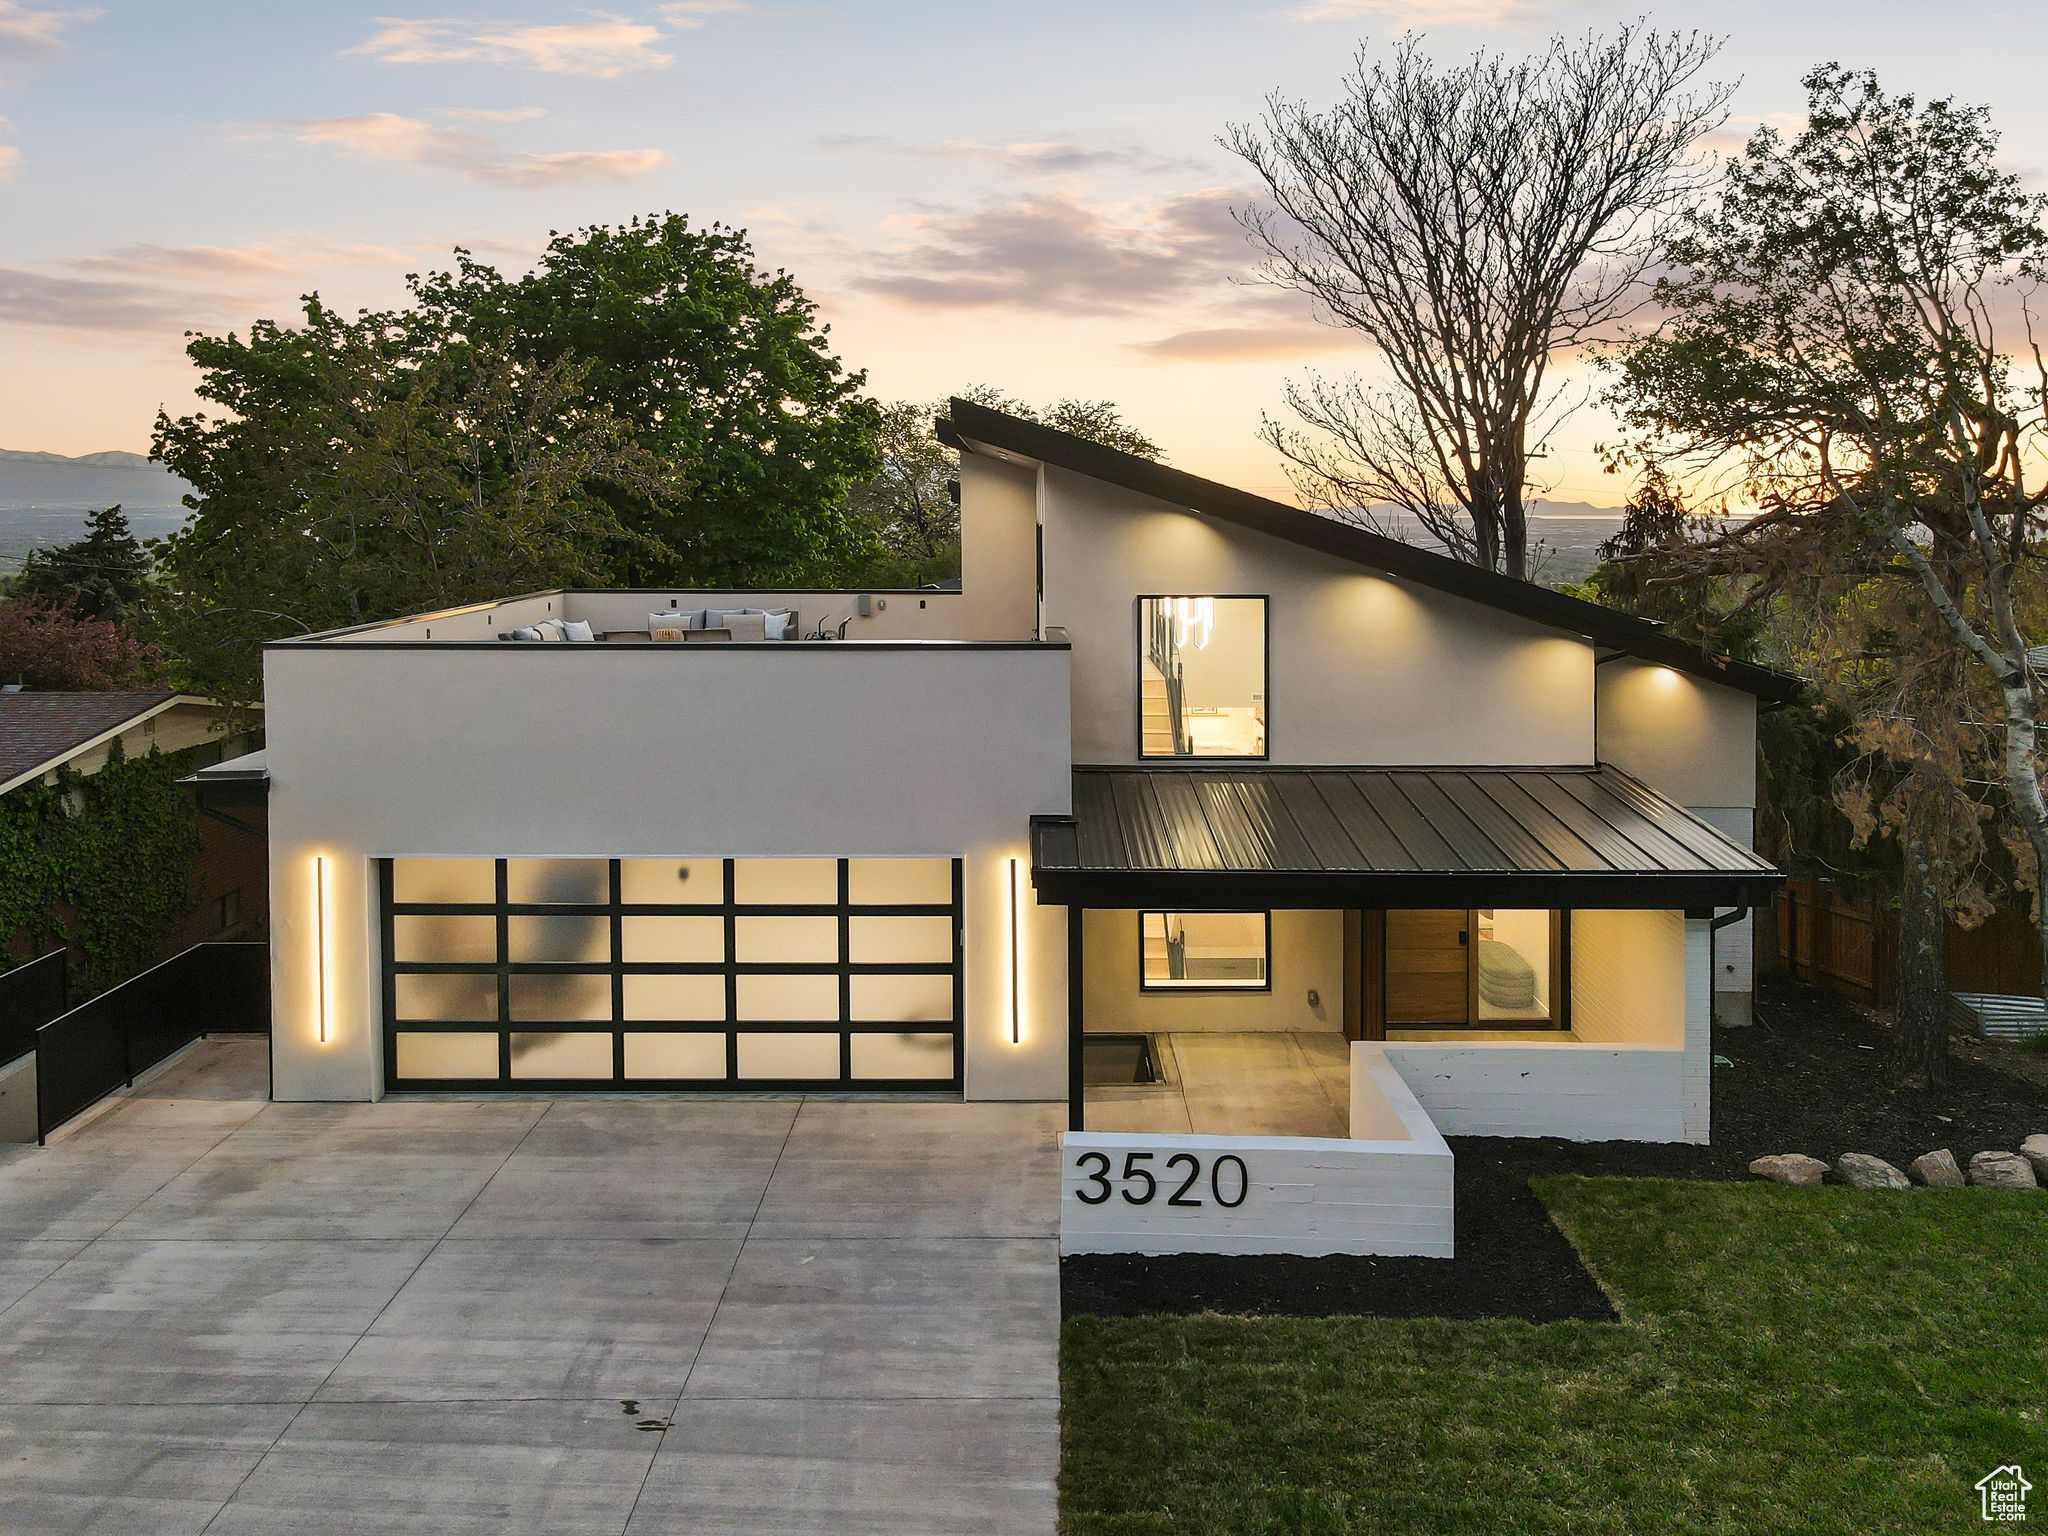
Active
$2,250,000
5
bds
|
7
ba
|
4,144
sqft
|
built
1958
3520 S Westwood Dr, Salt Lake City, UT 84109
$-9,949
Cash flow
-23.1%
Cash-on-Cash Return
1.0%
Cap rate
0.1%
Rent to Value Ratio
Active
$388,000
3
bds
|
2
ba
|
1,084
sqft
|
built
1951
1111 S Redwood Dr, Salt Lake City, UT 84104
$-998
Cash flow
-13.4%
Cash-on-Cash Return
3.2%
Cap rate
0.4%
Rent to Value Ratio
Active
$599,000
3
bds
|
2
ba
|
1,795
sqft
|
built
1920
1923 S 600 E, Salt Lake City, UT 84105
$-1,197
Cash flow
-10.4%
Cash-on-Cash Return
3.9%
Cap rate
0.5%
Rent to Value Ratio
Active under contract
$499,000
1
bds
|
1
ba
|
759
sqft
|
built
2011
35 E 100 S, Salt Lake City, UT 84111
$-1,803
Cash flow
-18.9%
Cash-on-Cash Return
1.9%
Cap rate
0.4%
Rent to Value Ratio
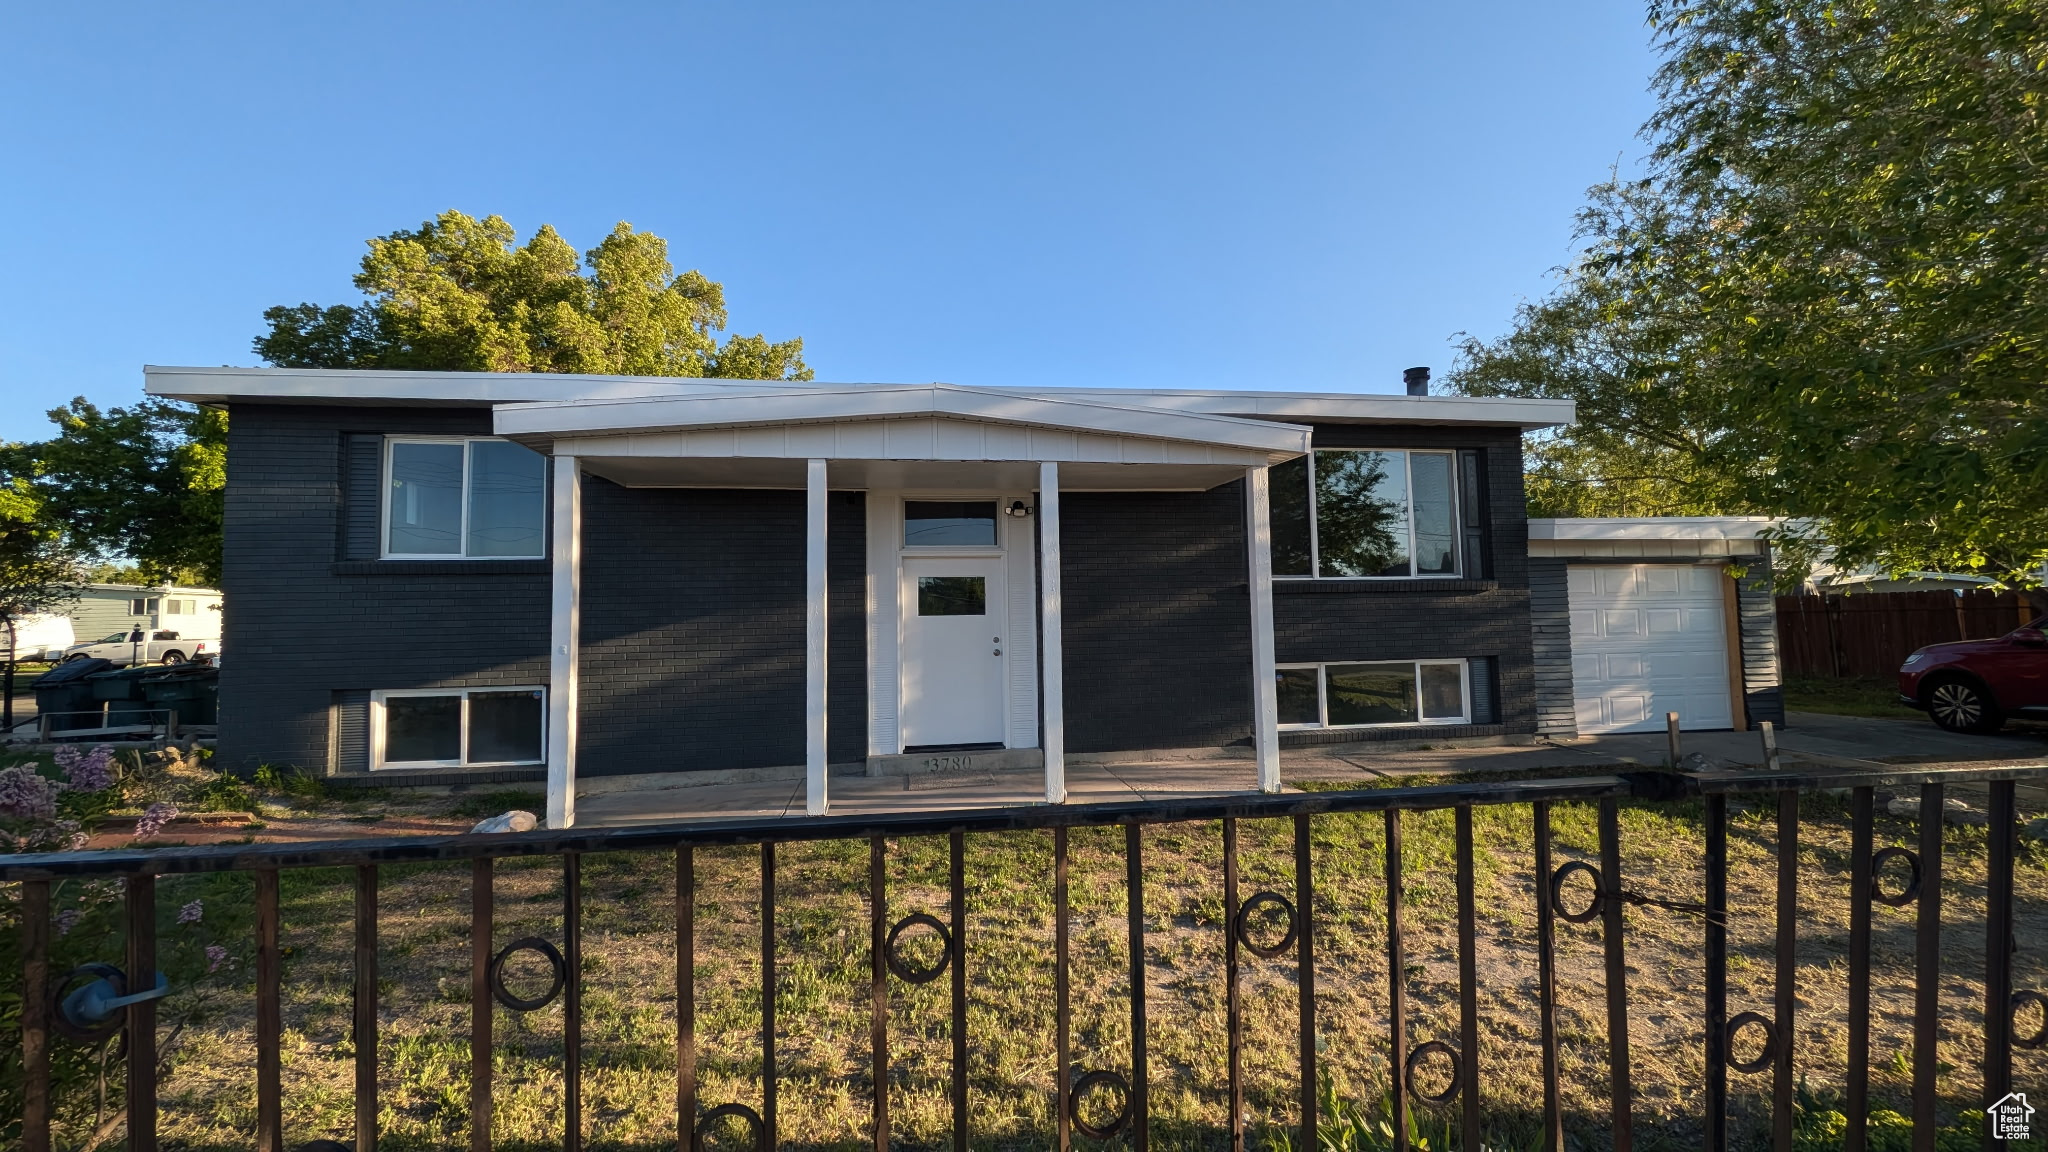
Active
$525,000
6
bds
|
3
ba
|
2,224
sqft
|
built
1964
3112 S 3780 W, Salt Lake City, UT 84120
$-1,404
Cash flow
-14.0%
Cash-on-Cash Return
3.1%
Cap rate
0.4%
Rent to Value Ratio
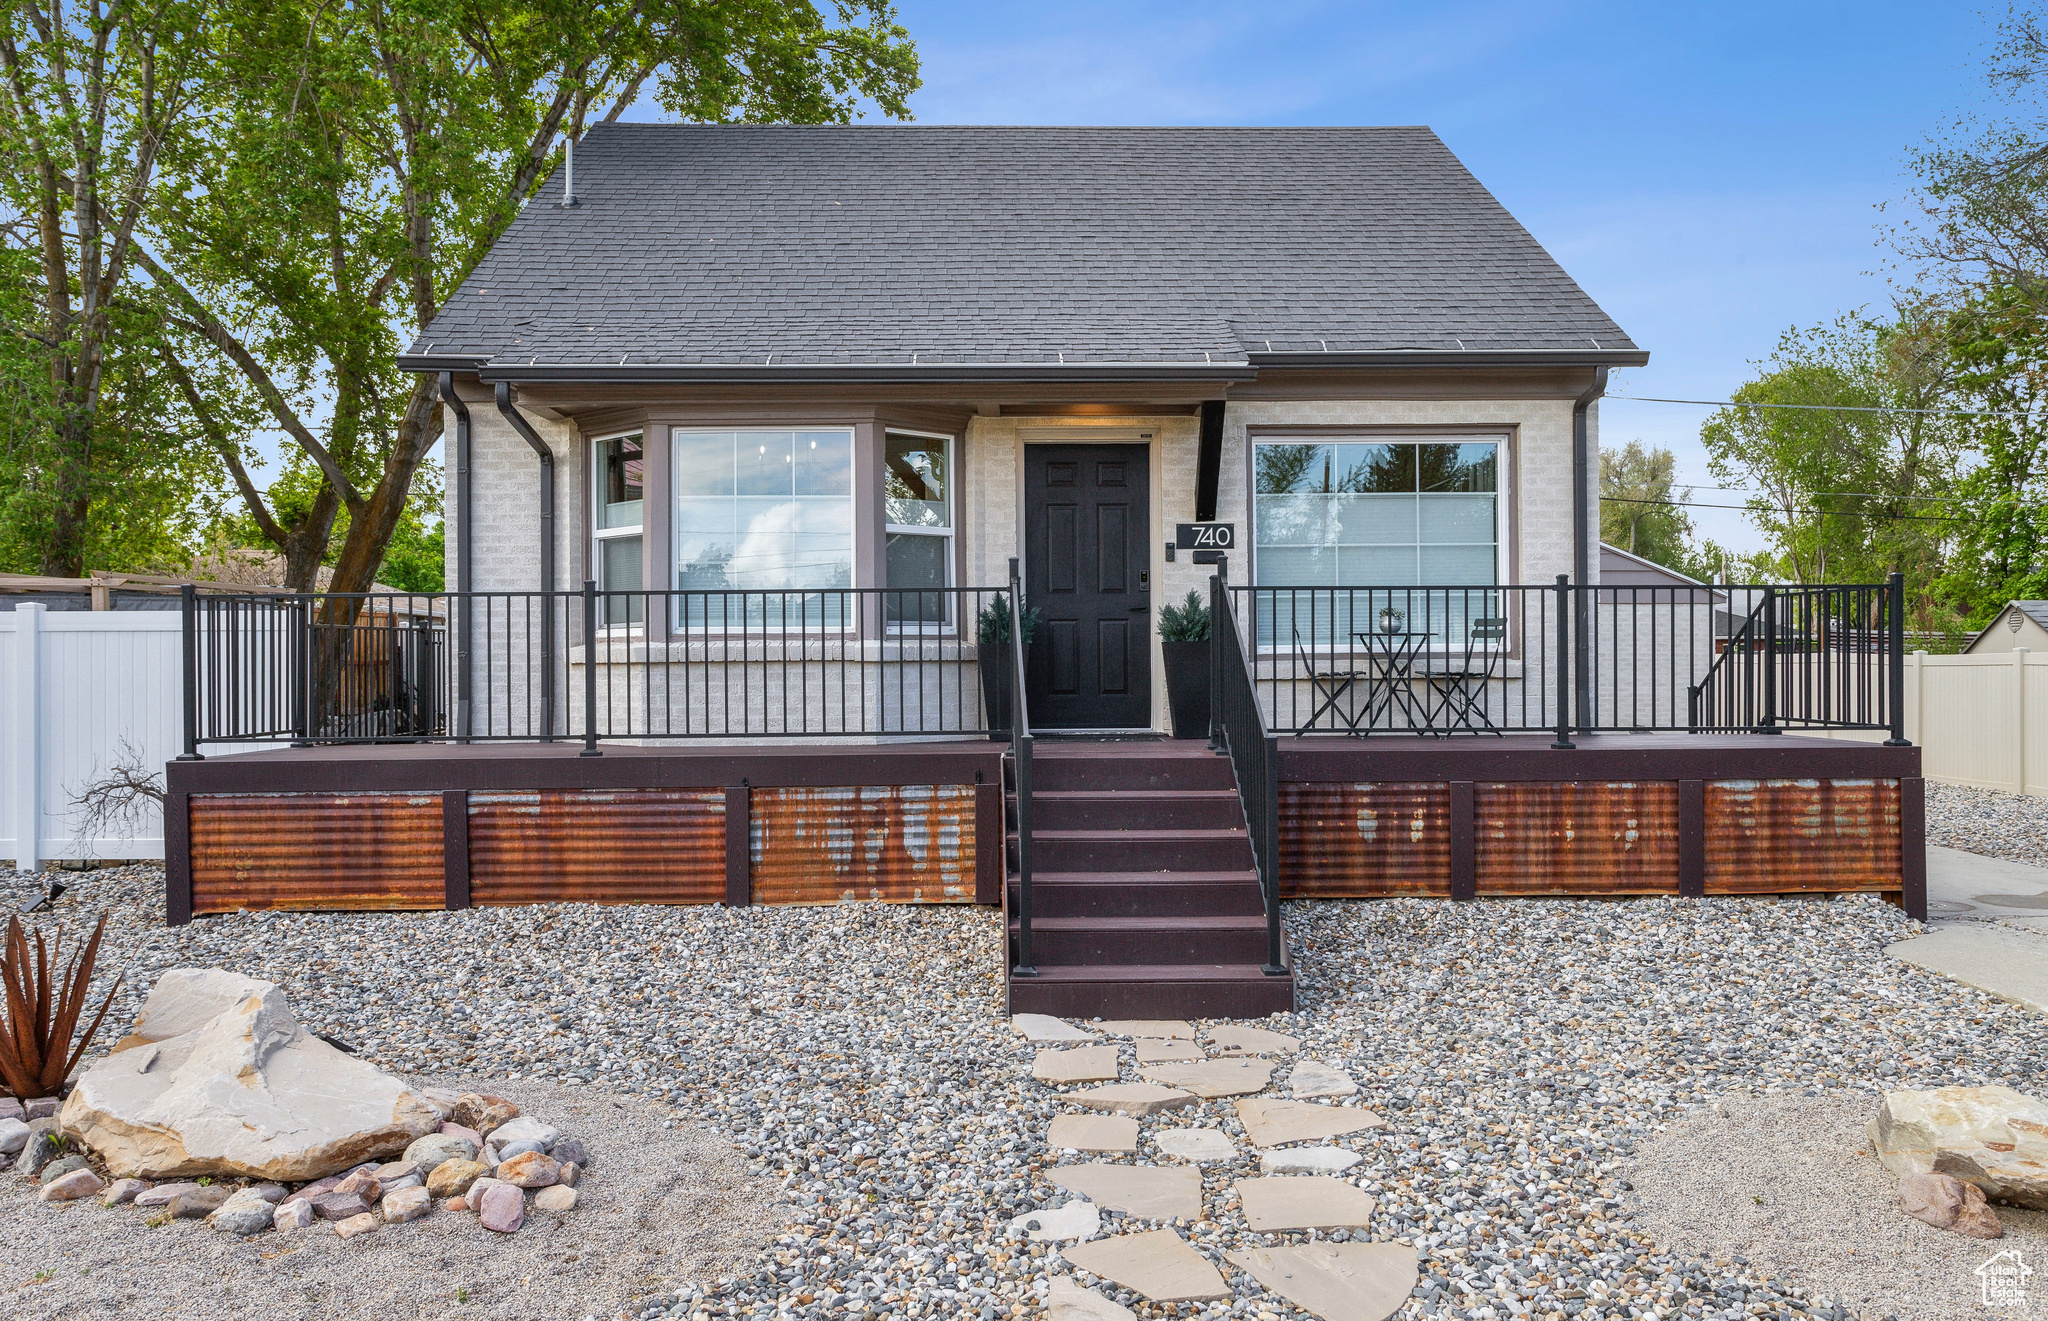
Active
$714,900
4
bds
|
2
ba
|
1,938
sqft
|
built
1952
740 E Barrows Ave, Salt Lake City, UT 84106
$-2,035
Cash flow
-14.9%
Cash-on-Cash Return
2.9%
Cap rate
0.4%
Rent to Value Ratio
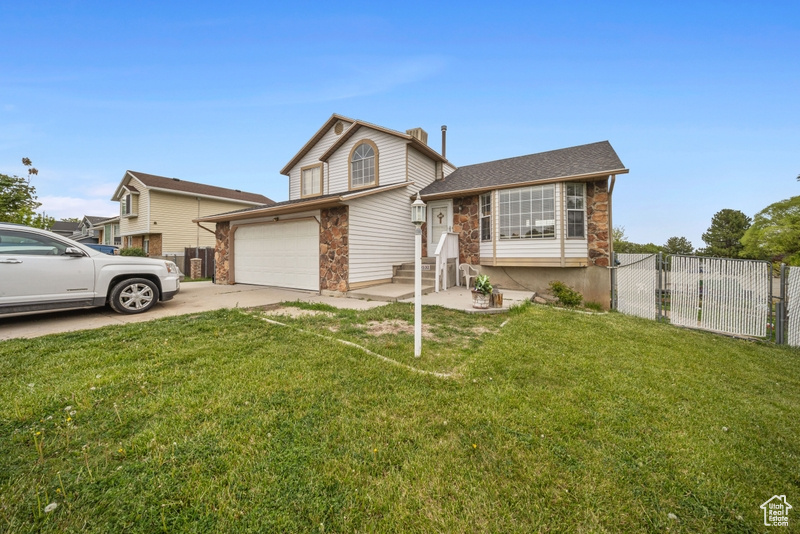
Active
$530,000
4
bds
|
3
ba
|
1,893
sqft
|
built
1991
4532 W 4065 S, Salt Lake City, UT 84120
$-1,502
Cash flow
-14.8%
Cash-on-Cash Return
2.9%
Cap rate
0.4%
Rent to Value Ratio
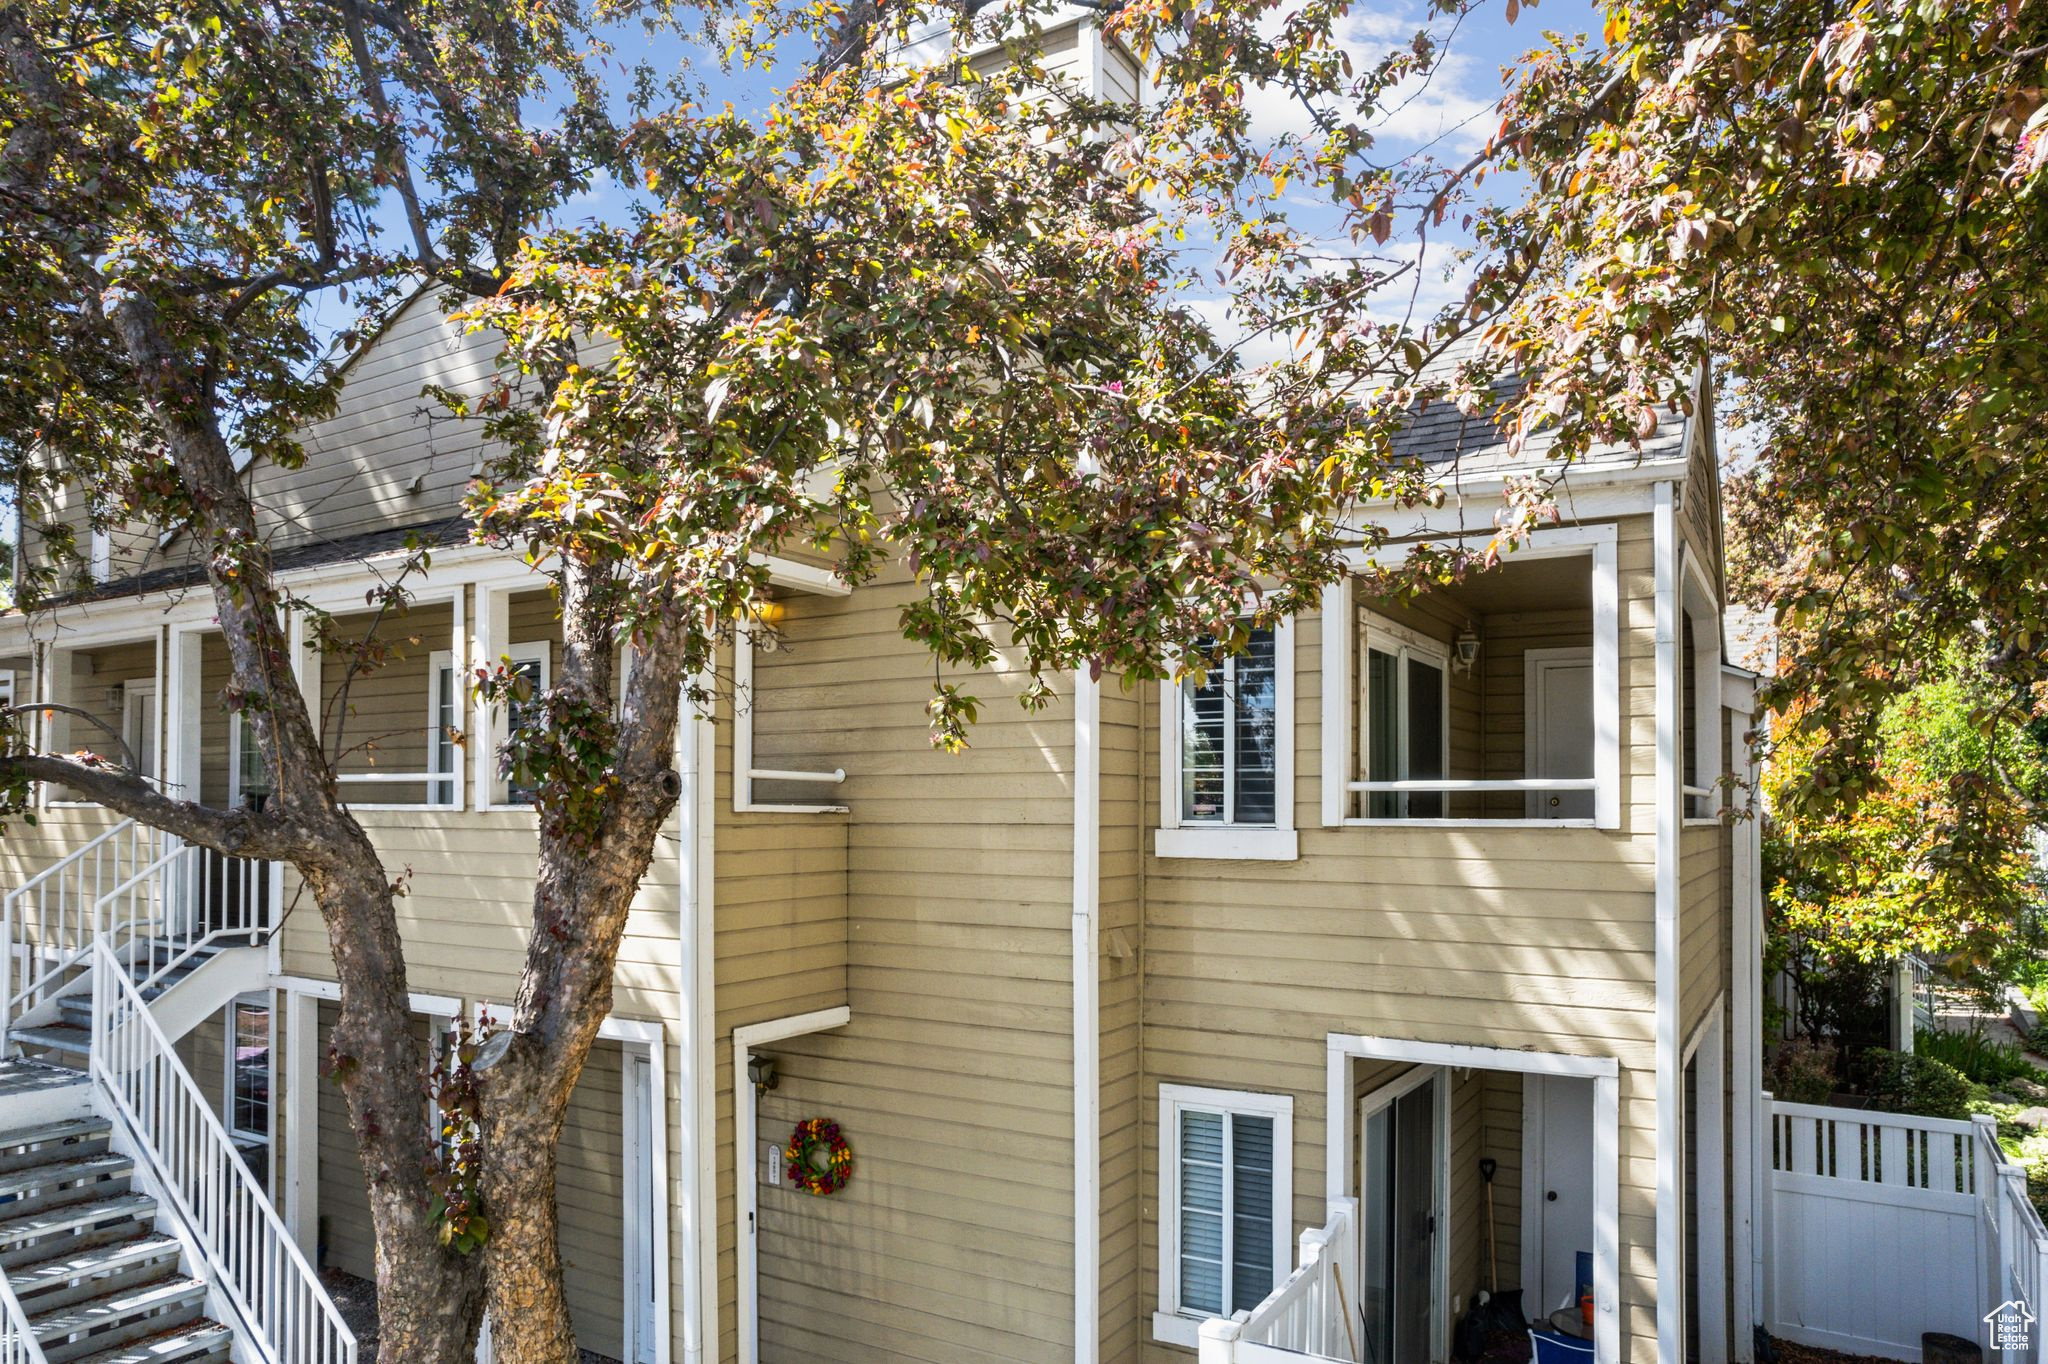
Pending
$312,000
2
bds
|
2
ba
|
942
sqft
|
built
1985
1480 E Foxboro Dr, Salt Lake City, UT 84106
$-1,059
Cash flow
-17.7%
Cash-on-Cash Return
2.2%
Cap rate
0.5%
Rent to Value Ratio
Active
$939,000
4
bds
|
3
ba
|
2,705
sqft
|
built
1951
3133 S 2700 E, Salt Lake City, UT 84109
$-3,834
Cash flow
-21.3%
Cash-on-Cash Return
1.4%
Cap rate
0.2%
Rent to Value Ratio
Active
$649,900
3
bds
|
2
ba
|
2,149
sqft
|
built
1924
1979 S 600 E, Salt Lake City, UT 84105
$-1,933
Cash flow
-15.5%
Cash-on-Cash Return
2.7%
Cap rate
0.4%
Rent to Value Ratio
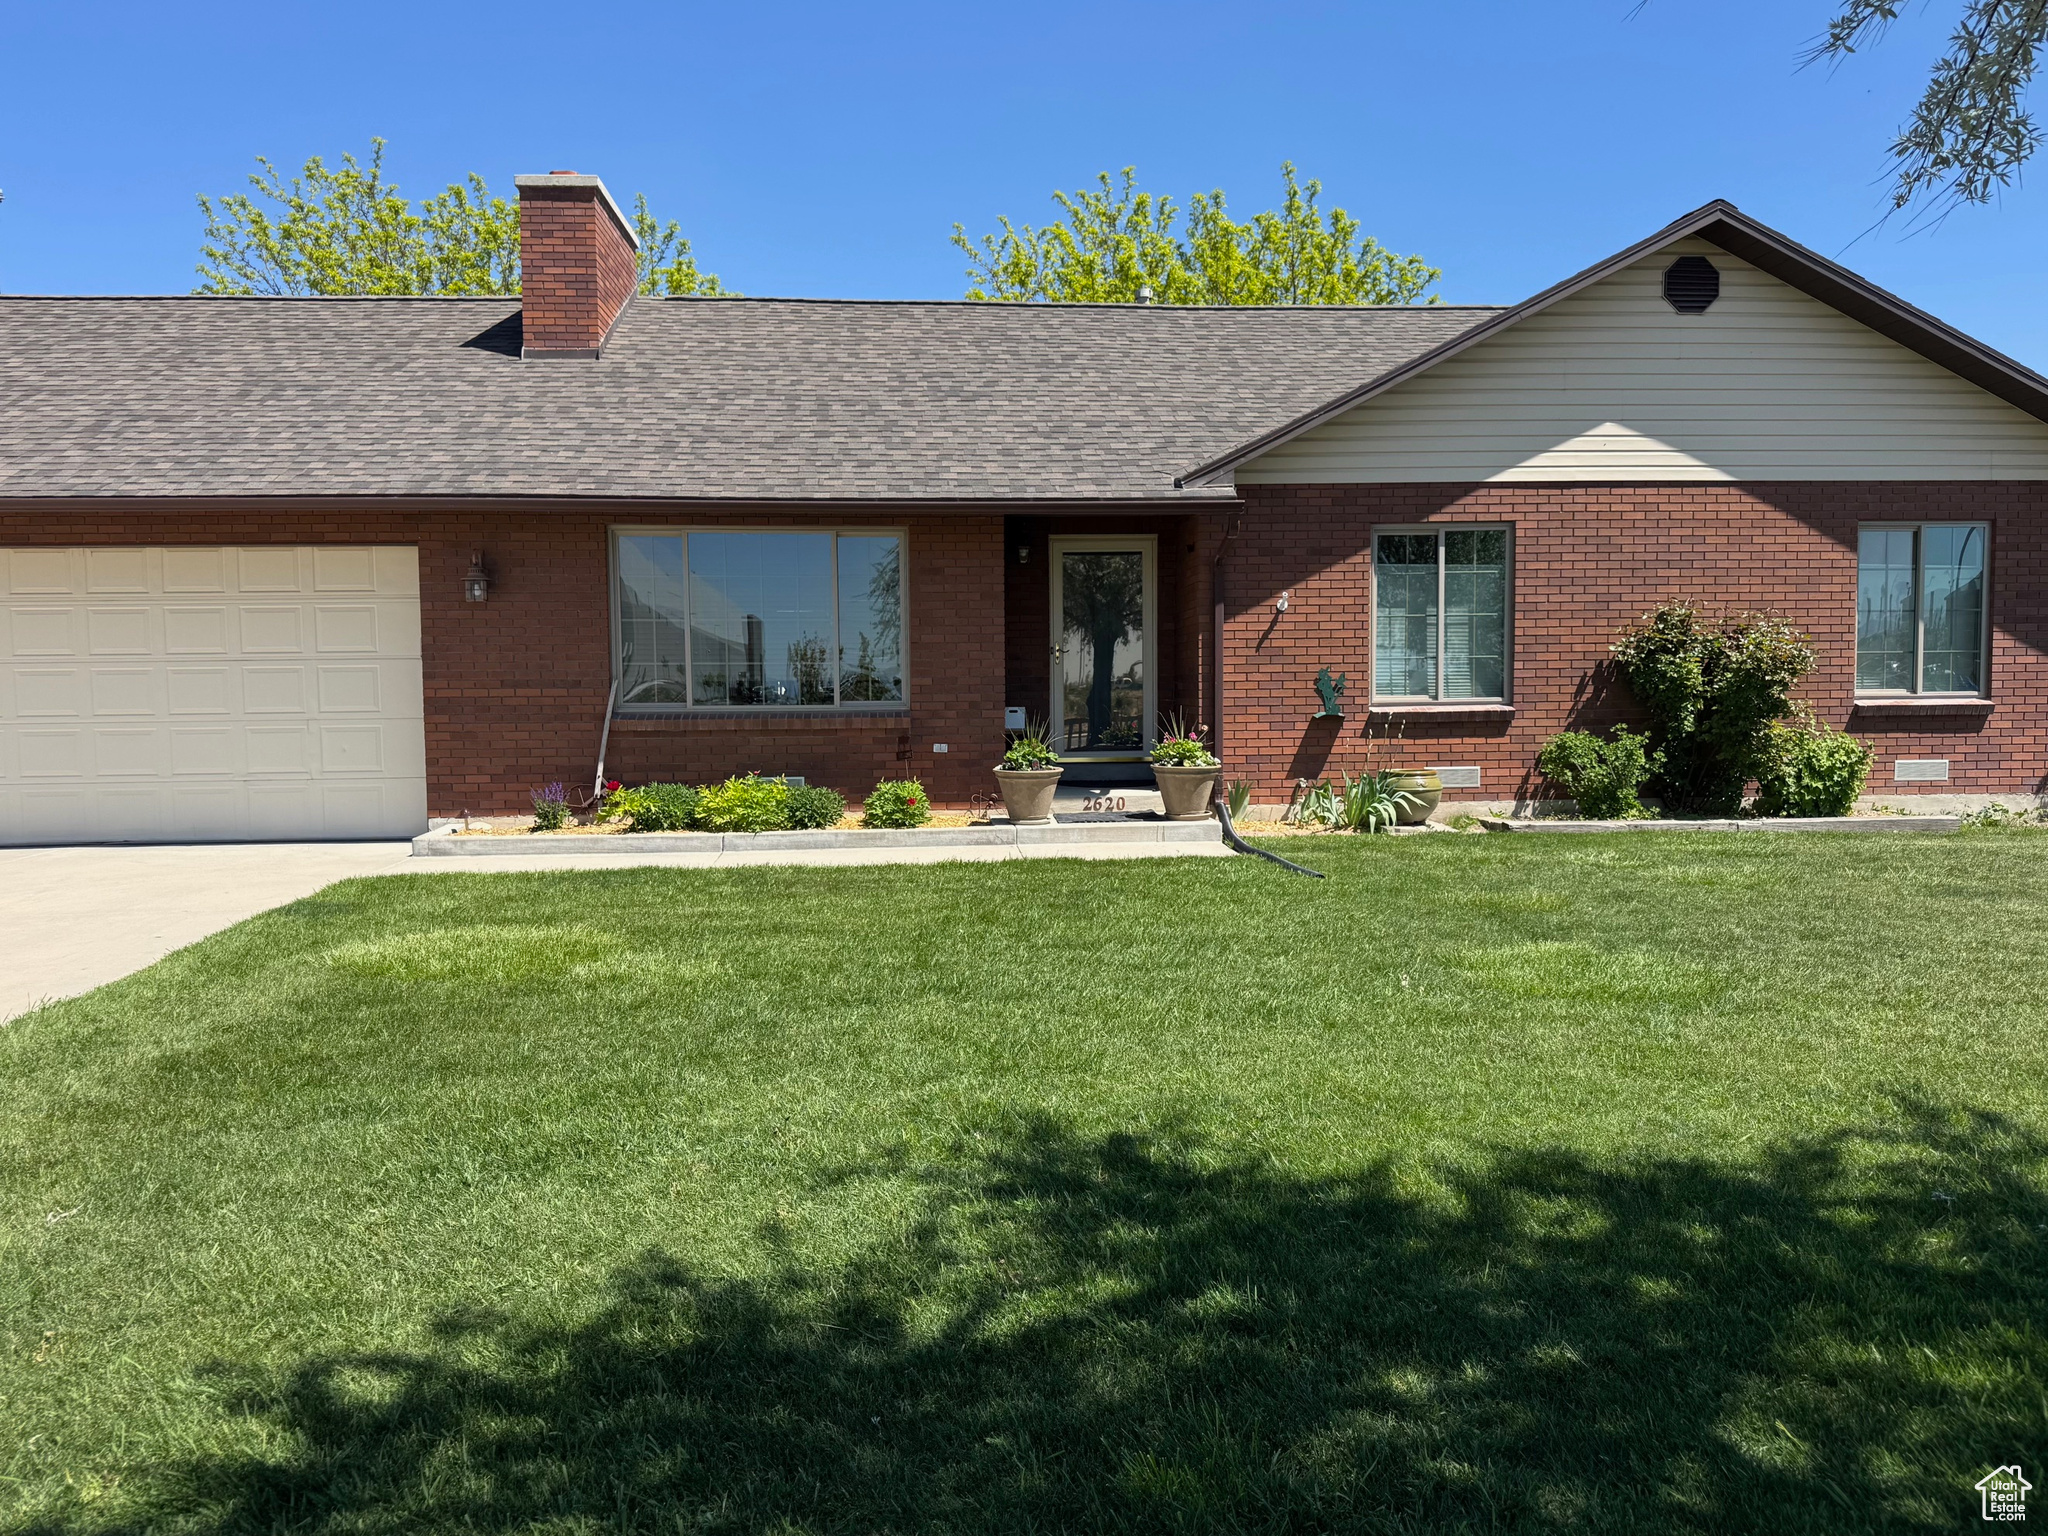
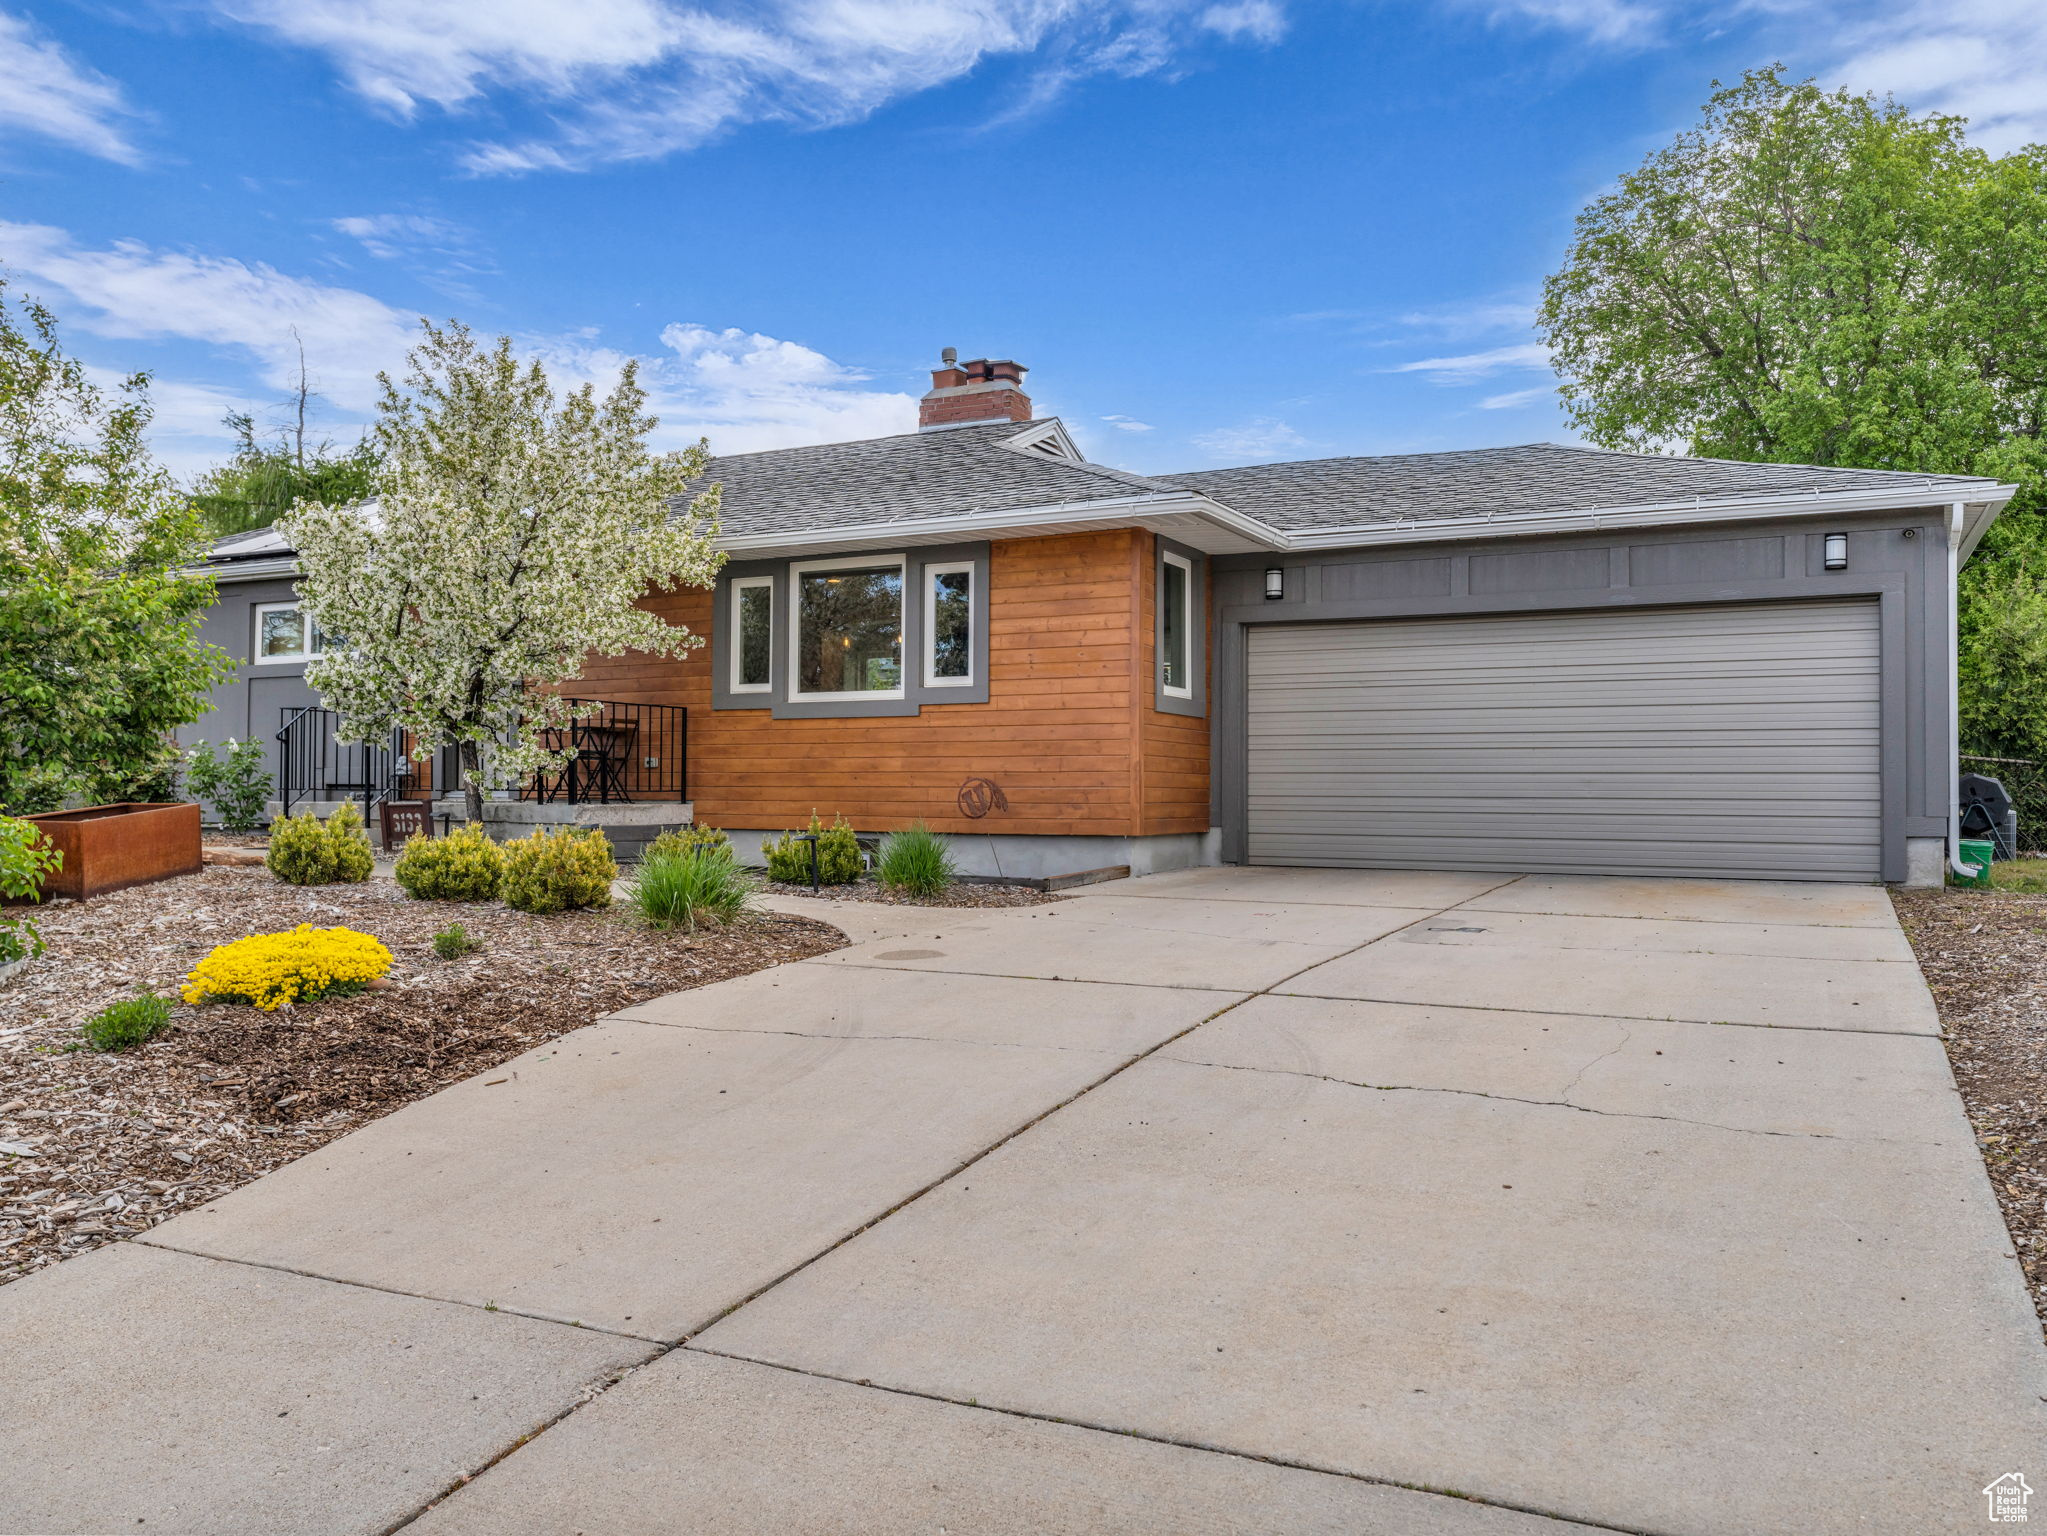
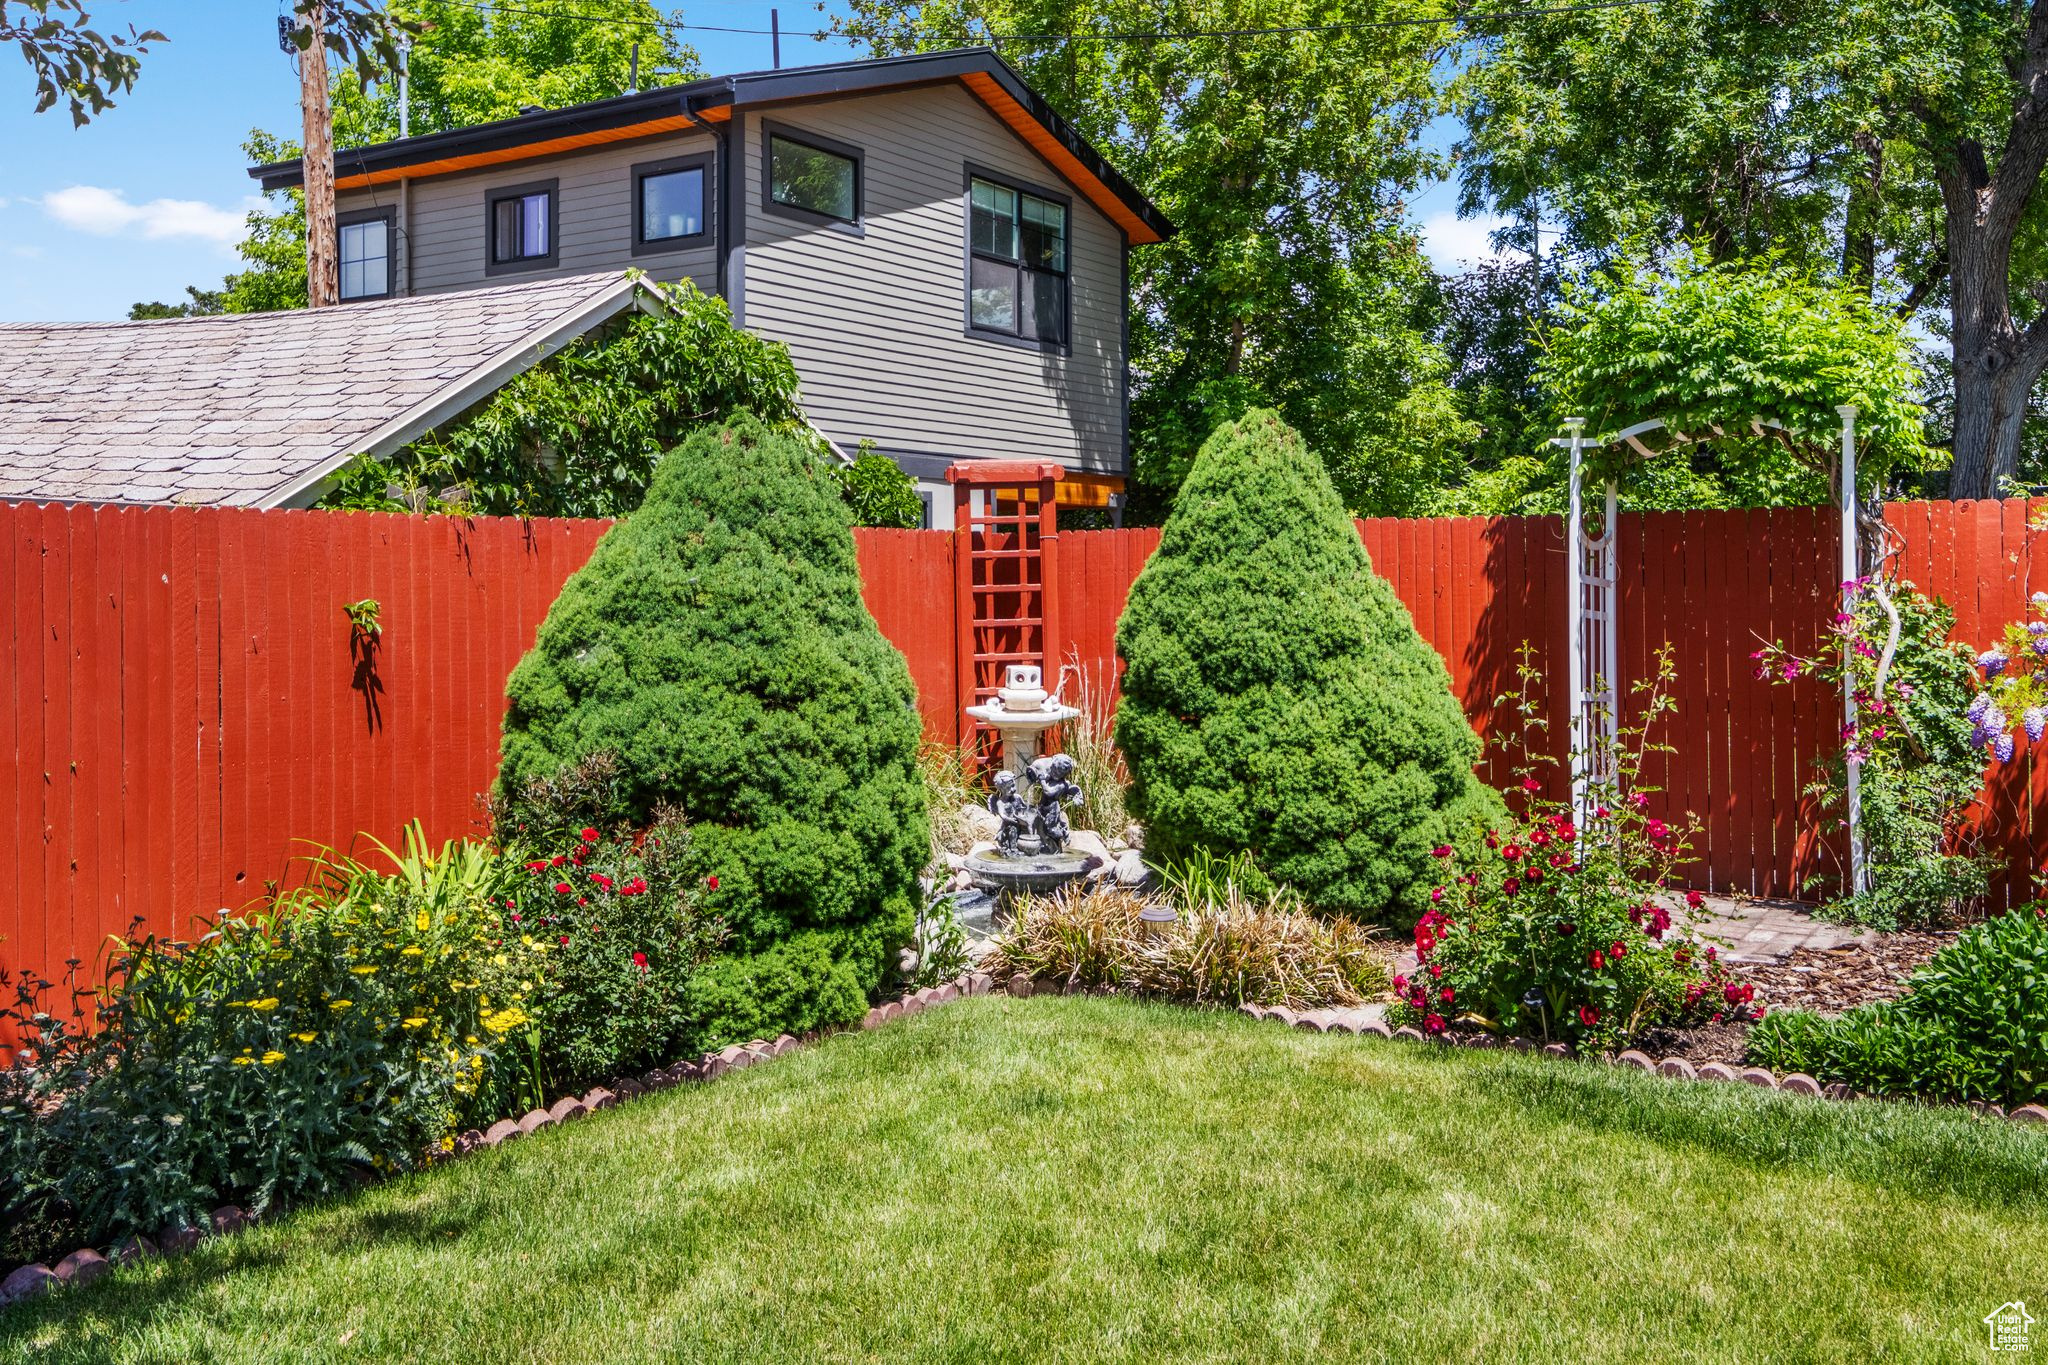
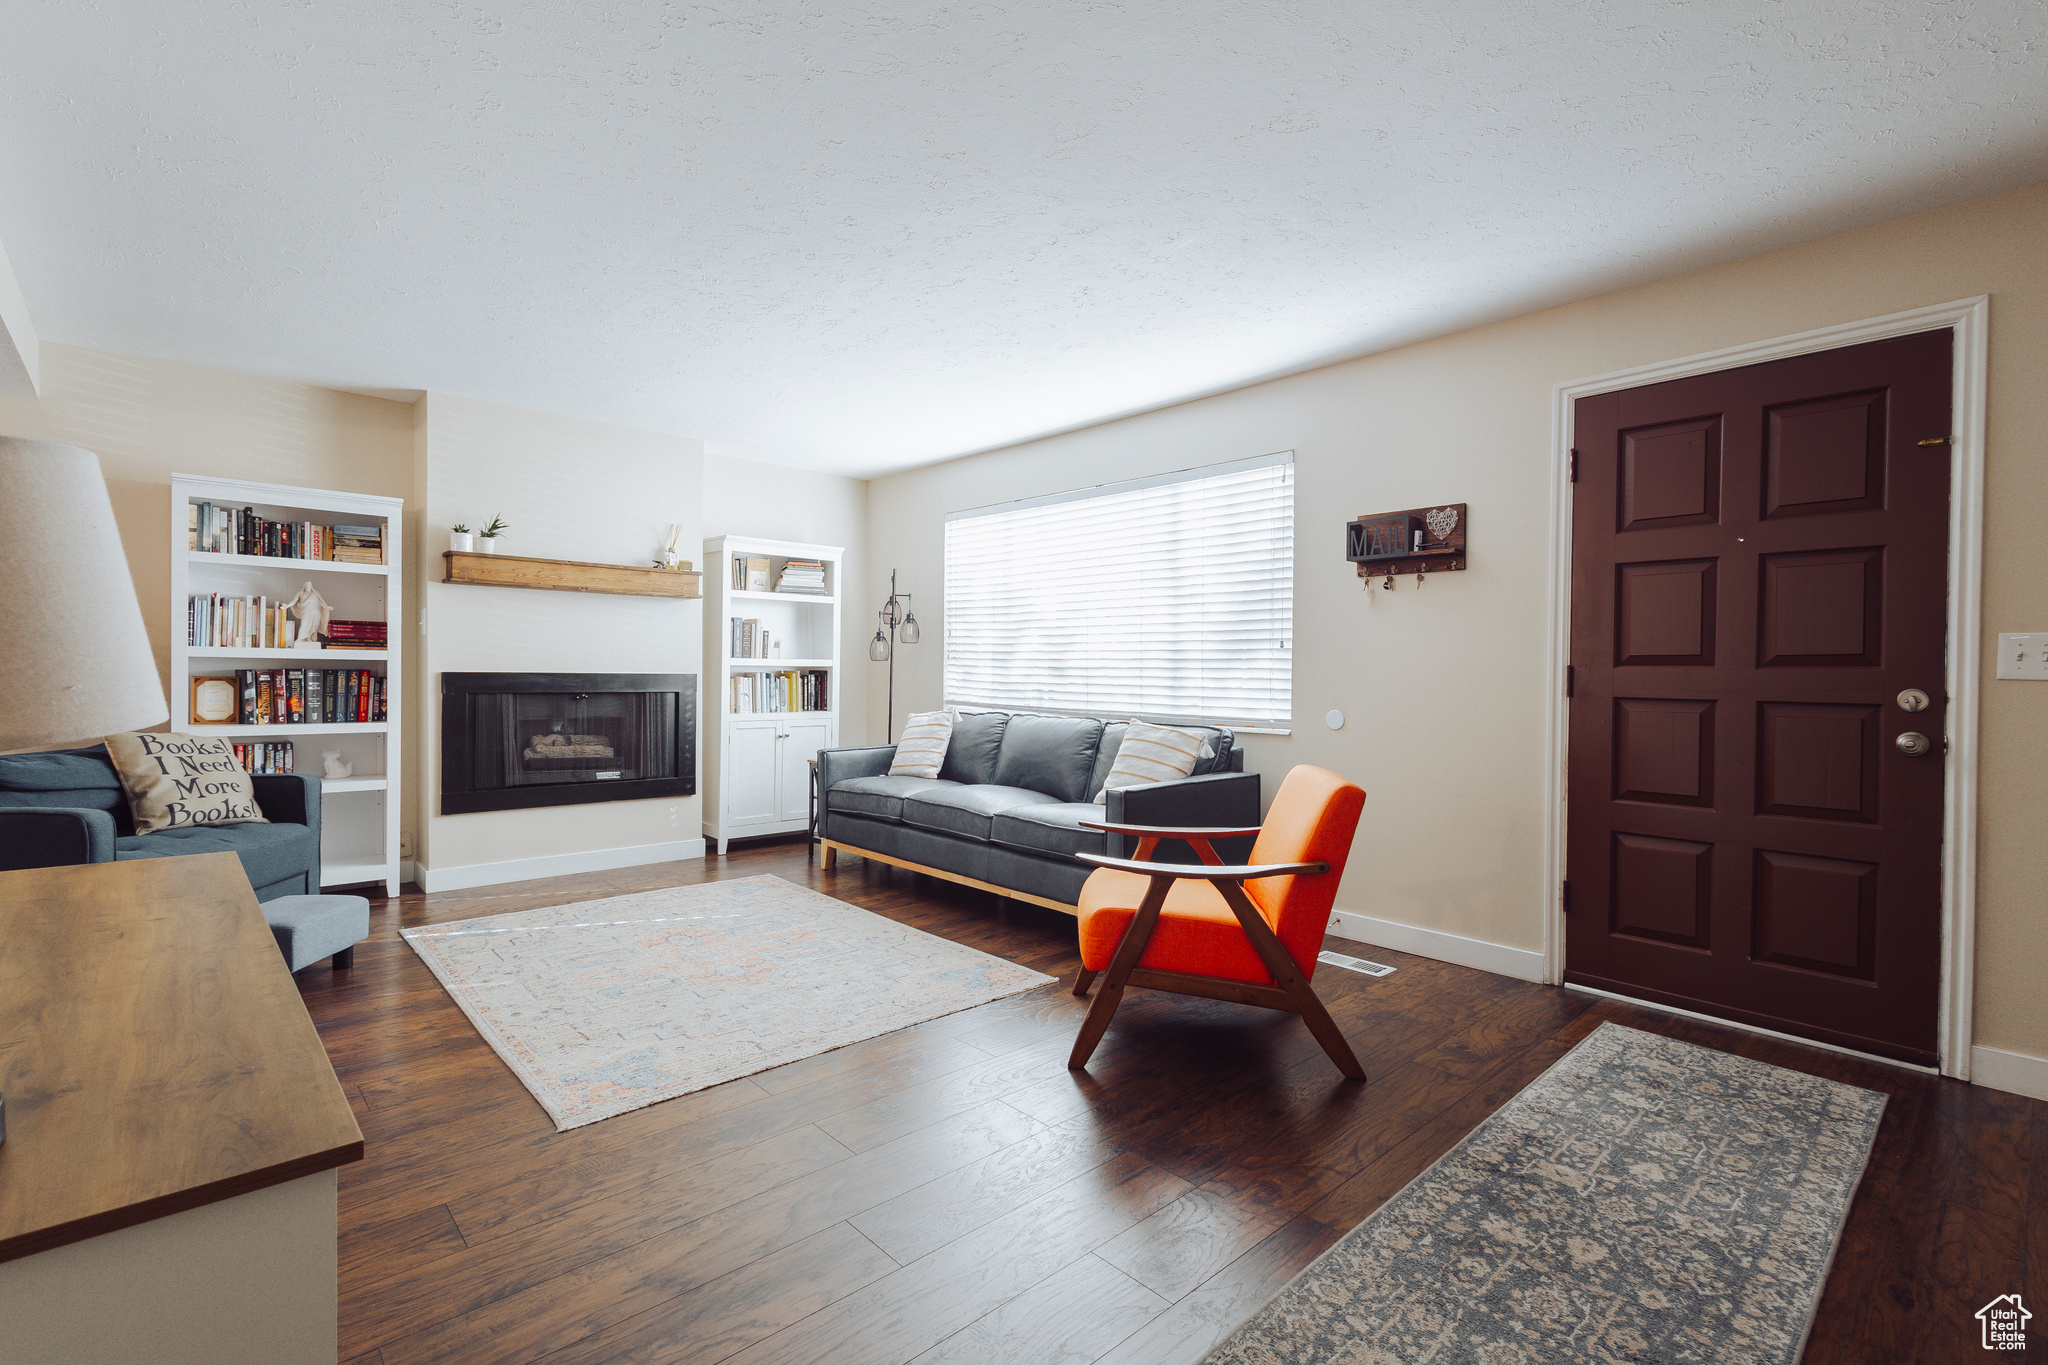
Active
$2,000,000
3
bds
|
2
ba
|
1,860
sqft
|
built
1992
2620 N 2200 W, Salt Lake City, UT 84116
$-9,246
Cash flow
-24.1%
Cash-on-Cash Return
0.7%
Cap rate
0.1%
Rent to Value Ratio
Active
$462,995
3
bds
|
4
ba
|
2,040
sqft
|
built
1980
3655 S 1300 E, Salt Lake City, UT 84106
$-1,507
Cash flow
-17.0%
Cash-on-Cash Return
2.4%
Cap rate
0.5%
Rent to Value Ratio
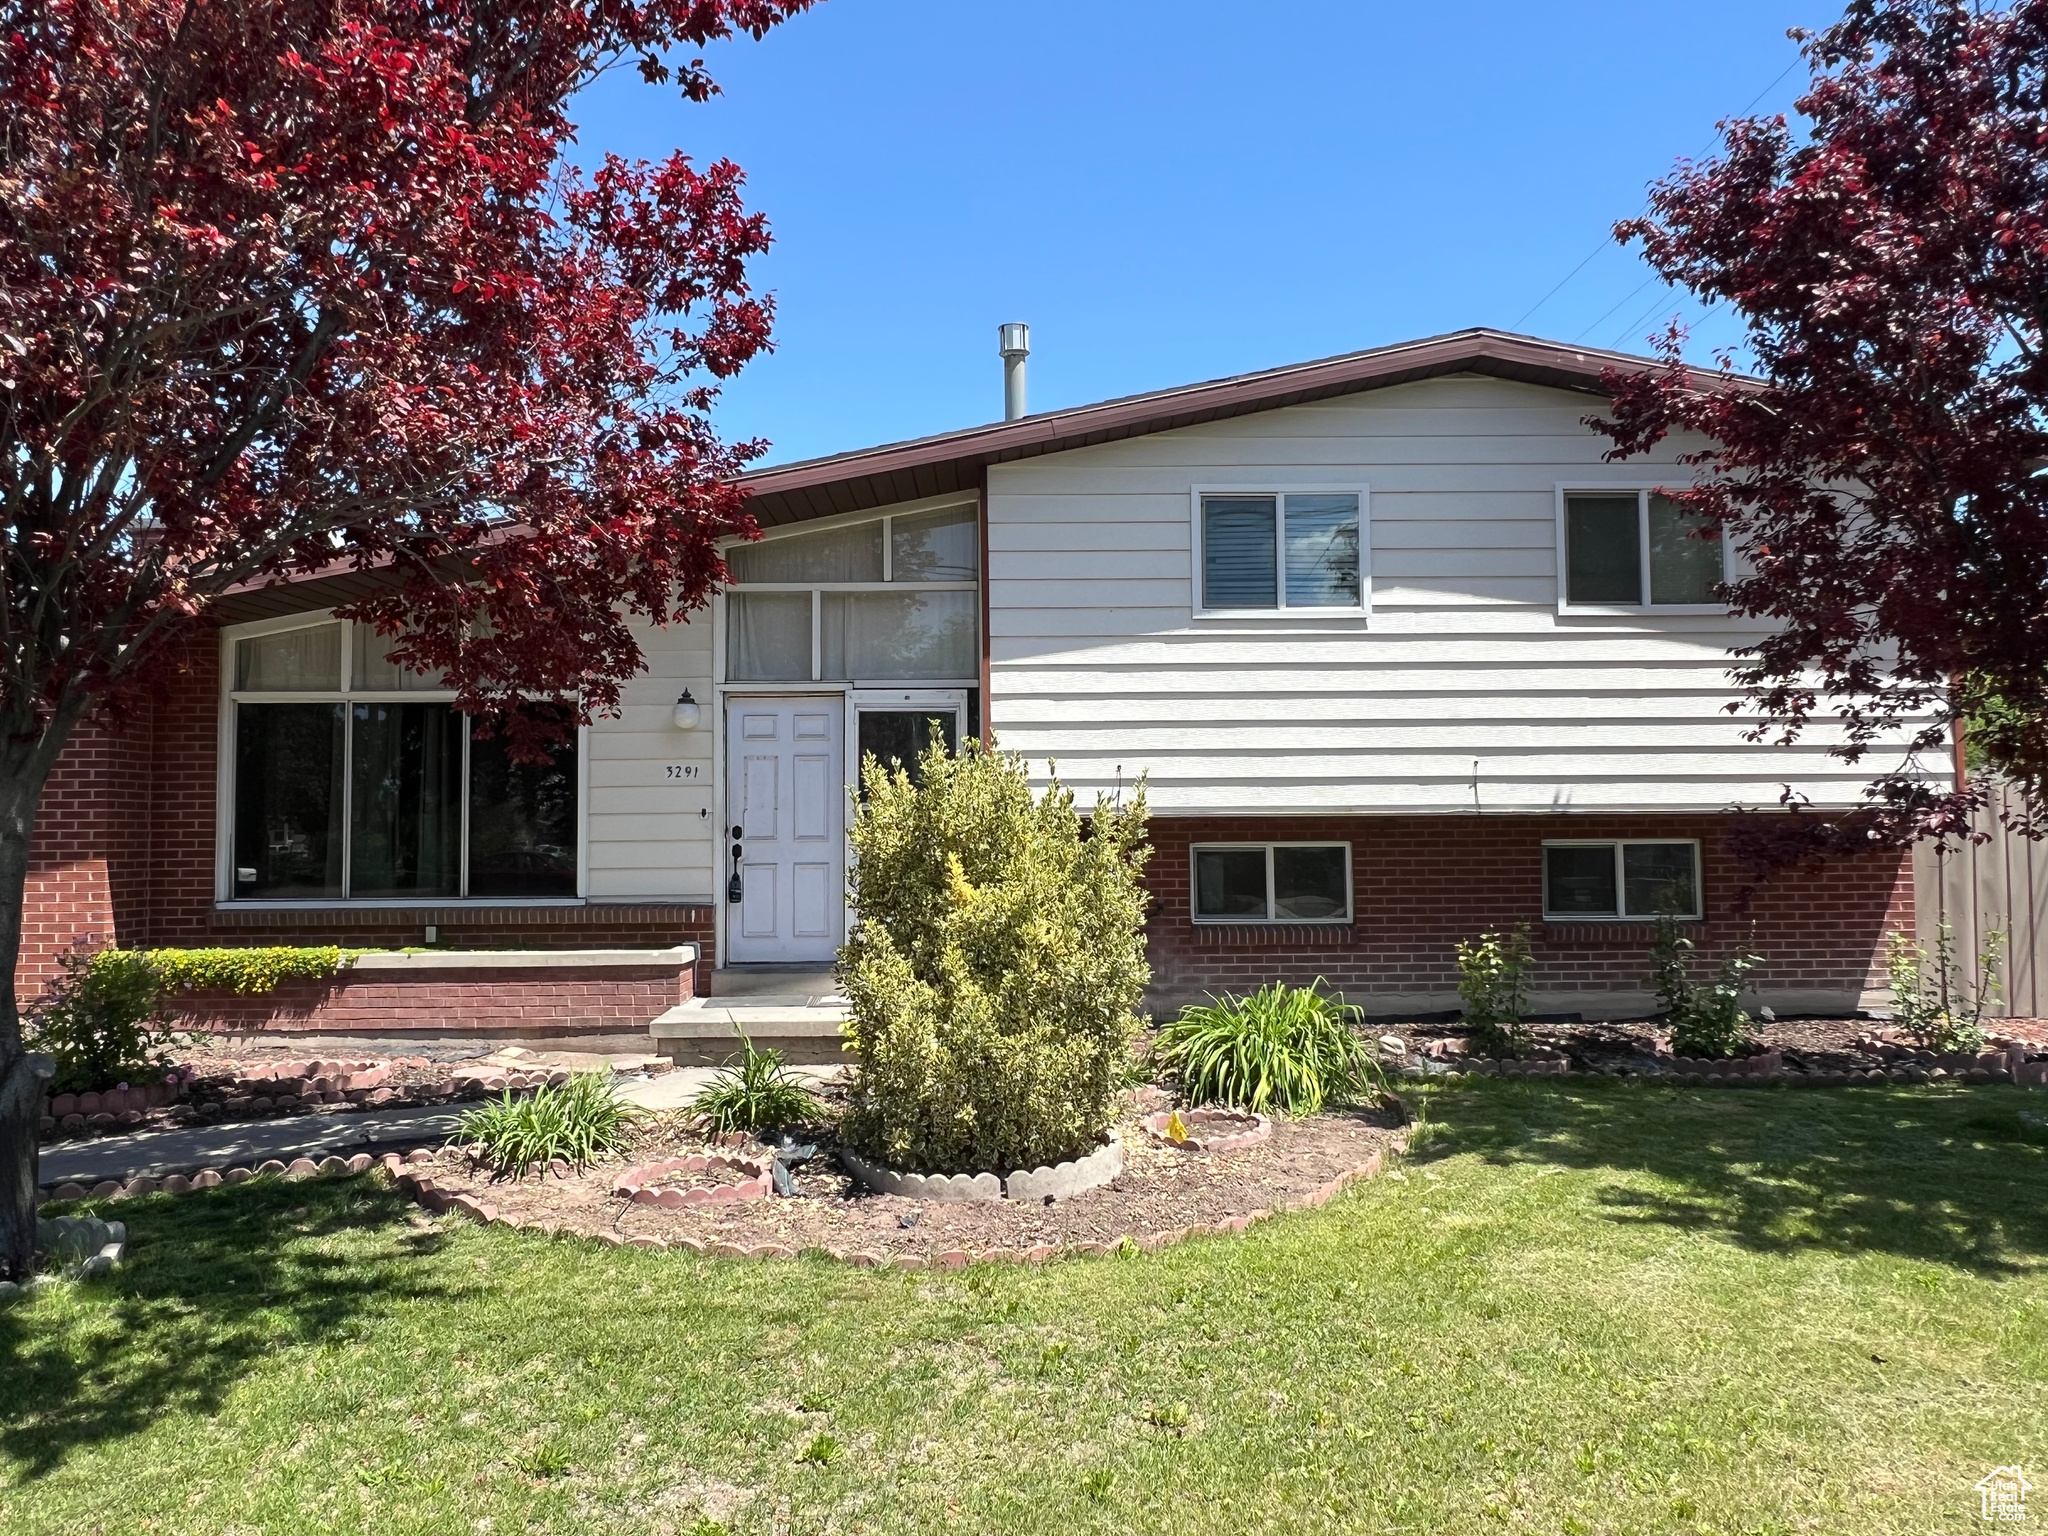
Active
$459,900
6
bds
|
3
ba
|
2,557
sqft
|
built
1960
3291 S 4000 W, Salt Lake City, UT 84120
$-898
Cash flow
-10.2%
Cash-on-Cash Return
3.9%
Cap rate
0.5%
Rent to Value Ratio
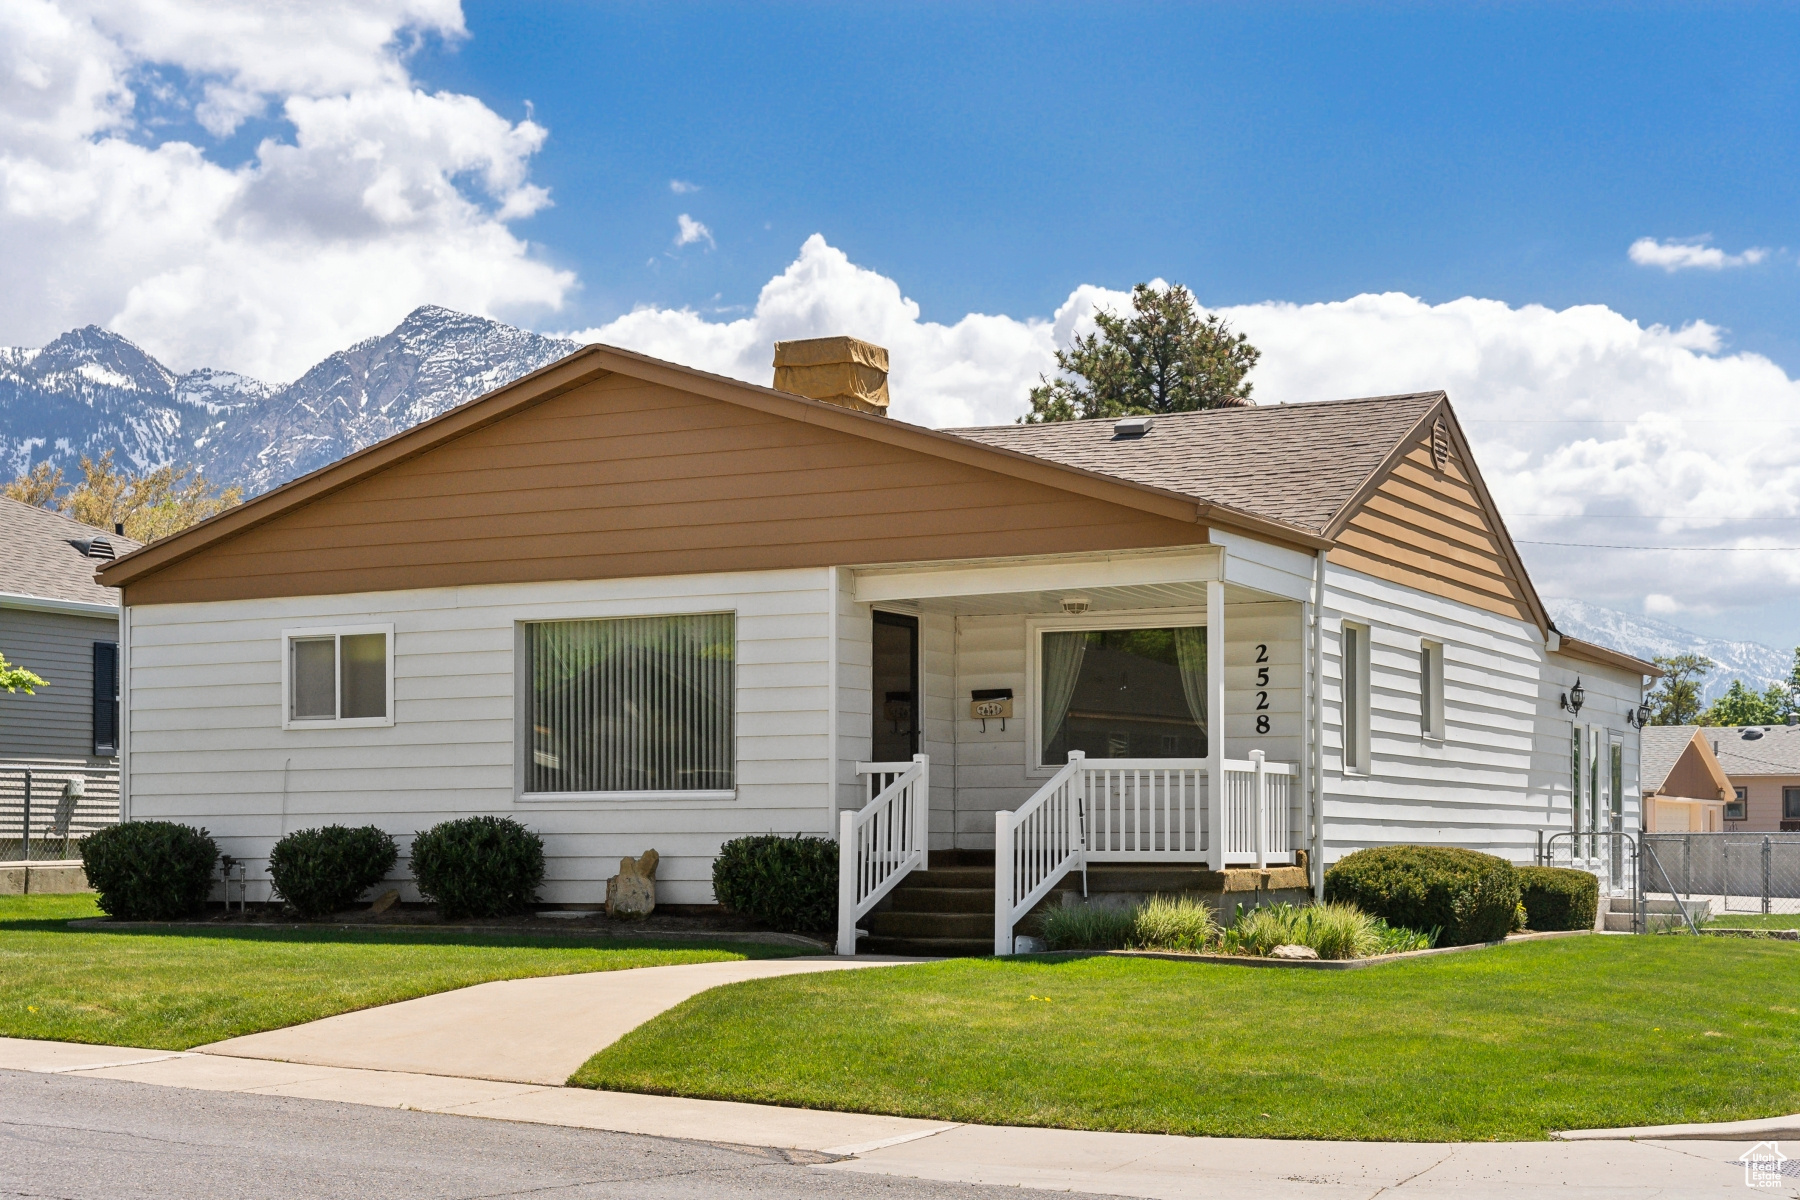
Active
$595,000
3
bds
|
2
ba
|
1,960
sqft
|
built
1948
2528 E 2980 S, Salt Lake City, UT 84109
$-1,471
Cash flow
-12.9%
Cash-on-Cash Return
3.3%
Cap rate
0.5%
Rent to Value Ratio
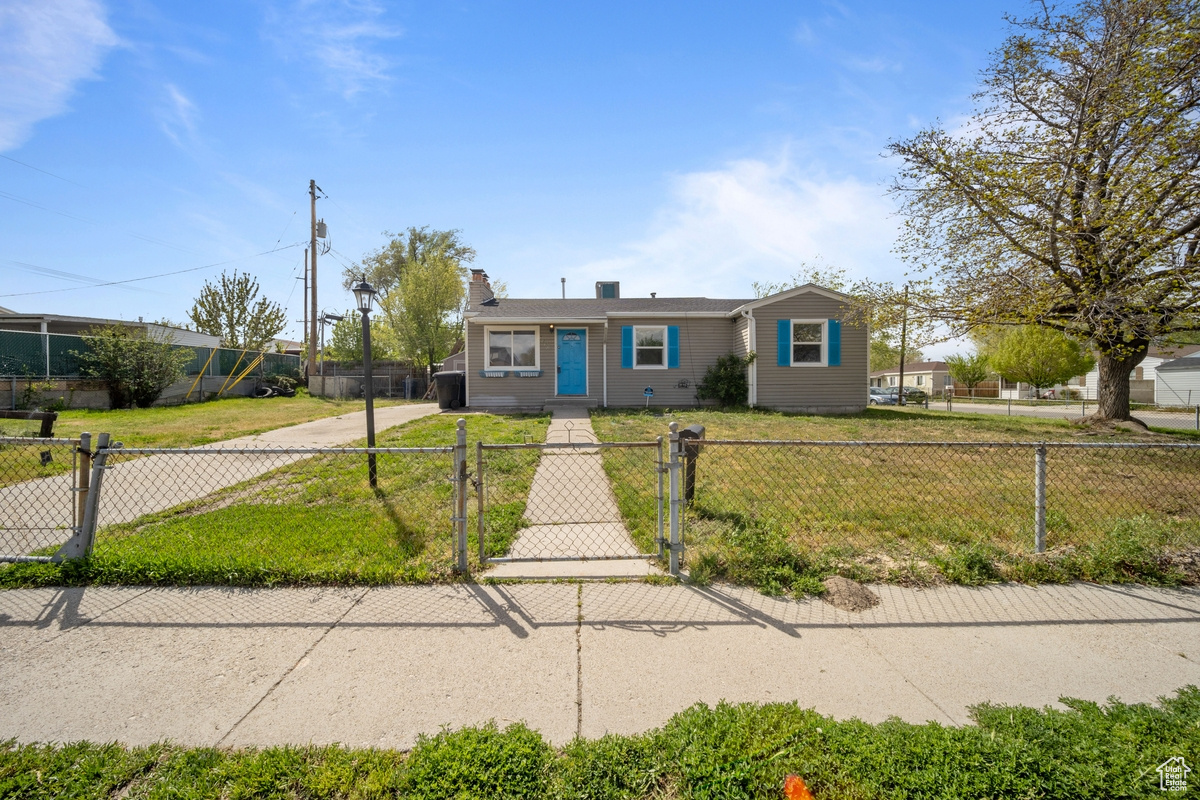
Active
$375,000
3
bds
|
1
ba
|
1,002
sqft
|
built
1956
5390 S 4460 W, Salt Lake City, UT 84118
$-1,143
Cash flow
-15.9%
Cash-on-Cash Return
2.6%
Cap rate
0.4%
Rent to Value Ratio
Active
$239,000
1
bds
|
1
ba
|
533
sqft
|
built
1951
130 S 1300 E, Salt Lake City, UT 84102
$-810
Cash flow
-17.7%
Cash-on-Cash Return
2.2%
Cap rate
0.5%
Rent to Value Ratio
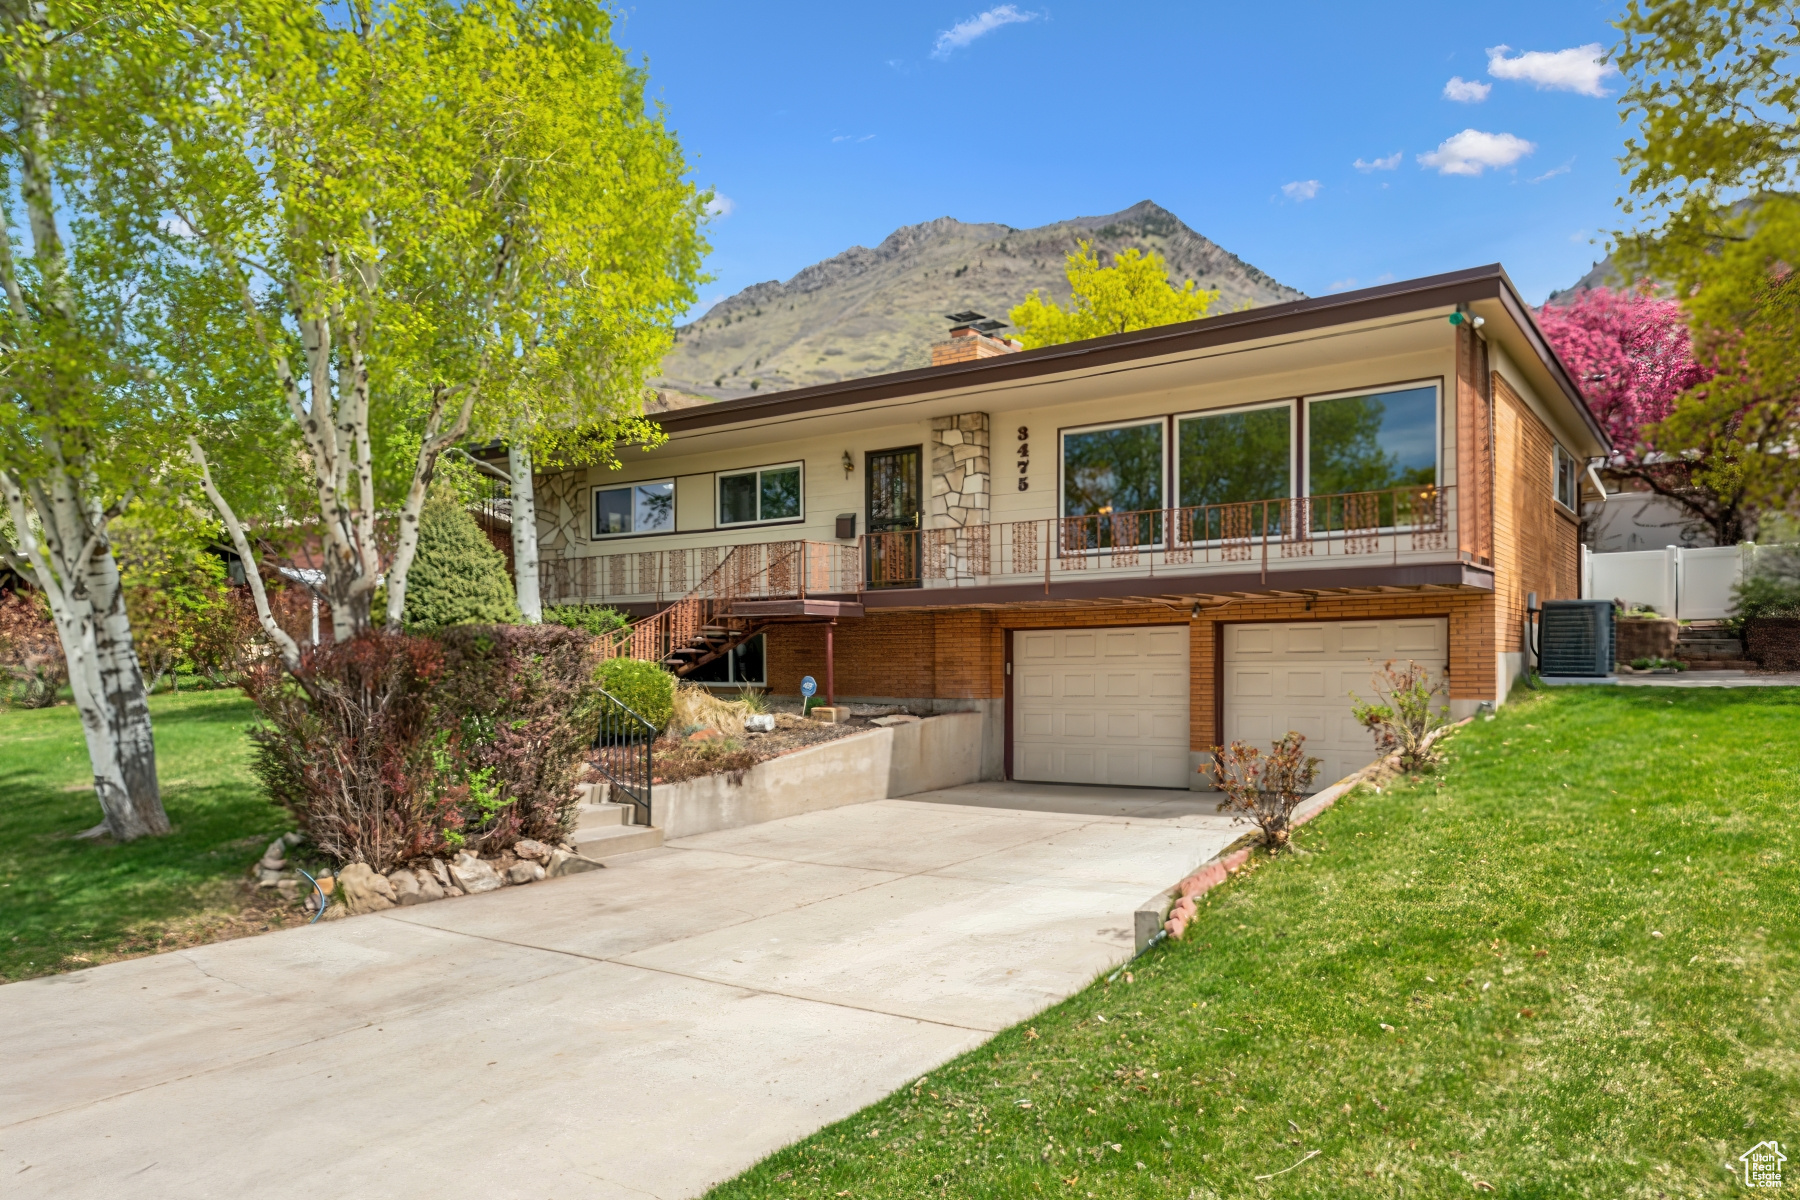
Pending
$825,000
4
bds
|
3
ba
|
2,193
sqft
|
built
1962
3475 S 3650 E, Salt Lake City, UT 84109
$-2,953
Cash flow
-18.7%
Cash-on-Cash Return
2.0%
Cap rate
0.3%
Rent to Value Ratio
Active
$915,000
5
bds
|
4
ba
|
3,040
sqft
|
built
1957
3581 E Yosemite Dr, Salt Lake City, UT 84109
$-2,222
Cash flow
-12.7%
Cash-on-Cash Return
3.4%
Cap rate
0.5%
Rent to Value Ratio
Active
$1,250,000
4
bds
|
3
ba
|
2,480
sqft
|
built
1952
1940 S 2500 E, Salt Lake City, UT 84108
$-5,085
Cash flow
-21.2%
Cash-on-Cash Return
1.4%
Cap rate
0.2%
Rent to Value Ratio
Active
$315,000
4
bds
|
2
ba
|
1,240
sqft
|
built
1992
558 N Redwood Rd, Salt Lake City, UT 84116
$-928
Cash flow
-15.4%
Cash-on-Cash Return
2.8%
Cap rate
0.5%
Rent to Value Ratio

Active
$1,290,000
5
bds
|
4
ba
|
4,240
sqft
|
built
1959
3273 E Bernada Dr, Salt Lake City, UT 84124
$-3,979
Cash flow
-16.1%
Cash-on-Cash Return
2.6%
Cap rate
0.4%
Rent to Value Ratio
Active
$485,000
4
bds
|
2
ba
|
1,824
sqft
|
built
1977
5550 S Westside Dr, Salt Lake City, UT 84118
$-1,078
Cash flow
-11.6%
Cash-on-Cash Return
3.6%
Cap rate
0.5%
Rent to Value Ratio
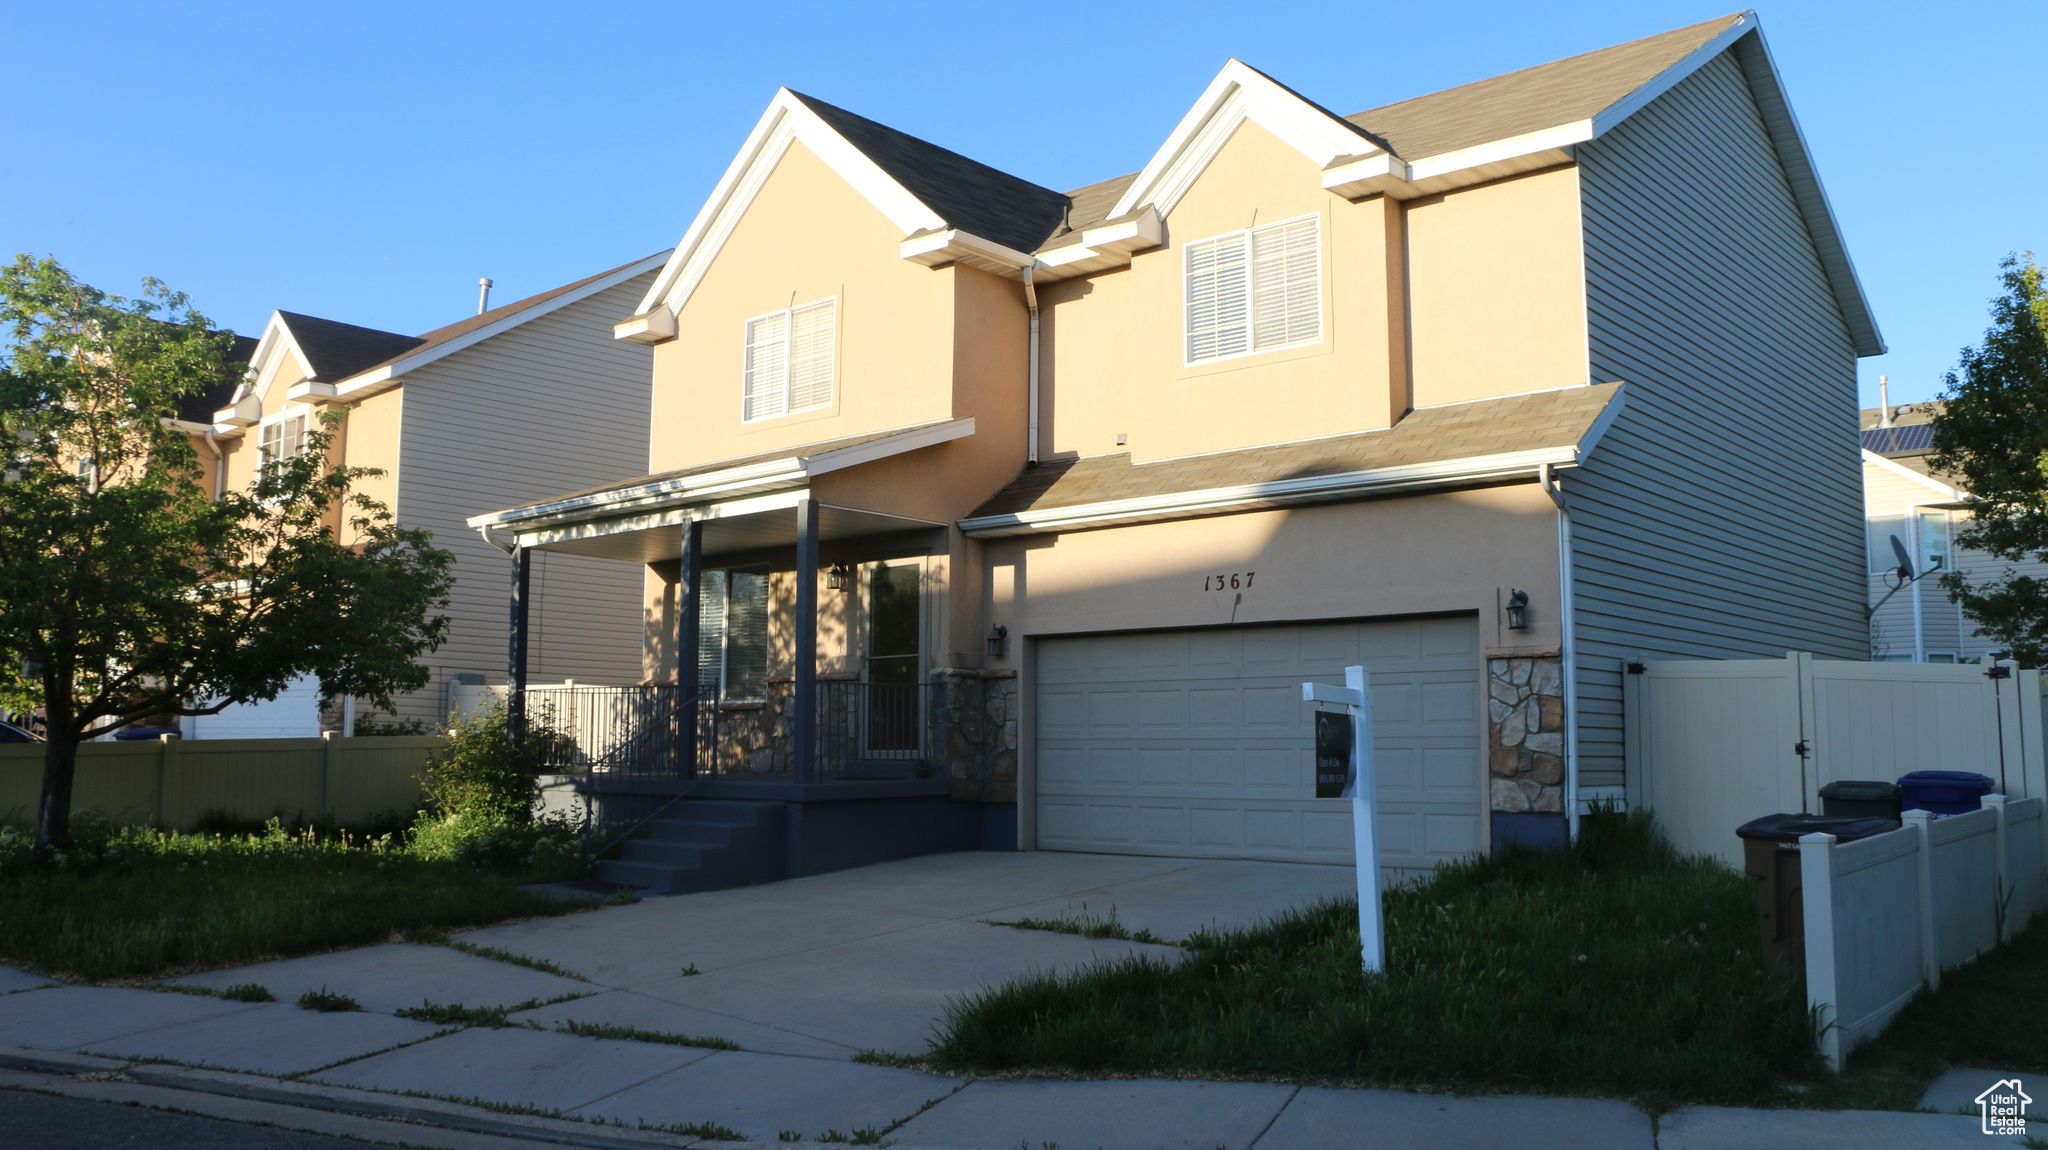
Active
$569,000
5
bds
|
4
ba
|
2,476
sqft
|
built
2003
1367 S Dokos Ln, Salt Lake City, UT 84104
$-1,327
Cash flow
-12.2%
Cash-on-Cash Return
3.5%
Cap rate
0.5%
Rent to Value Ratio
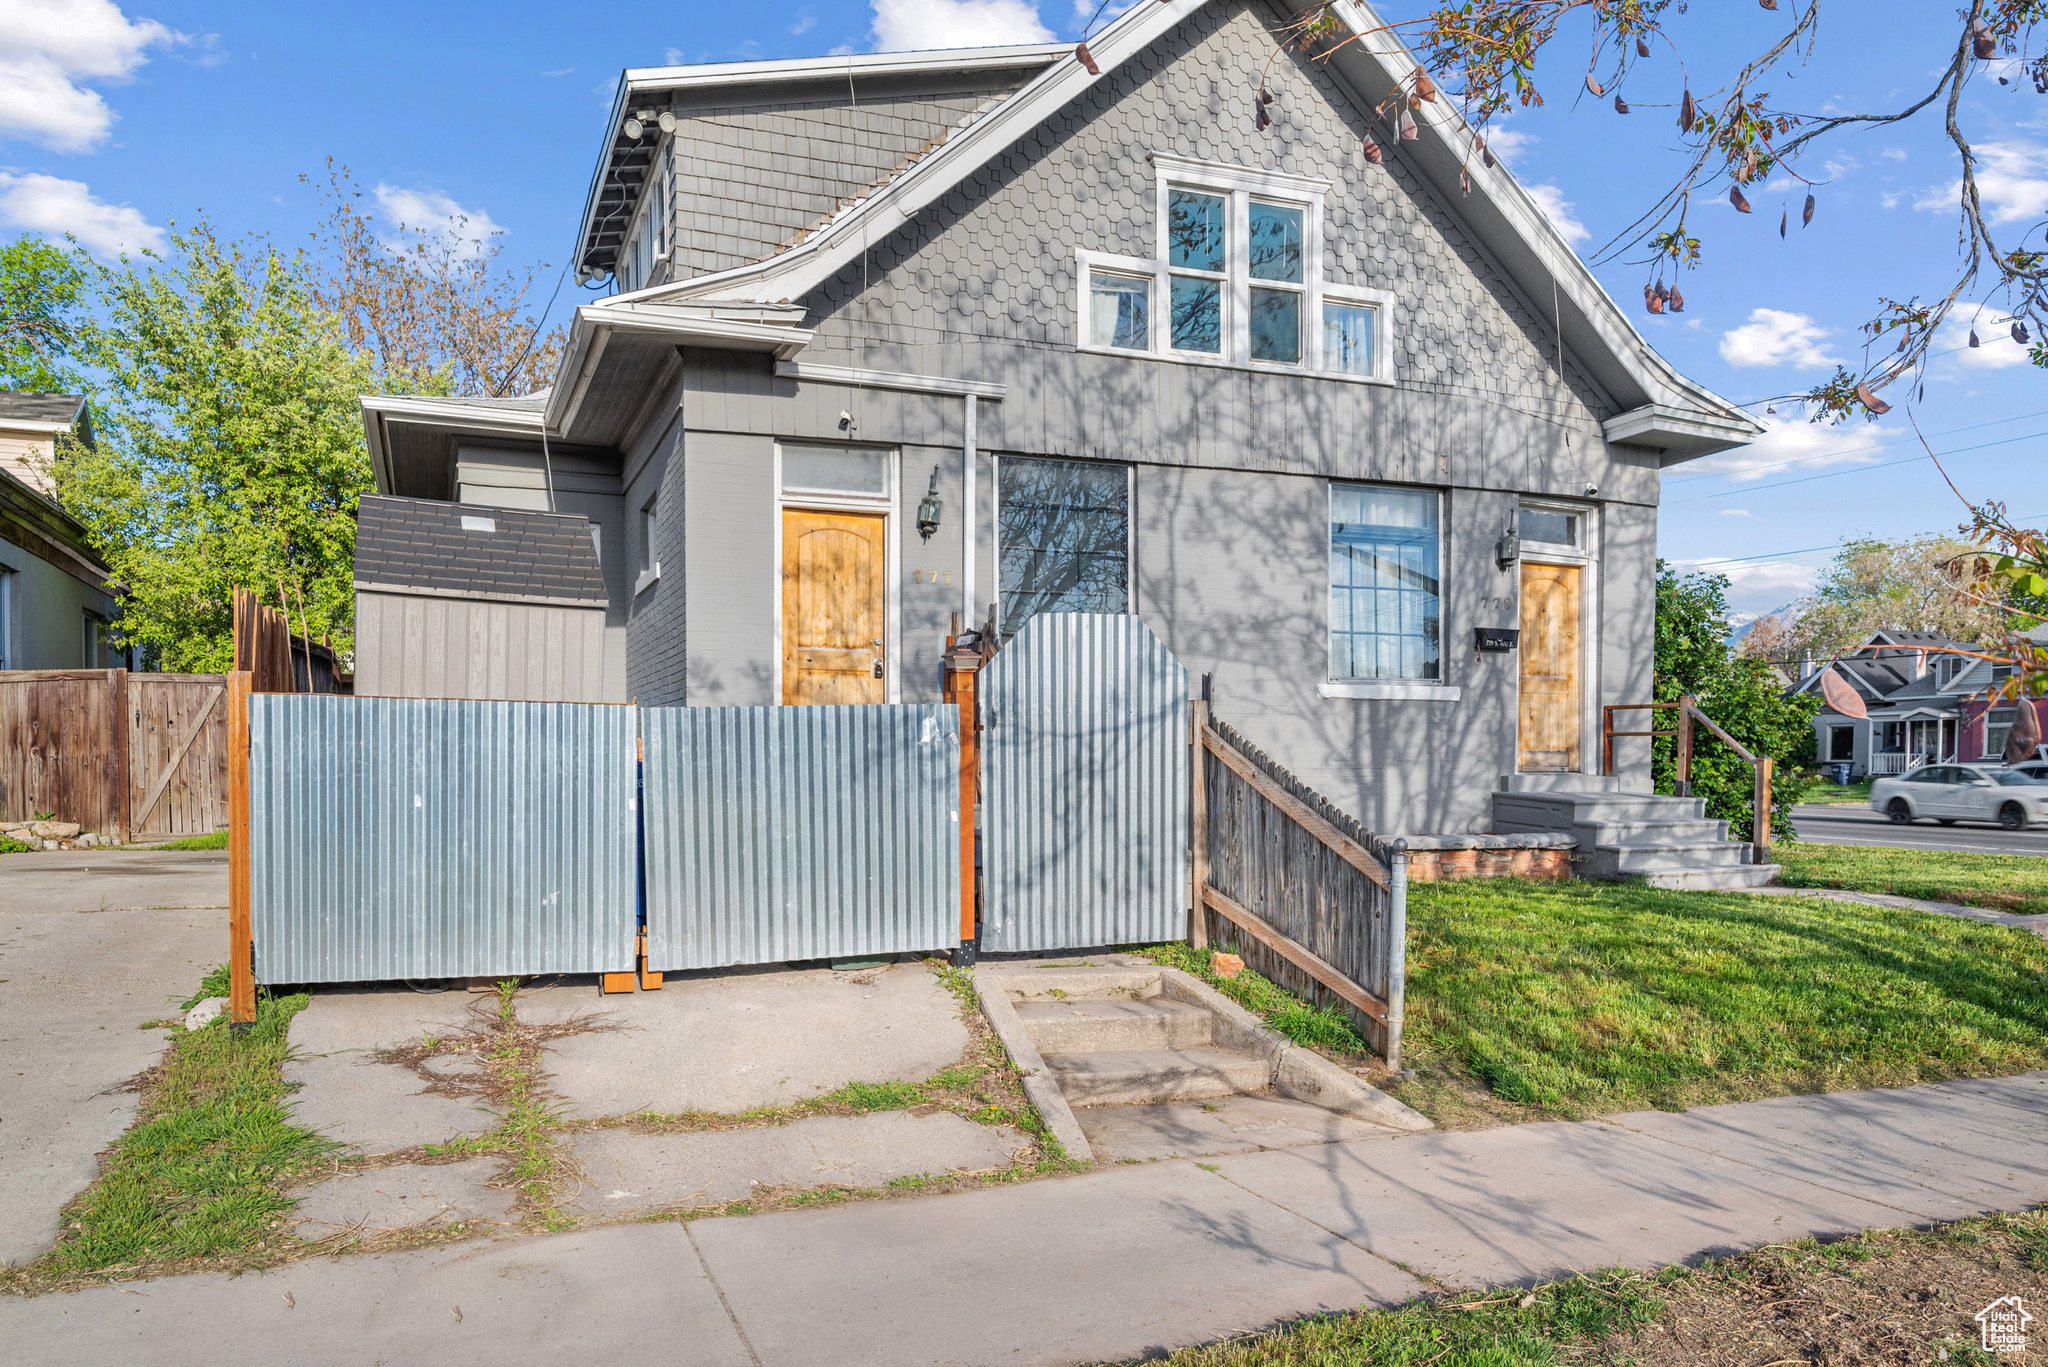
Active
$599,000
3
bds
|
2
ba
|
2,314
sqft
|
built
1901
779 S 400 E, Salt Lake City, UT 84111
$-1,806
Cash flow
-15.7%
Cash-on-Cash Return
2.7%
Cap rate
0.4%
Rent to Value Ratio
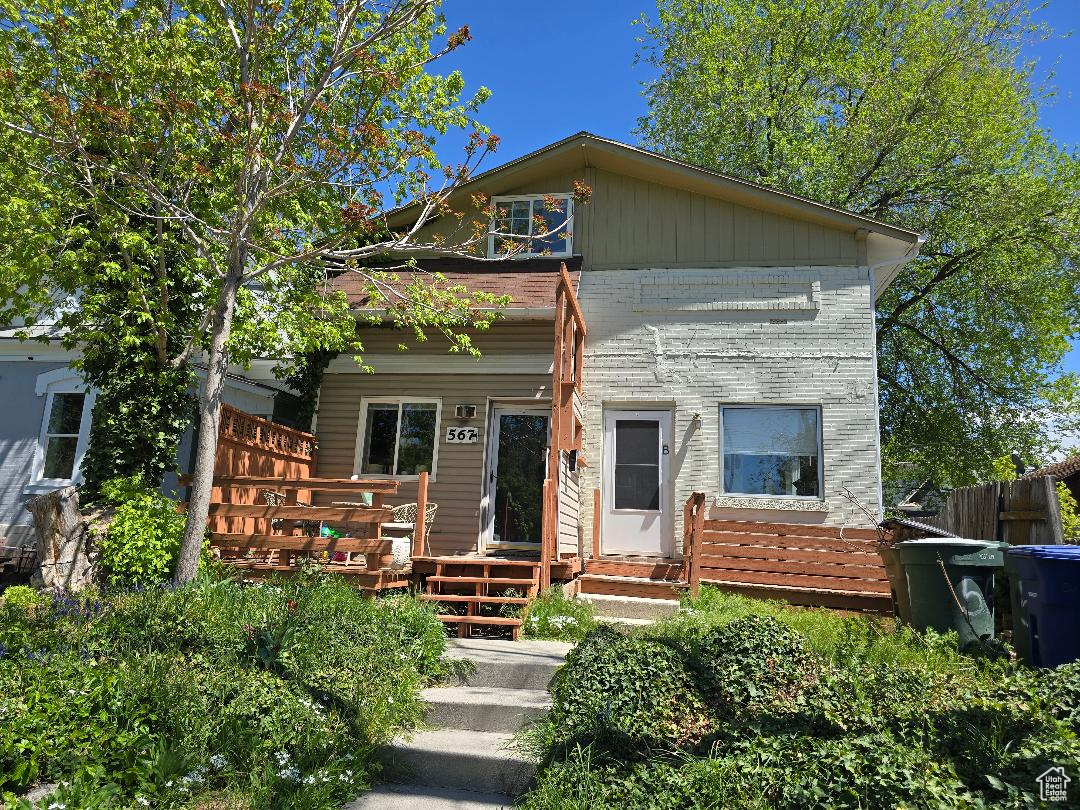
Active
$869,000
6
bds
|
3
ba
|
2,750
sqft
|
built
1916
567 S 800 E, Salt Lake City, UT 84102
$-2,938
Cash flow
-17.6%
Cash-on-Cash Return
2.2%
Cap rate
0.3%
Rent to Value Ratio
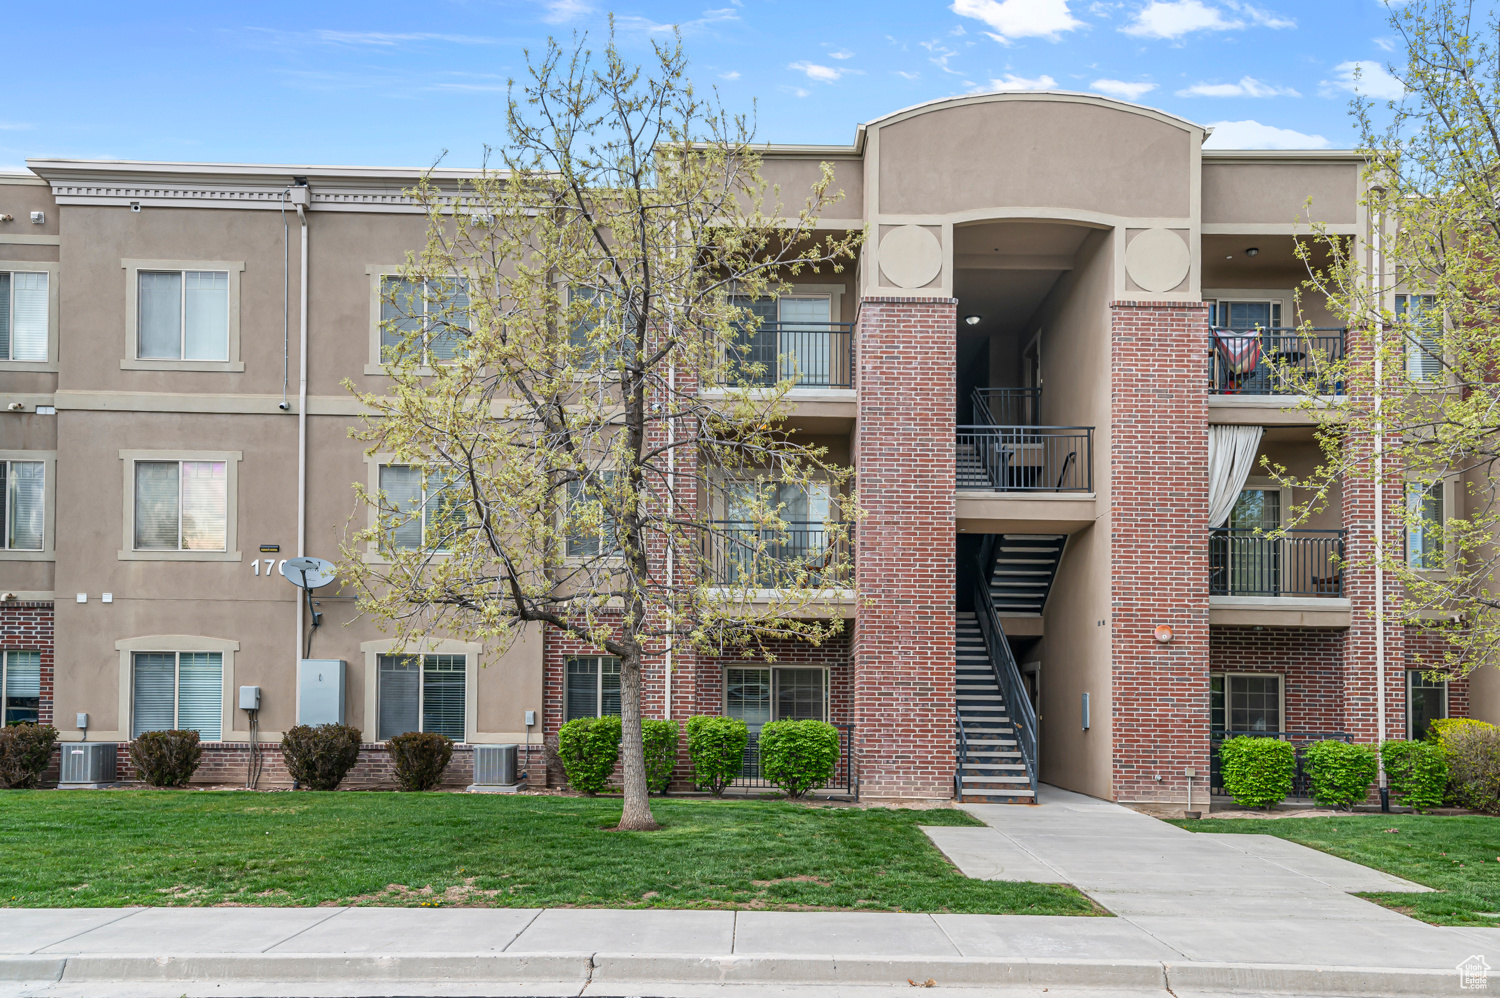
Active
$375,000
1
bds
|
1
ba
|
859
sqft
|
built
2011
170 E Belmont Ave, Salt Lake City, UT 84111
$-991
Cash flow
-13.8%
Cash-on-Cash Return
3.1%
Cap rate
0.5%
Rent to Value Ratio
Active
$3,200,000
3
bds
|
4
ba
|
5,686
sqft
|
built
1960
1235 E 200 S, Salt Lake City, UT 84102
$-16,955
Cash flow
-27.6%
Cash-on-Cash Return
-0.1%
Cap rate
0.2%
Rent to Value Ratio
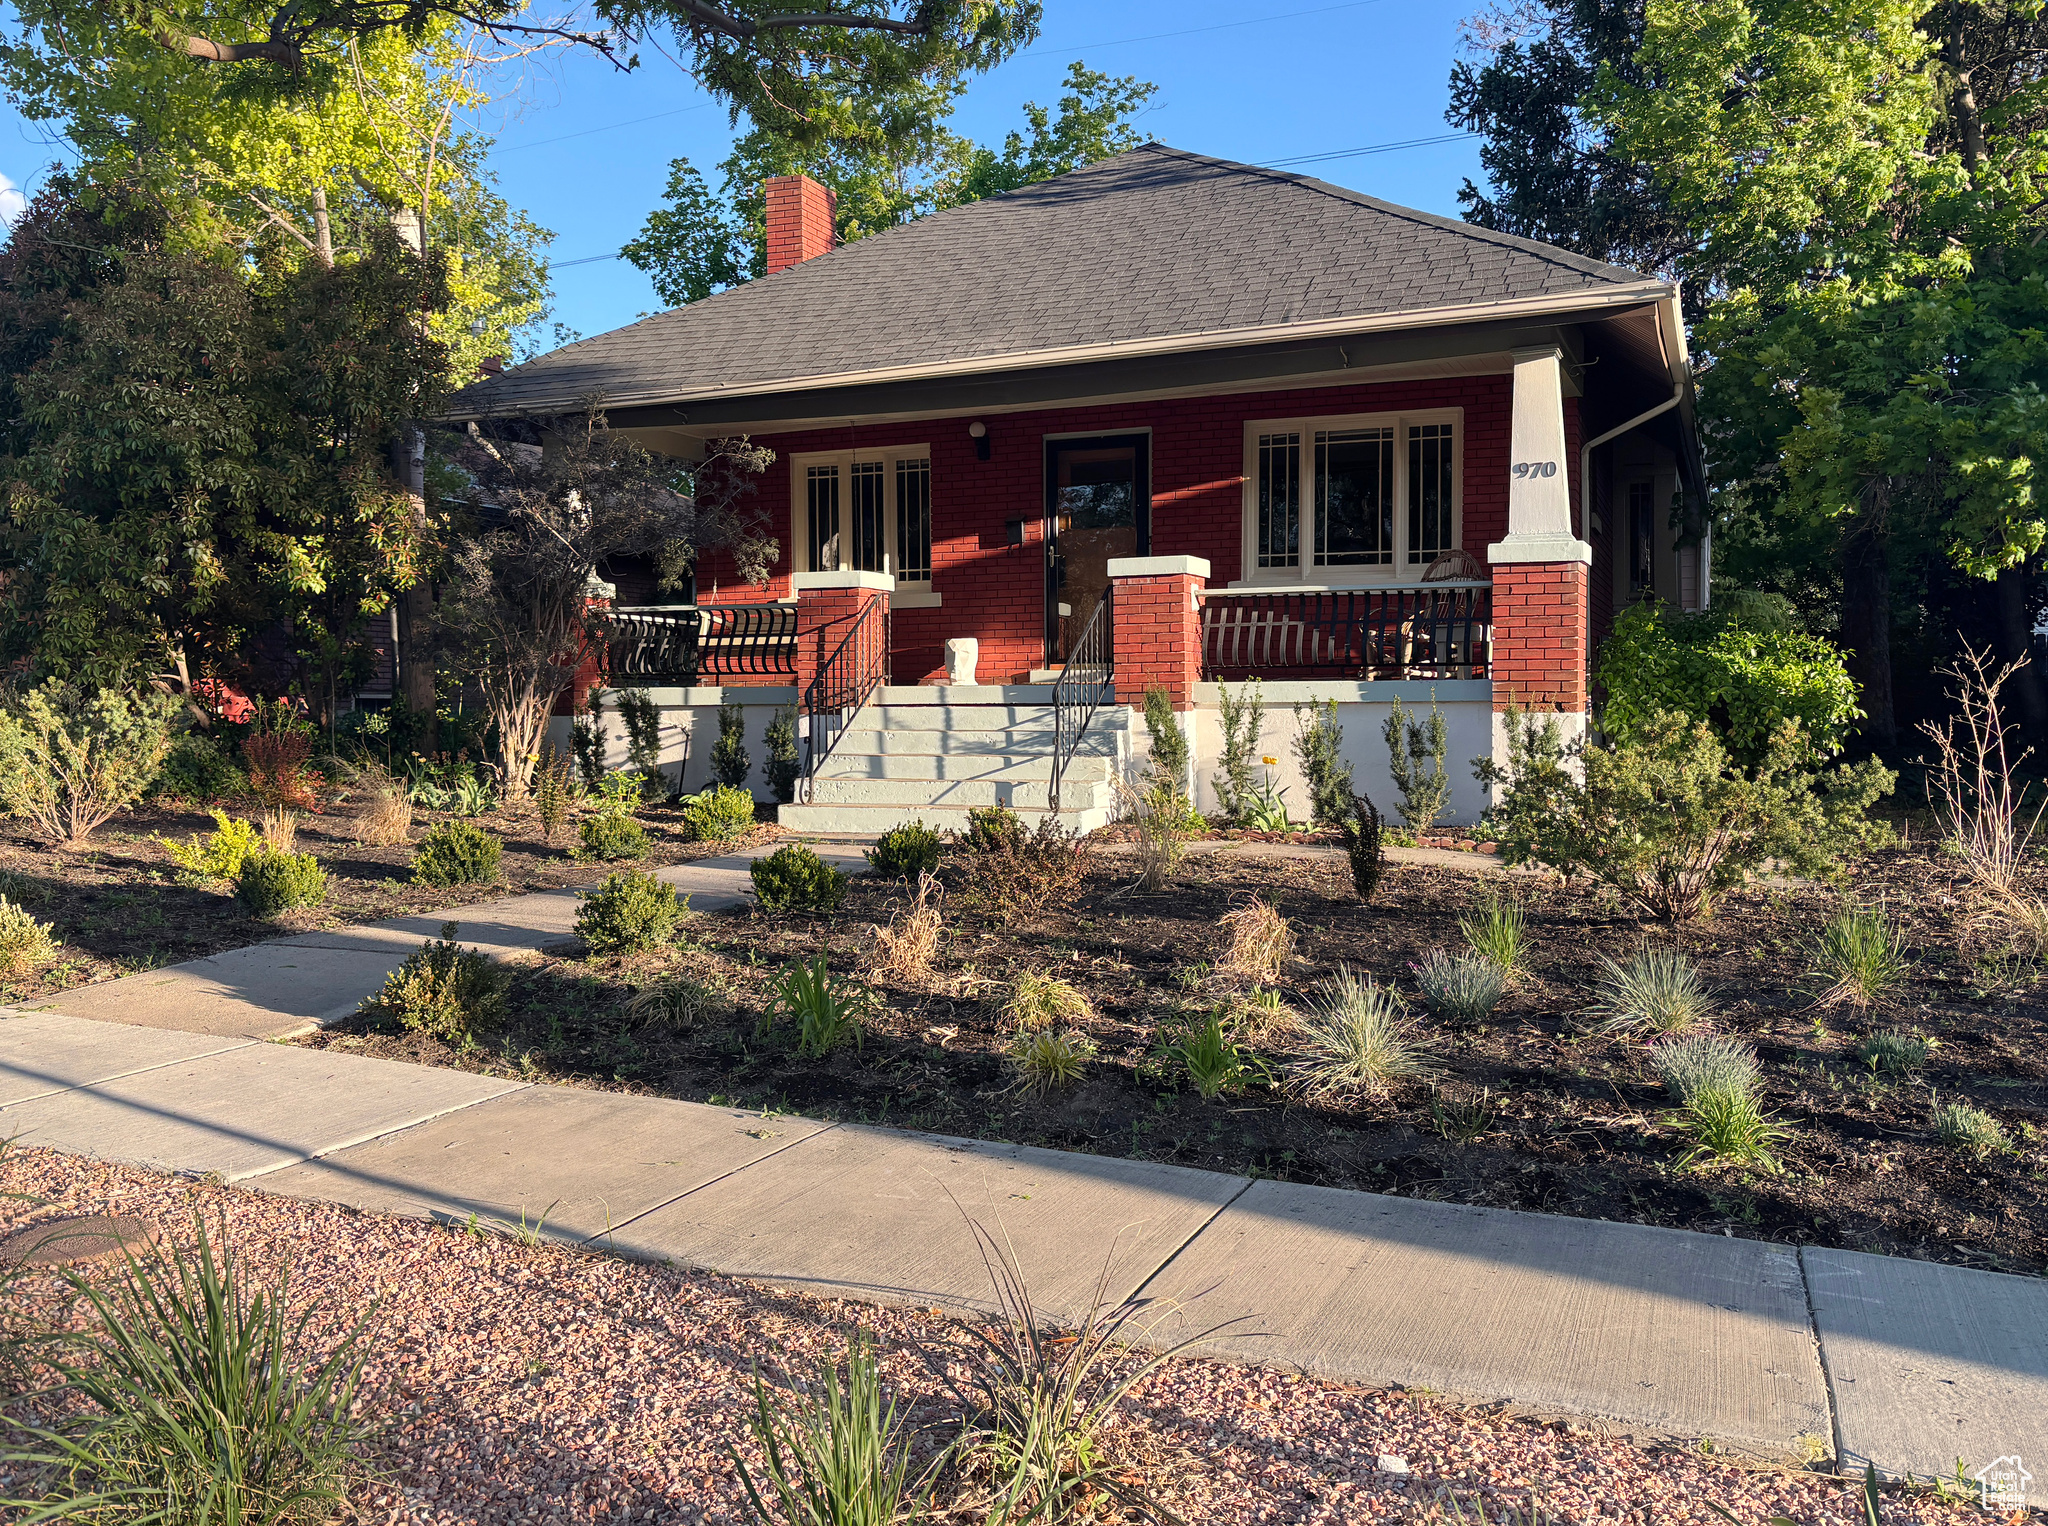
Active
$899,000
4
bds
|
2
ba
|
2,944
sqft
|
built
1921
970 E Wilson Ave, Salt Lake City, UT 84105
$-2,243
Cash flow
-13.0%
Cash-on-Cash Return
3.3%
Cap rate
0.4%
Rent to Value Ratio
Active
$995,000
5
bds
|
3
ba
|
2,574
sqft
|
built
1955
2850 S 2750 E, Salt Lake City, UT 84109
$-3,253
Cash flow
-17.1%
Cash-on-Cash Return
2.4%
Cap rate
0.4%
Rent to Value Ratio
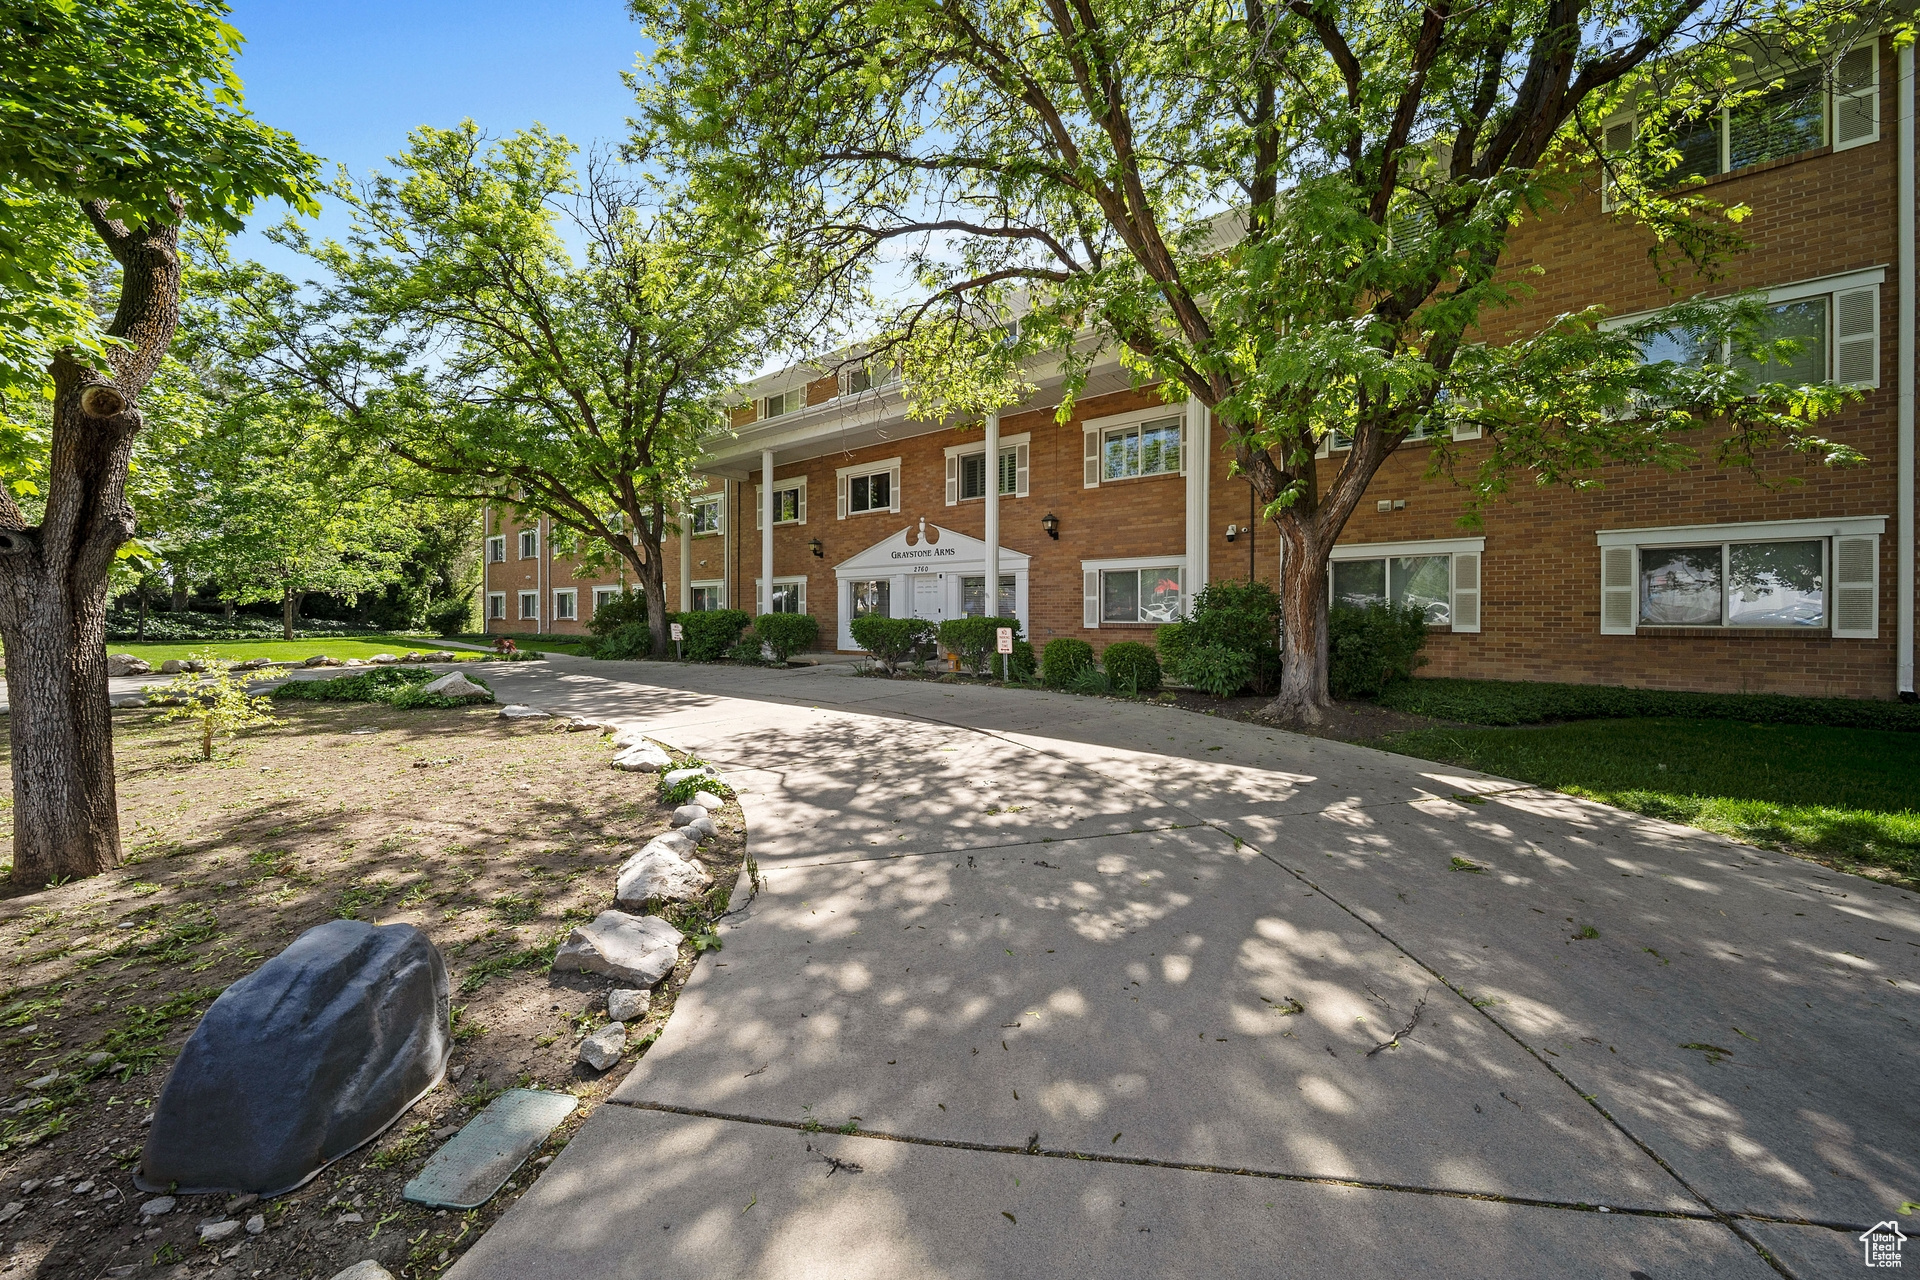
Active
$454,999
2
bds
|
2
ba
|
1,668
sqft
|
built
1981
2760 S Highland Dr, Salt Lake City, UT 84106
$-1,507
Cash flow
-17.3%
Cash-on-Cash Return
2.3%
Cap rate
0.5%
Rent to Value Ratio
Active
$180,000
1
bds
|
1
ba
|
400
sqft
|
built
1909
86 B St, Salt Lake City, UT 84103
$-479
Cash flow
-13.9%
Cash-on-Cash Return
3.1%
Cap rate
0.8%
Rent to Value Ratio
Active
$405,000
2
bds
|
1
ba
|
1,706
sqft
|
built
1952
981 N 1300 W, Salt Lake City, UT 84116
$-875
Cash flow
-11.3%
Cash-on-Cash Return
3.7%
Cap rate
0.5%
Rent to Value Ratio
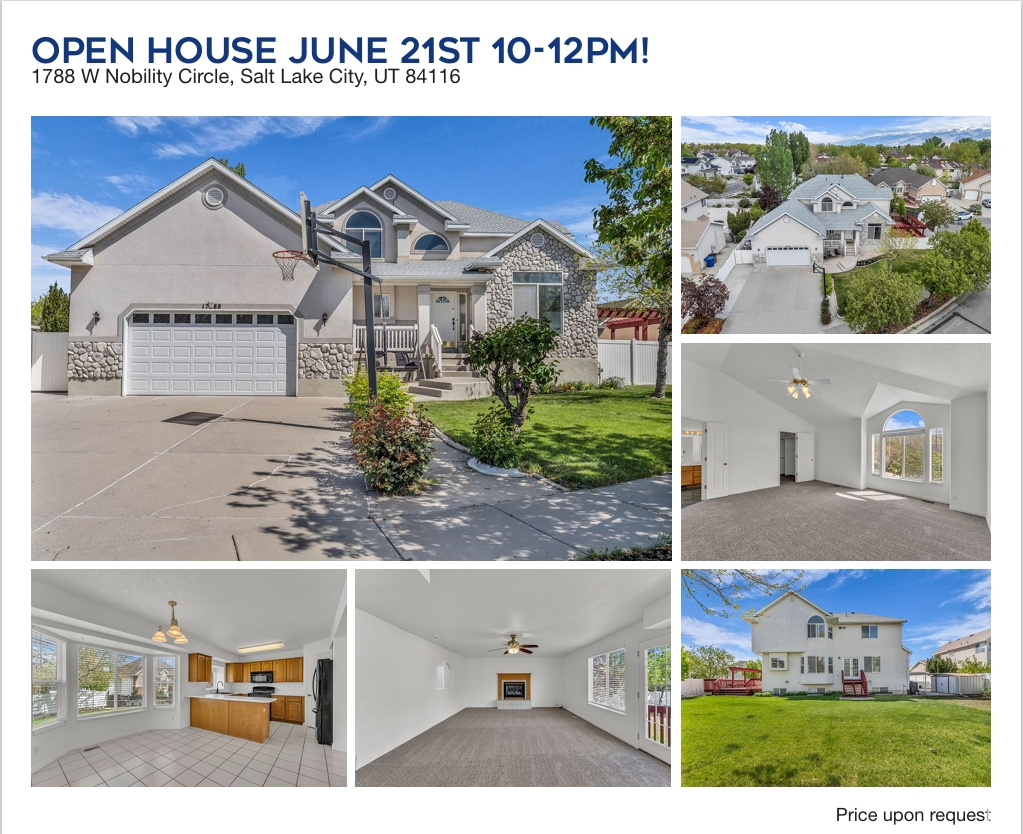
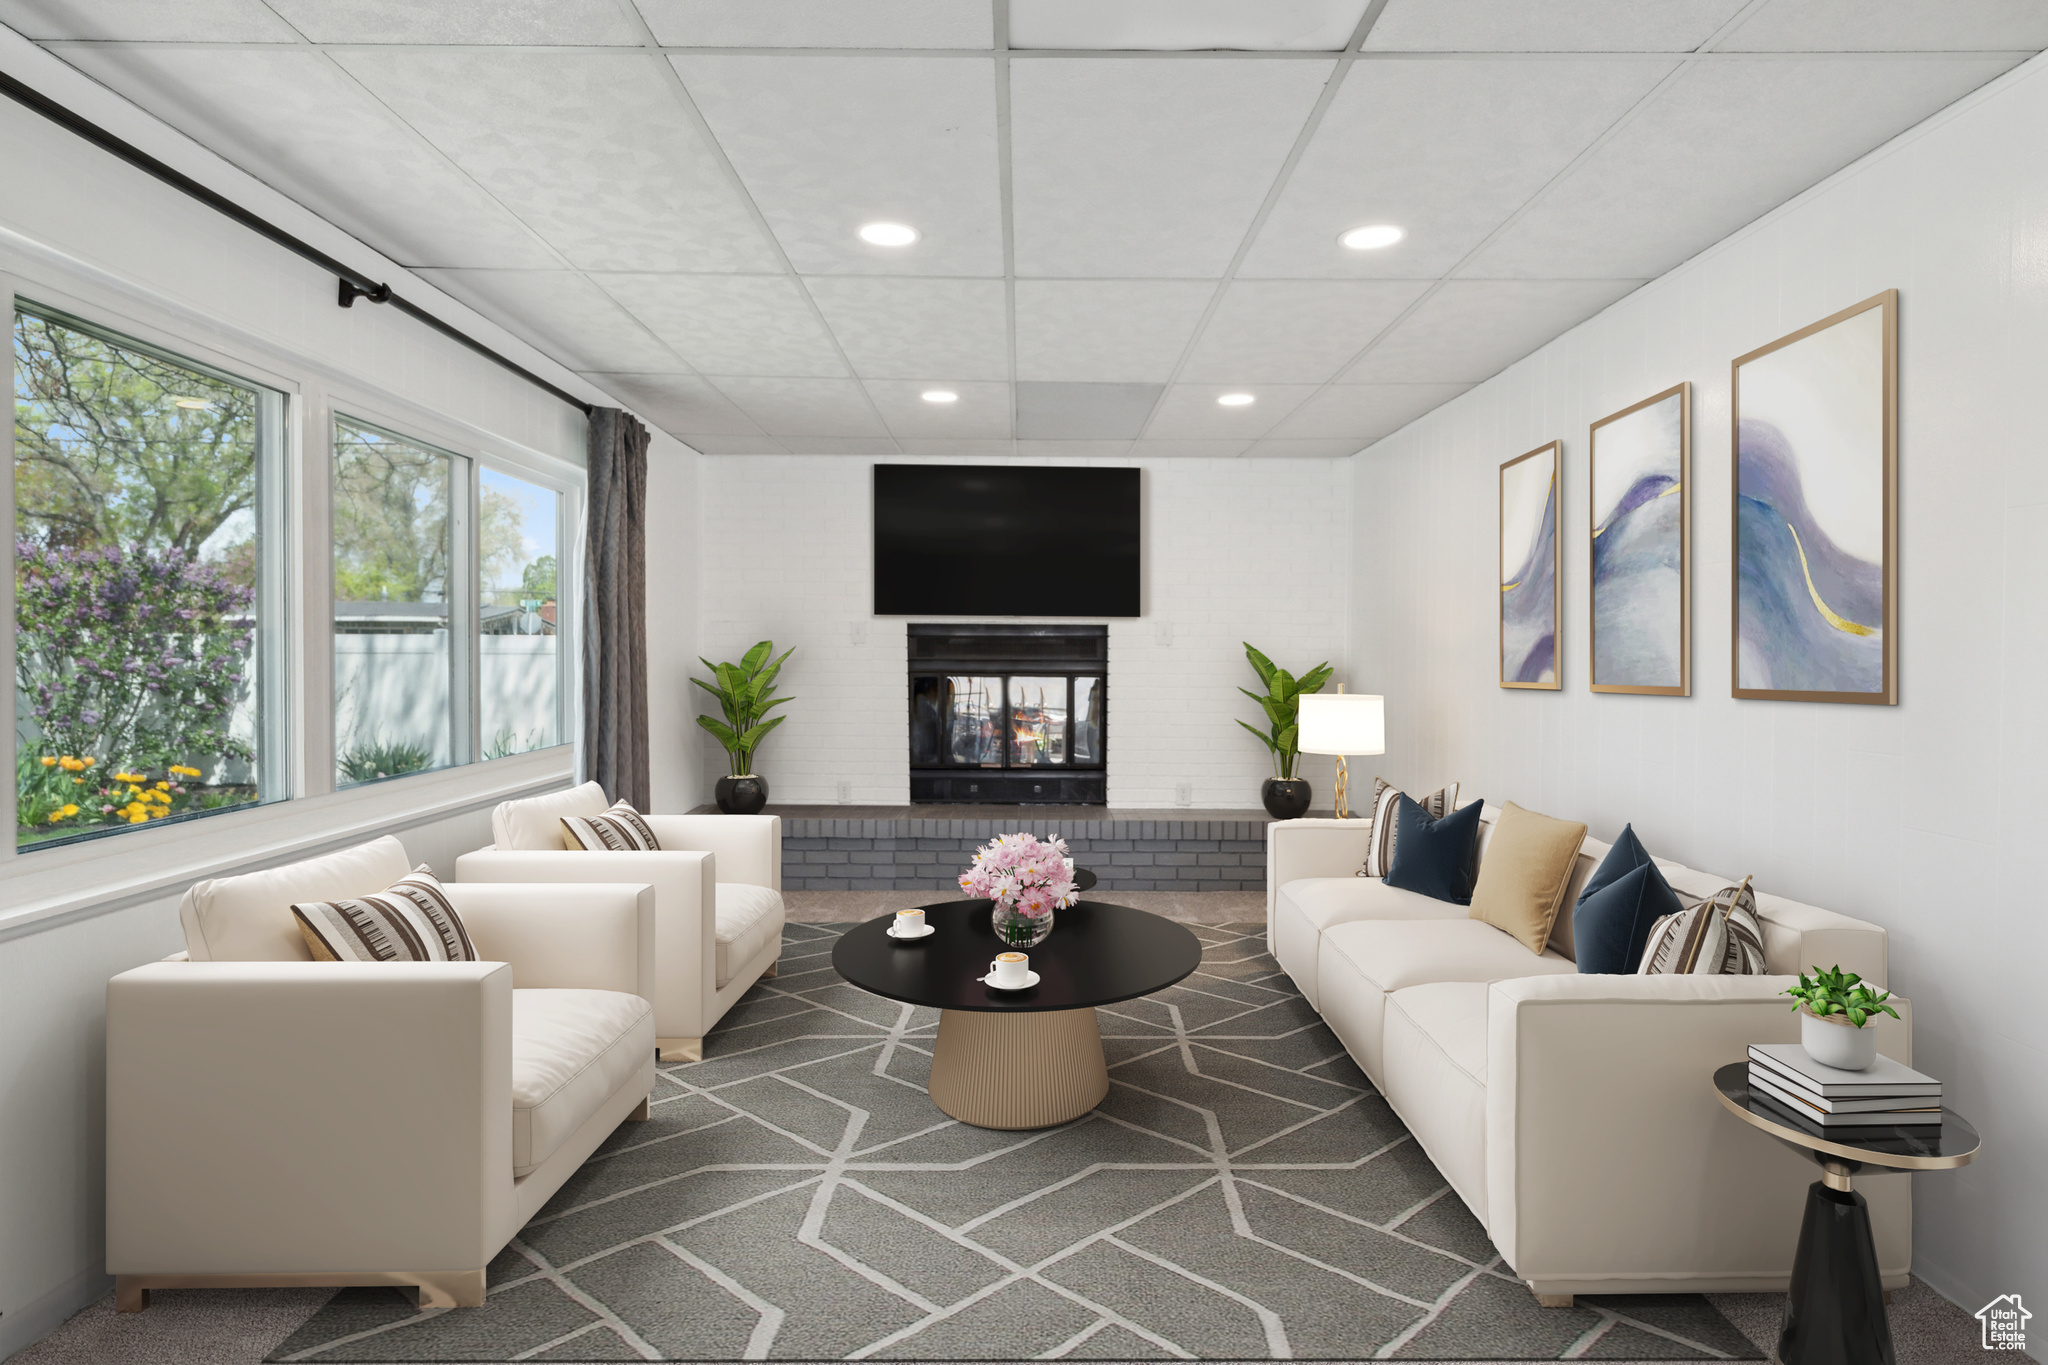
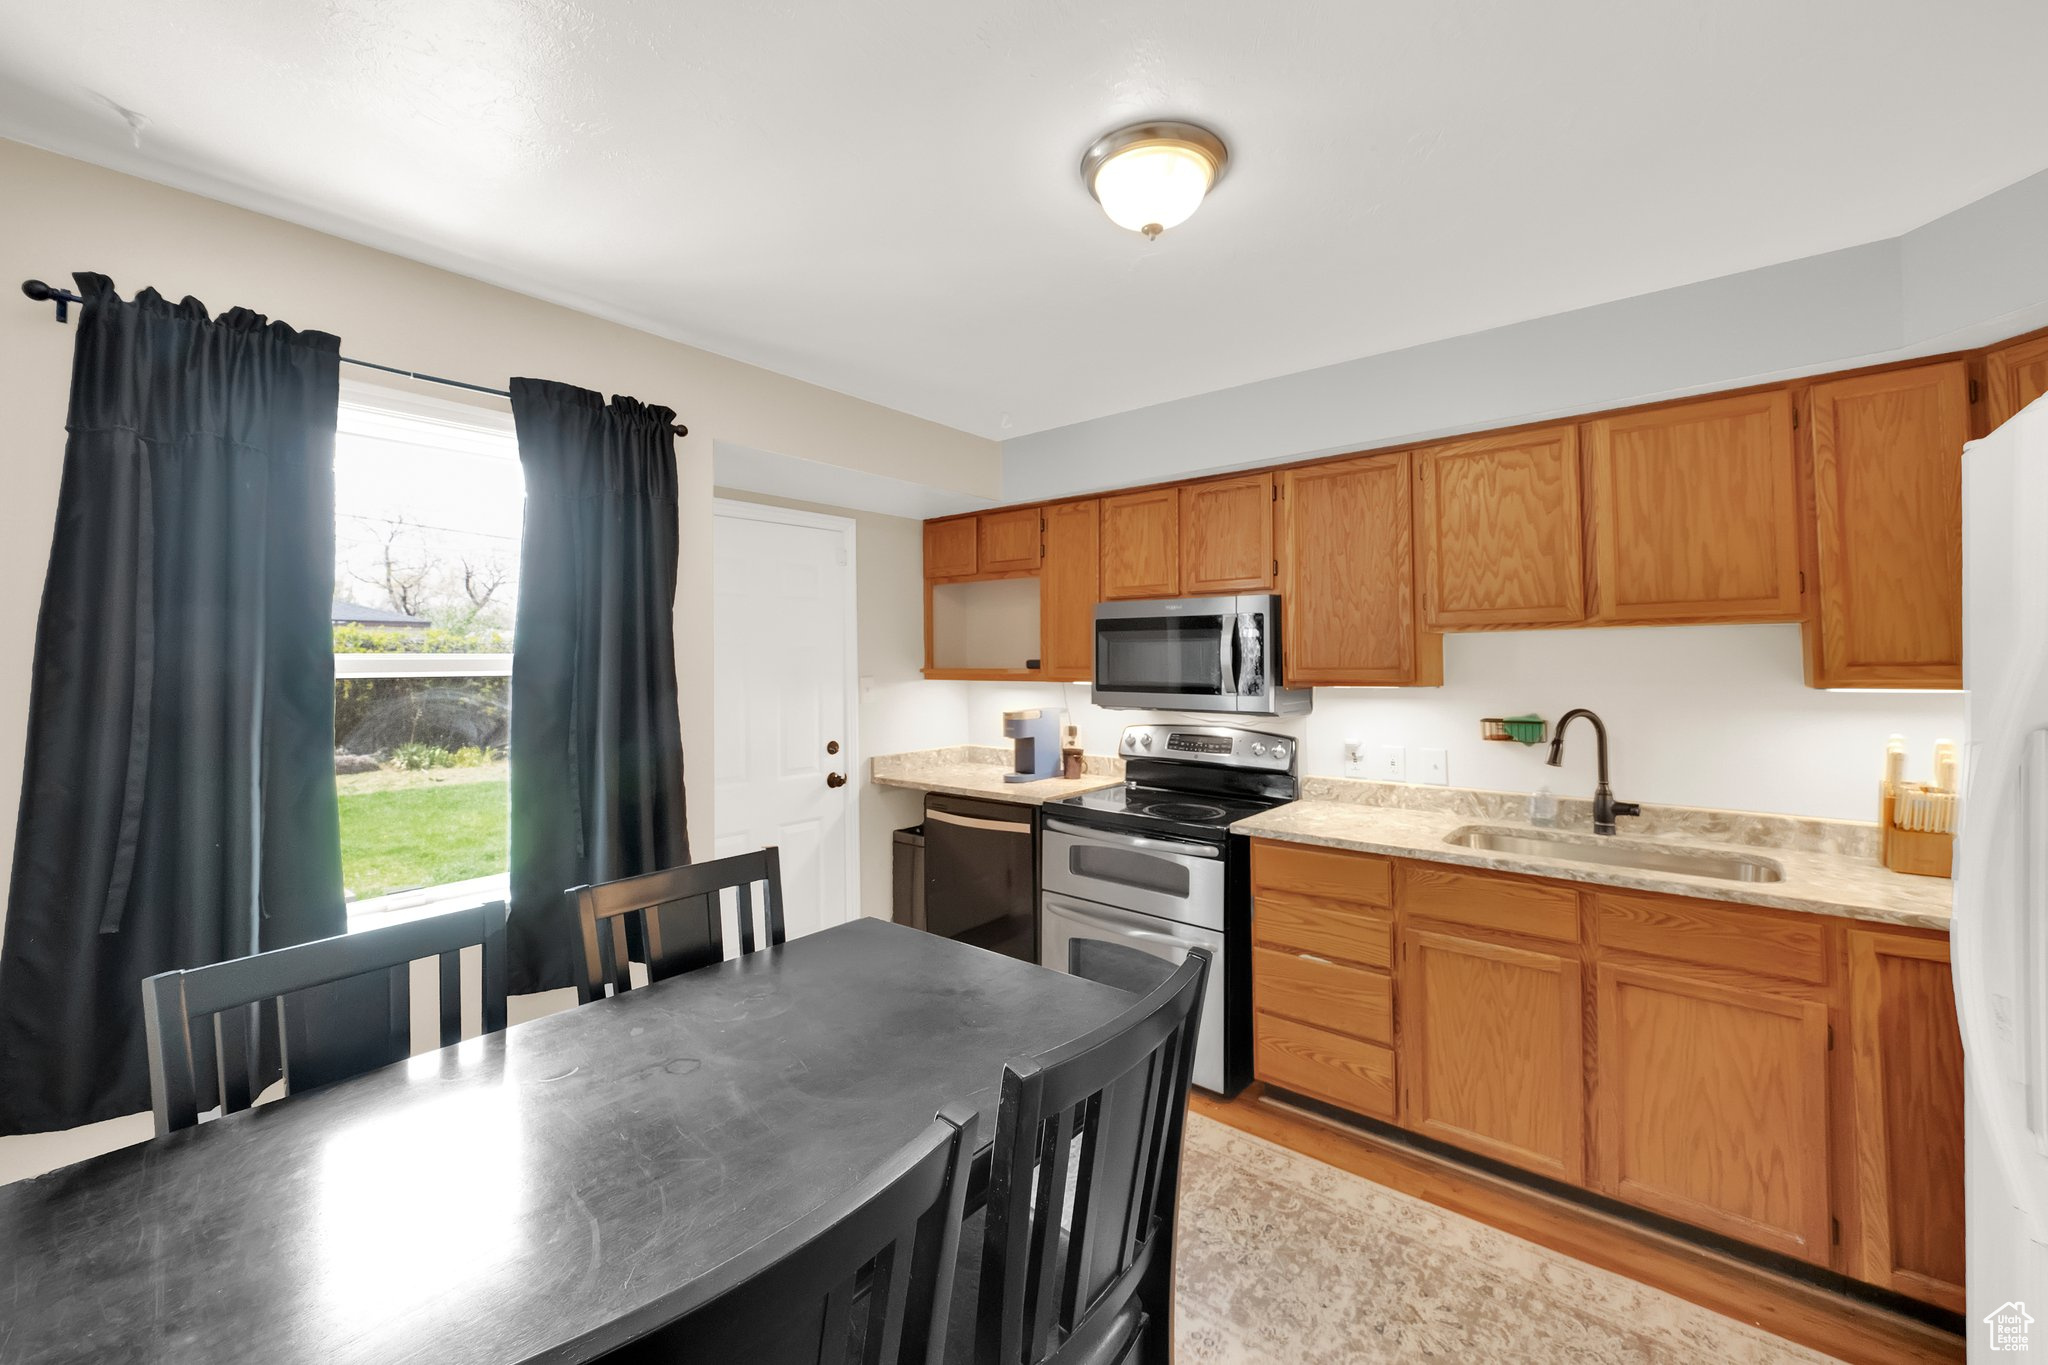
Active
$769,999
6
bds
|
4
ba
|
4,122
sqft
|
built
1997
1788 W Nobility Cir, Salt Lake City, UT 84116
$-2,436
Cash flow
-16.5%
Cash-on-Cash Return
2.5%
Cap rate
0.4%
Rent to Value Ratio
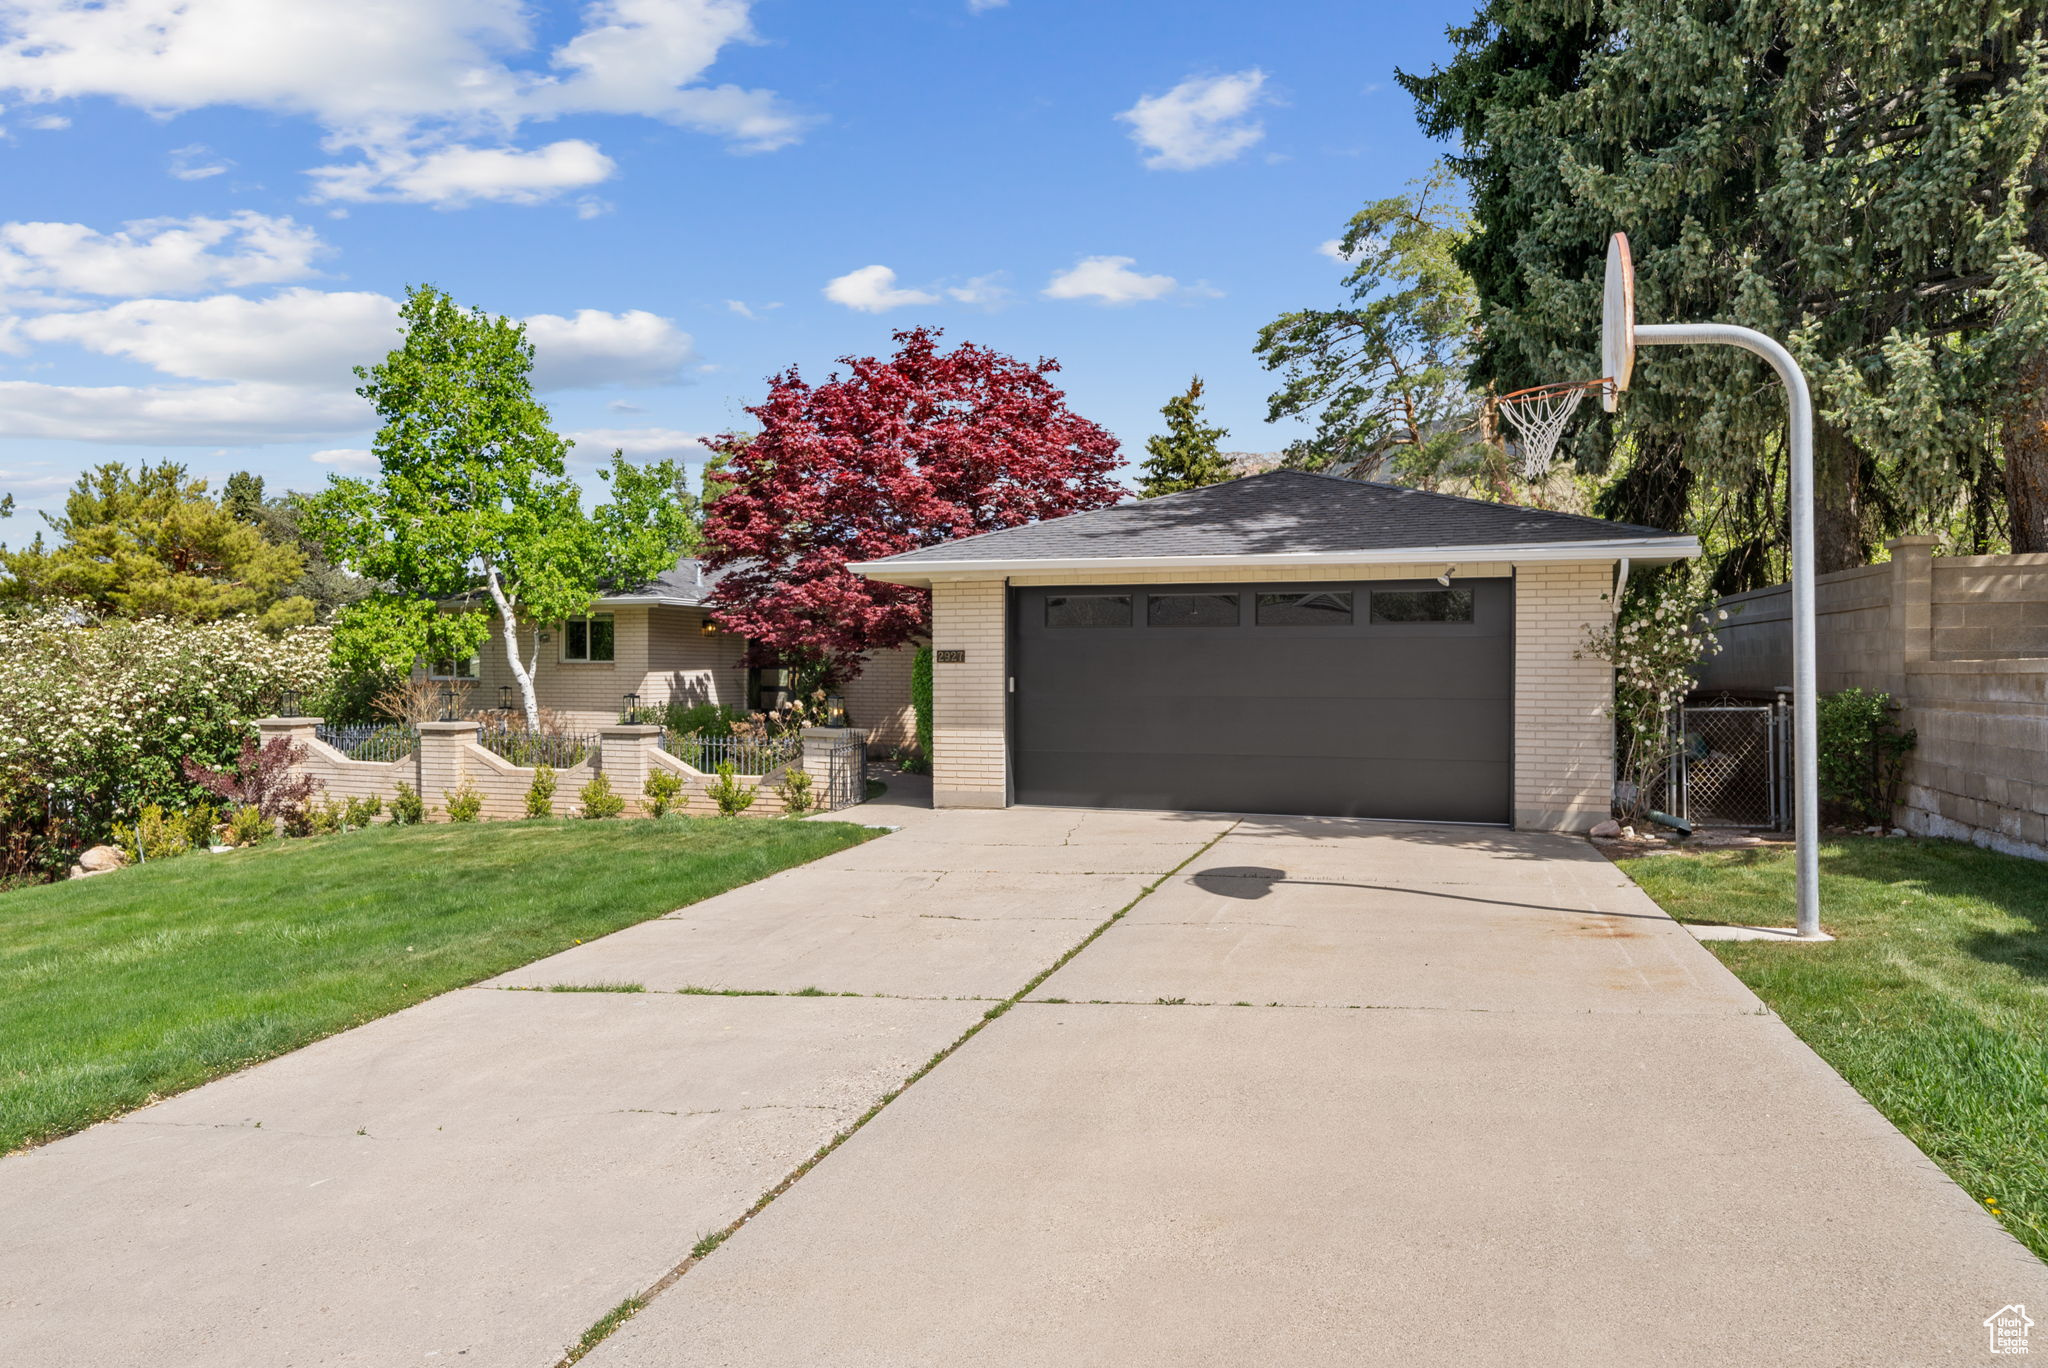
Active under contract
$1,735,000
5
bds
|
3
ba
|
3,914
sqft
|
built
1965
2927 E Oakhurst Dr, Salt Lake City, UT 84108
$-4,729
Cash flow
-14.2%
Cash-on-Cash Return
3.0%
Cap rate
0.4%
Rent to Value Ratio
Active
$429,900
4
bds
|
3
ba
|
1,967
sqft
|
built
1955
5756 S 4540 W, Salt Lake City, UT 84118
$-1,085
Cash flow
-13.2%
Cash-on-Cash Return
3.3%
Cap rate
0.5%
Rent to Value Ratio
Active
$494,500
4
bds
|
2
ba
|
1,953
sqft
|
built
1981
4635 W Eskesen Dr, Salt Lake City, UT 84120
$-1,018
Cash flow
-10.7%
Cash-on-Cash Return
3.8%
Cap rate
0.5%
Rent to Value Ratio
Active
$2,499,000
6
bds
|
6
ba
|
7,801
sqft
|
built
1984
4545 S Abinadi Rd, Salt Lake City, UT 84124
$-11,319
Cash flow
-23.6%
Cash-on-Cash Return
0.8%
Cap rate
0.2%
Rent to Value Ratio
Active
$1,175,000
4
bds
|
3
ba
|
3,136
sqft
|
built
1913
1159 S Windsor St, Salt Lake City, UT 84105
$-3,844
Cash flow
-17.1%
Cash-on-Cash Return
2.4%
Cap rate
0.3%
Rent to Value Ratio