Salt Lake City, UT Investment Properties for Sale
Browse homes for sale and investment properties in Salt Lake City, UT. Refine your search by price, property type, or more.
Best cash flowing properties in Salt Lake City, UT
Active
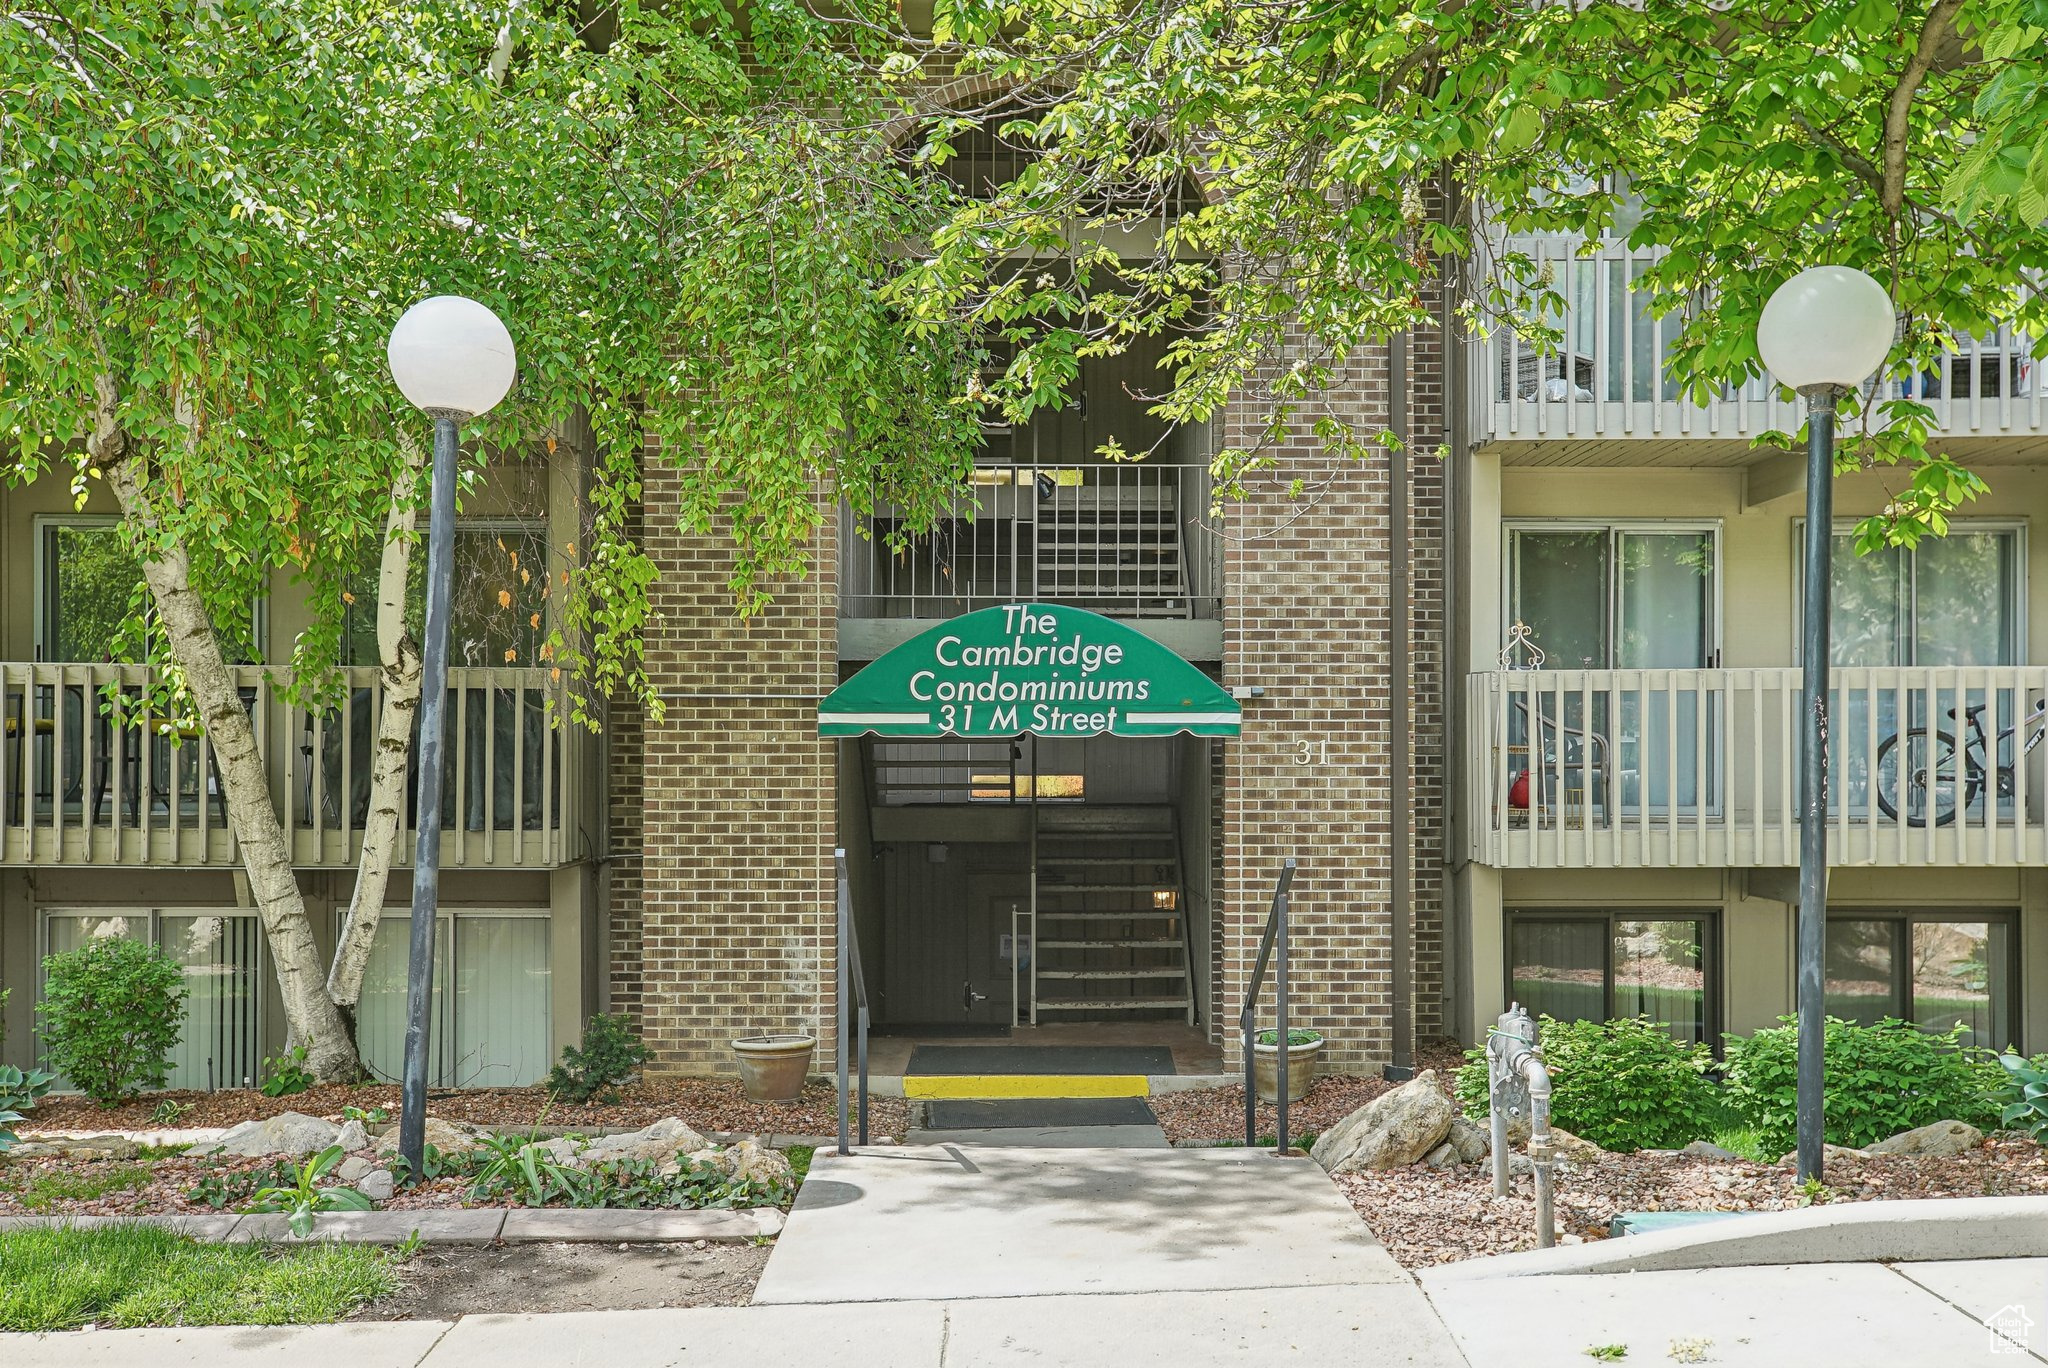
$290,000
2
bds
|
1
ba
|
938
sqft
|
built
1977
31 M St, Salt Lake City, UT 84103
$-618
Cash flow
-11.1%
Cash-on-Cash Return
3.7%
Cap rate
0.7%
Rent to Value Ratio
Active
$295,000
1
bds
|
1
ba
|
708
sqft
|
built
1968
521 E 5th Ave, Salt Lake City, UT 84103
$-919
Cash flow
-16.3%
Cash-on-Cash Return
2.5%
Cap rate
0.5%
Rent to Value Ratio
677 out of 779 properties for sale in Salt Lake City, UT
Limited Results Shown
Create a free account, or log in to reveal all property listings and enjoy the complete experience.
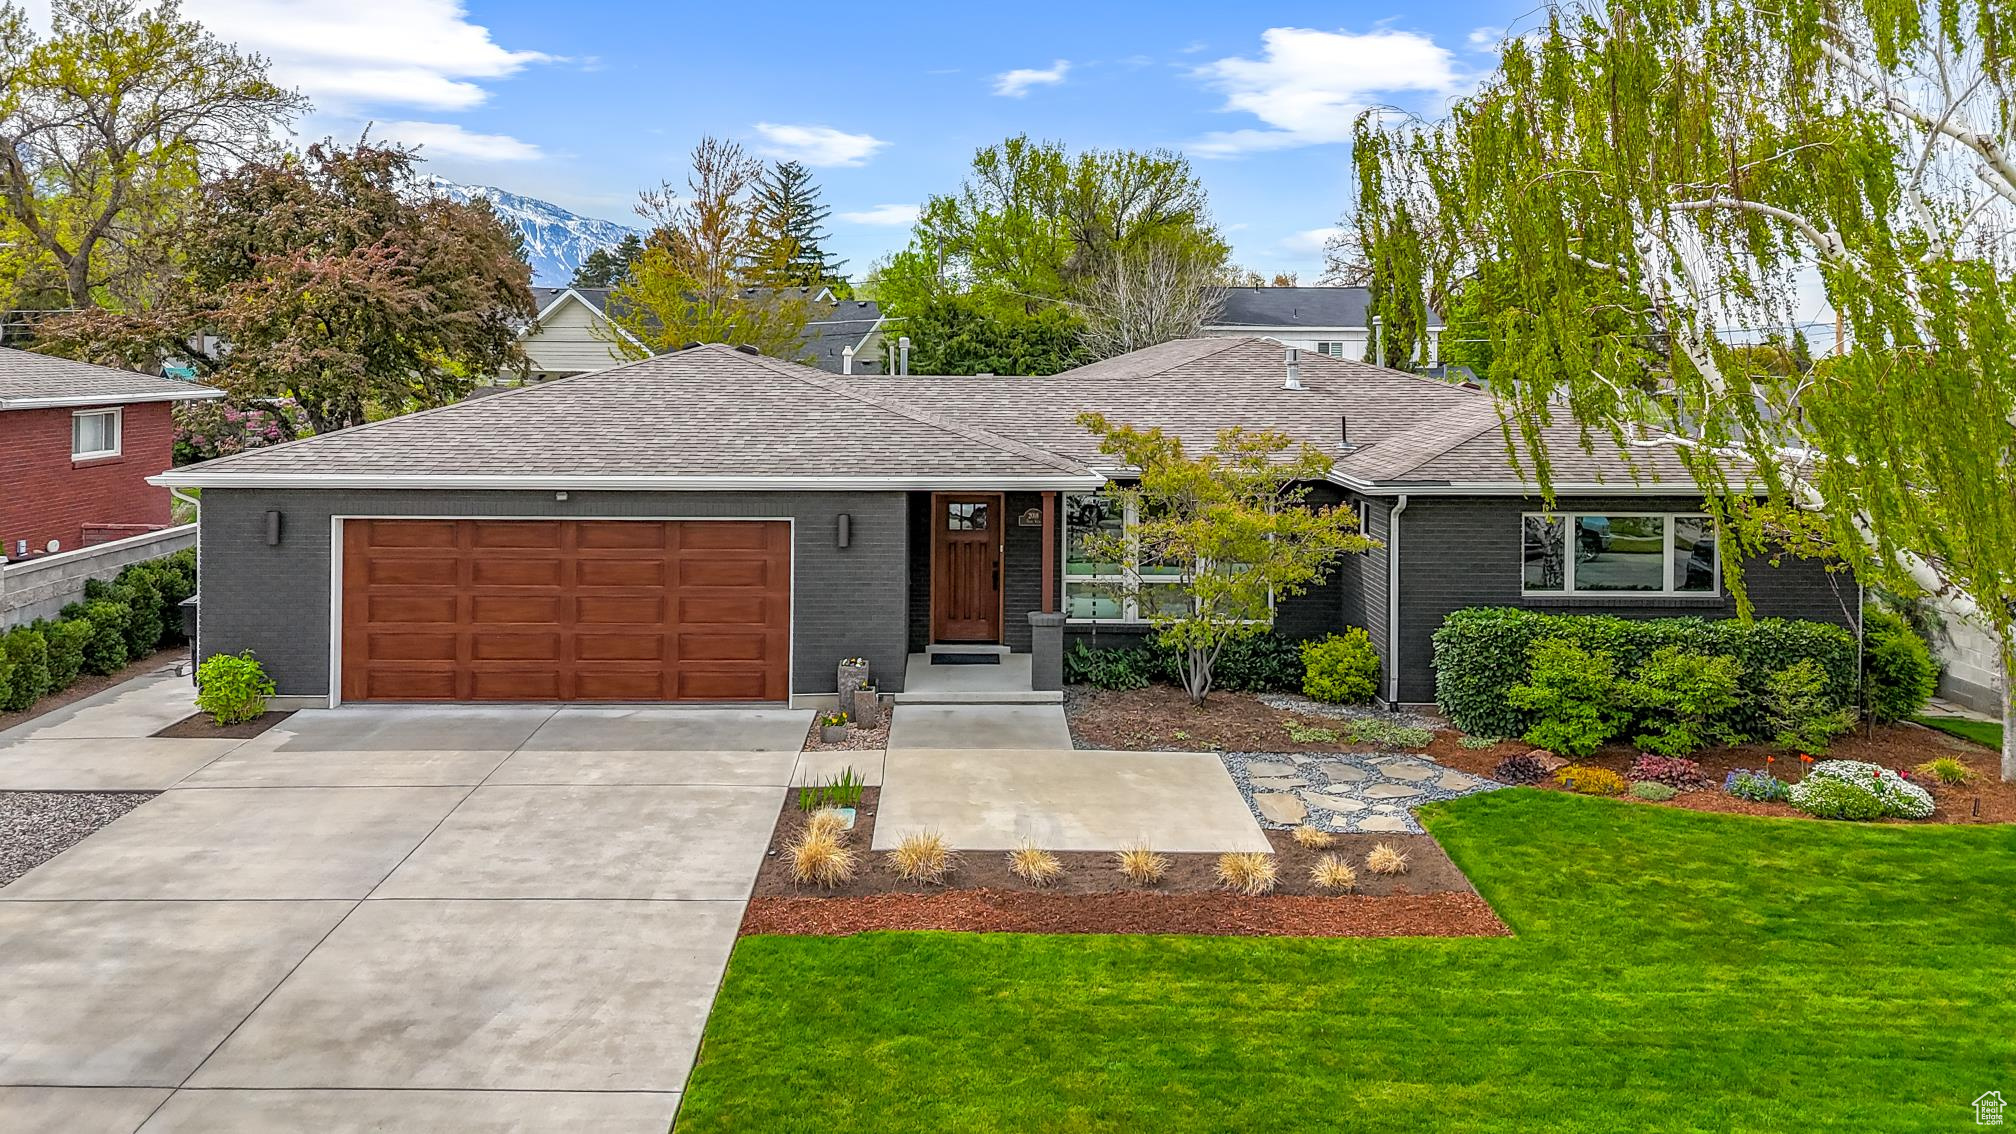
Active
$1,290,000
4
bds
|
4
ba
|
4,053
sqft
|
built
1953
2018 E Twin View Dr, Salt Lake City, UT 84109
$-4,015
Cash flow
-16.2%
Cash-on-Cash Return
2.5%
Cap rate
0.4%
Rent to Value Ratio
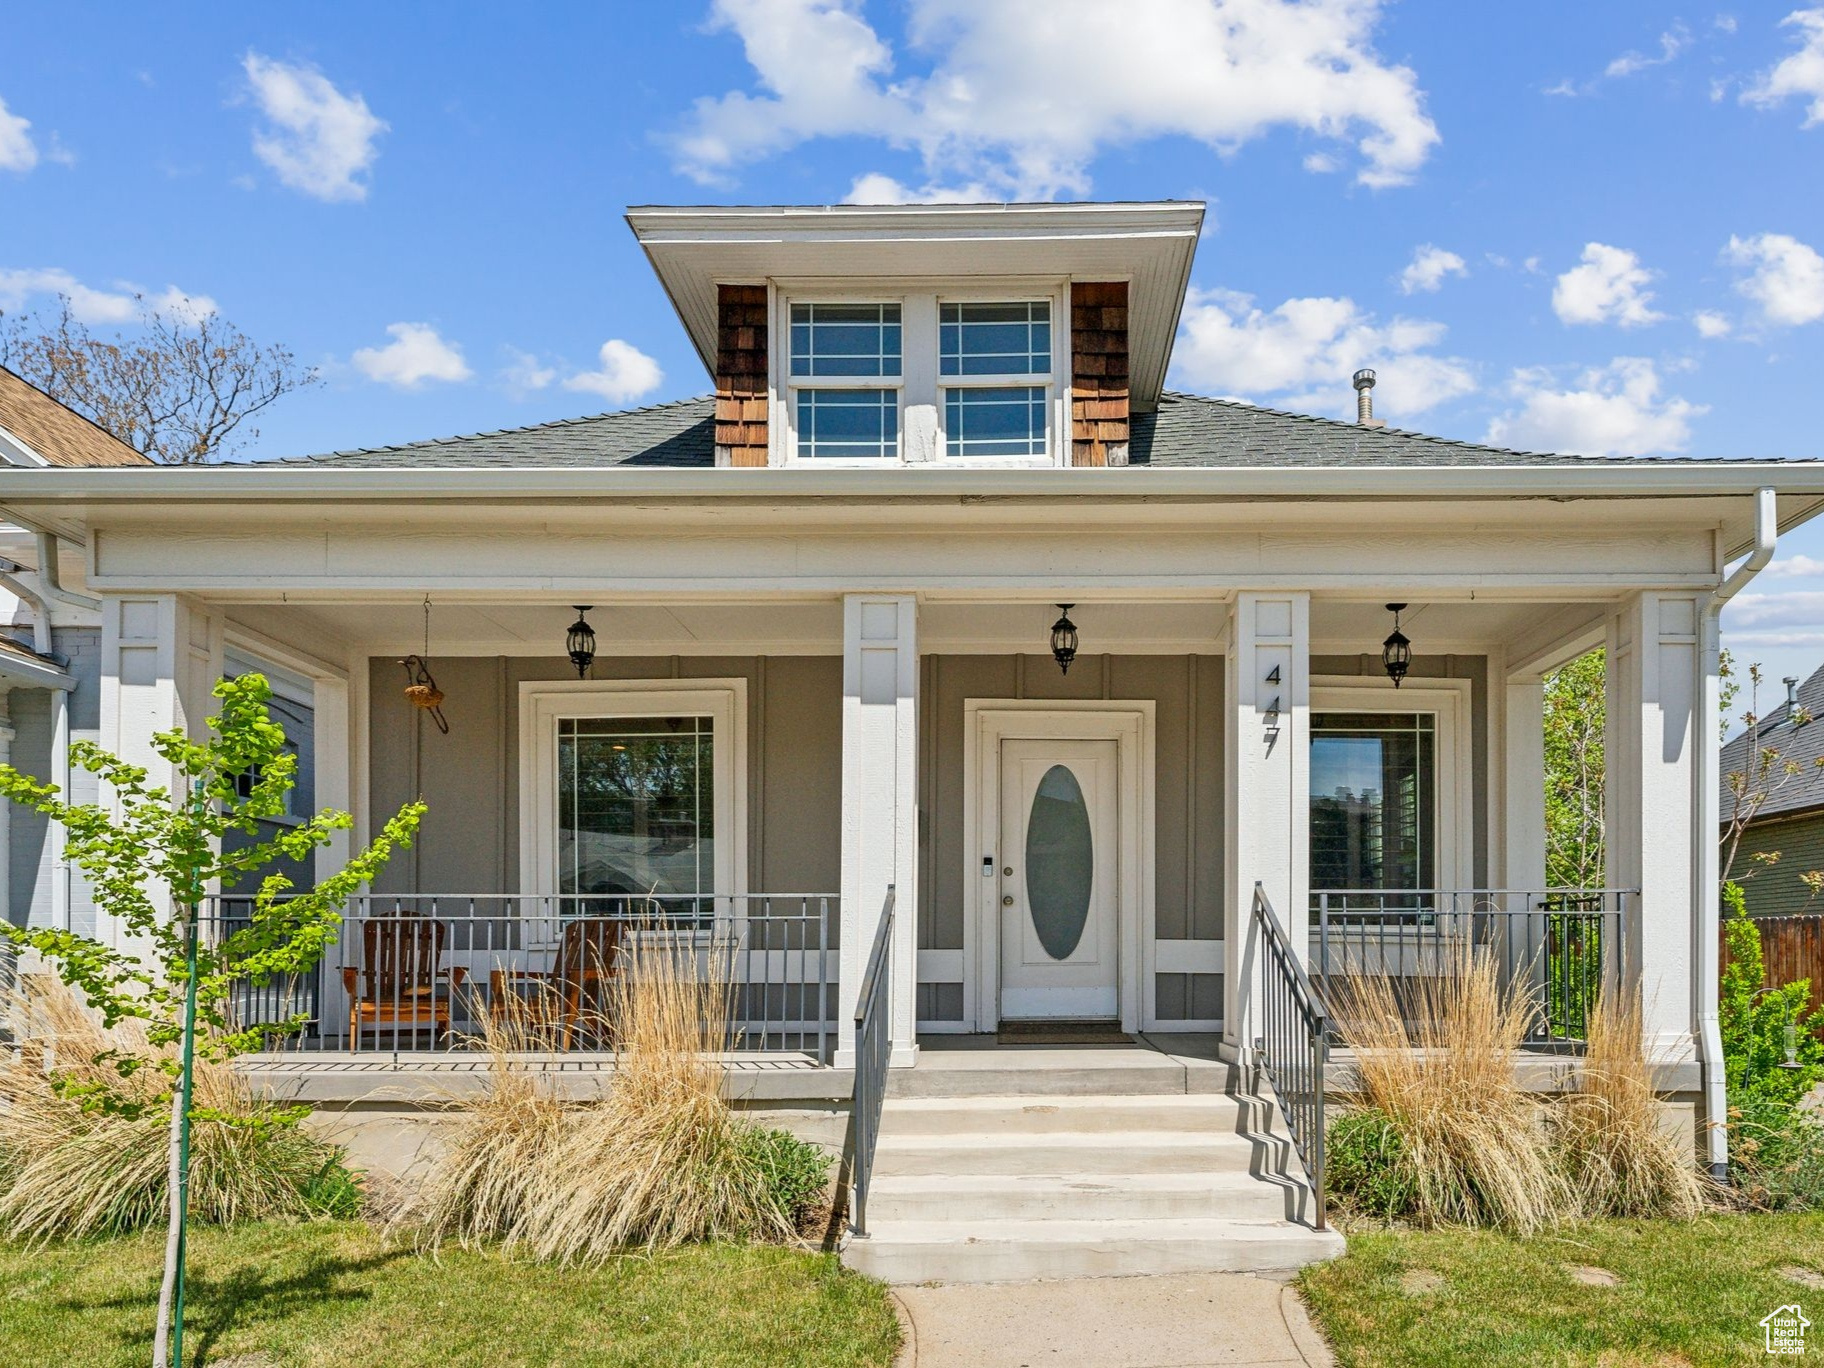
Active under contract
$655,000
3
bds
|
2
ba
|
2,192
sqft
|
built
1906
447 E Westminster Ave, Salt Lake City, UT 84115
$-1,891
Cash flow
-15.1%
Cash-on-Cash Return
2.8%
Cap rate
0.4%
Rent to Value Ratio
Active
$775,000
4
bds
|
4
ba
|
1,634
sqft
|
built
1890
827 E 100 S, Salt Lake City, UT 84102
$-2,326
Cash flow
-15.7%
Cash-on-Cash Return
2.7%
Cap rate
0.4%
Rent to Value Ratio
Active
$499,900
6
bds
|
2
ba
|
2,729
sqft
|
built
1955
4207 W 5655 S, Salt Lake City, UT 84118
$-939
Cash flow
-9.8%
Cash-on-Cash Return
4.0%
Cap rate
0.6%
Rent to Value Ratio
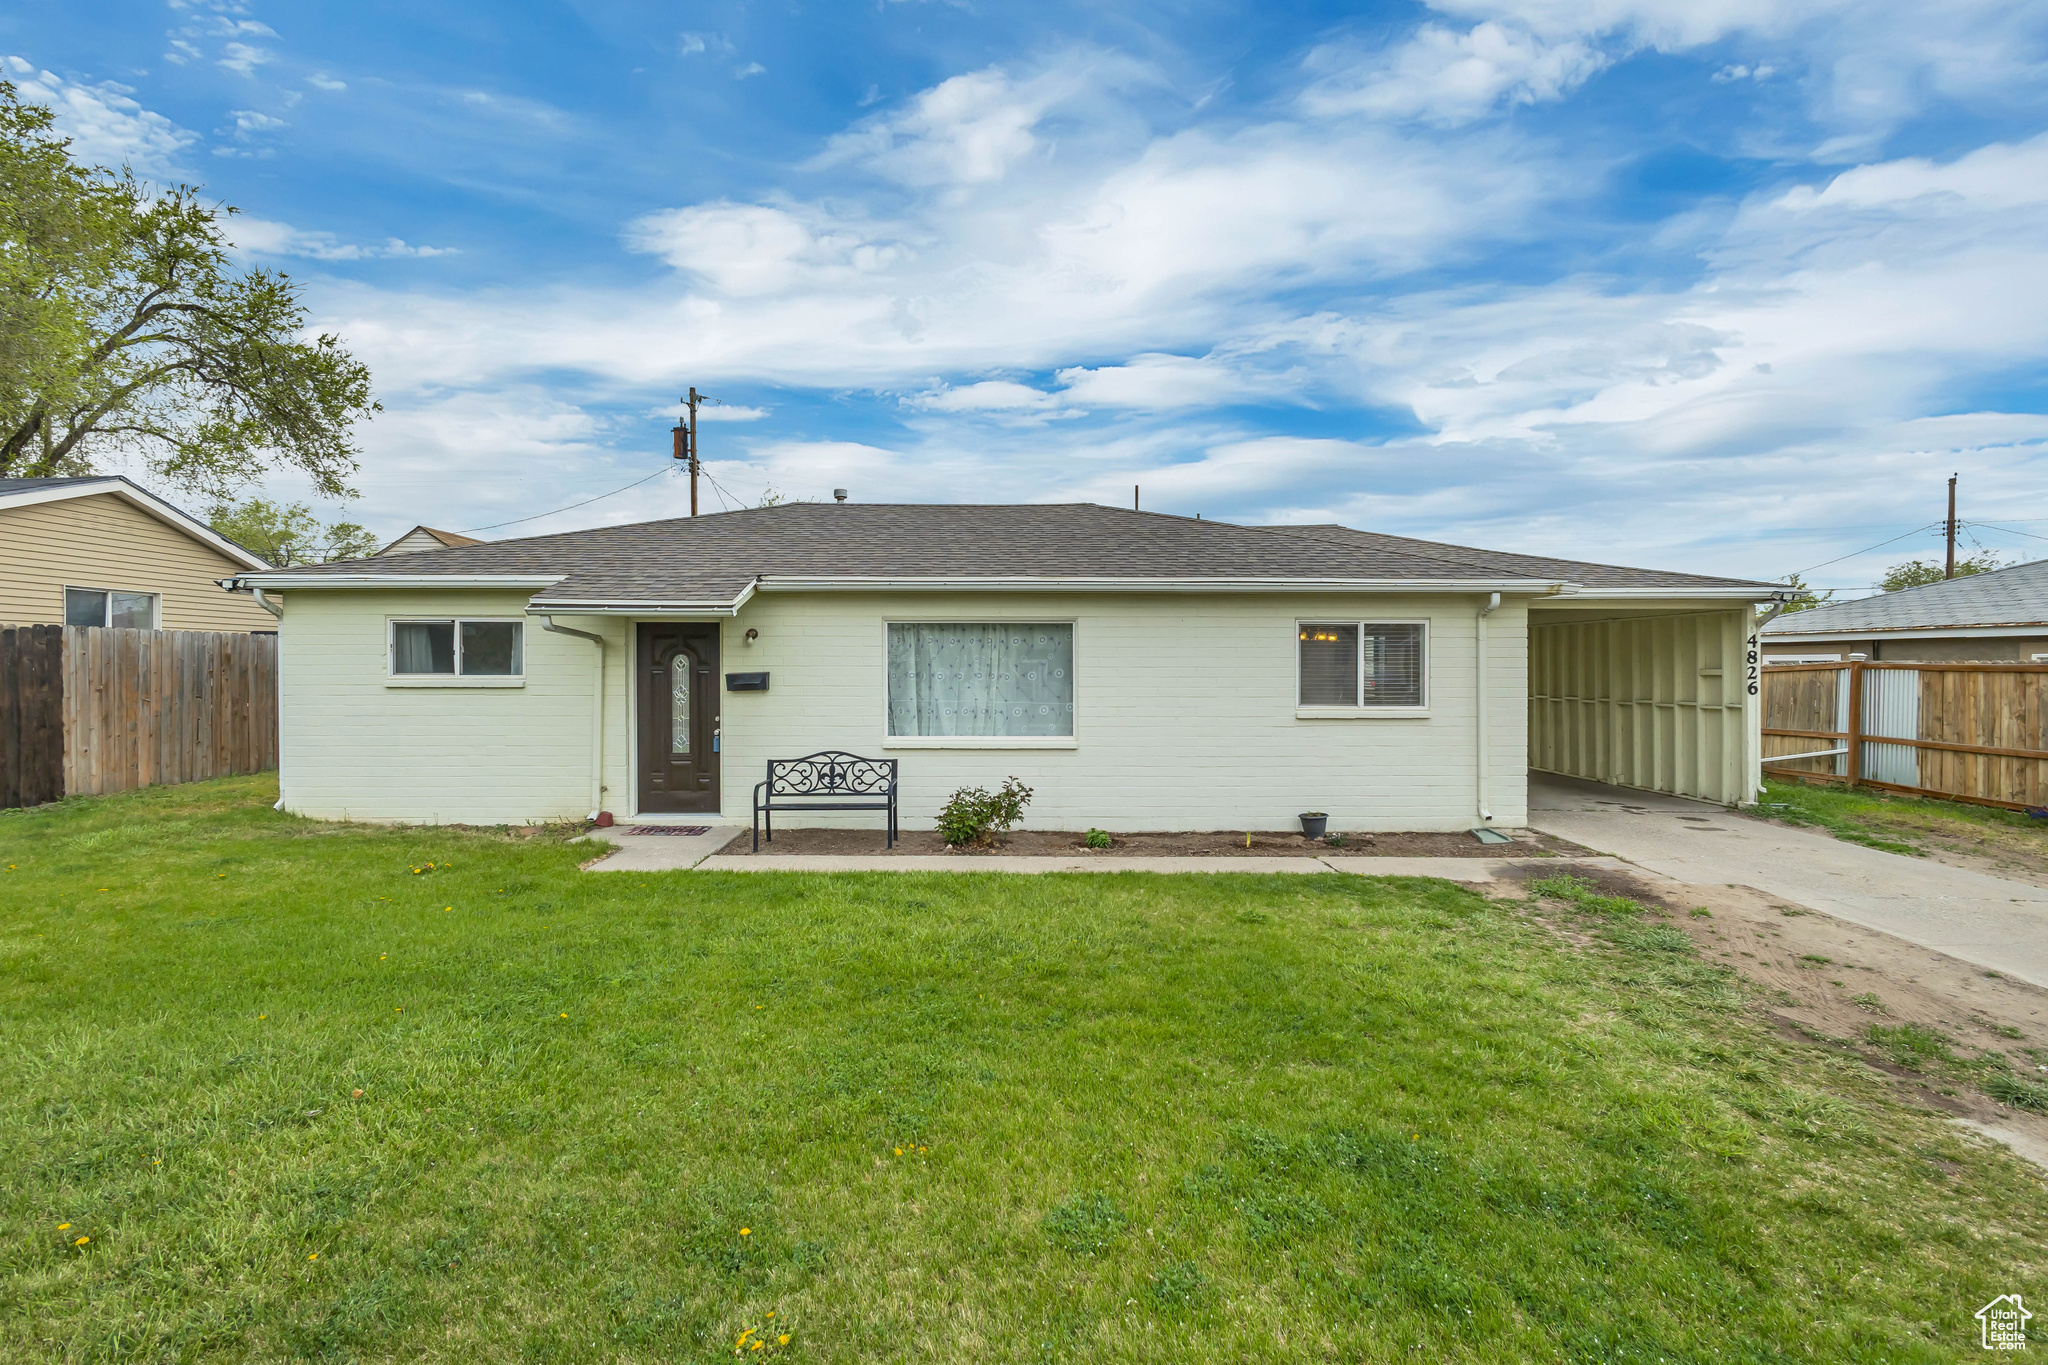
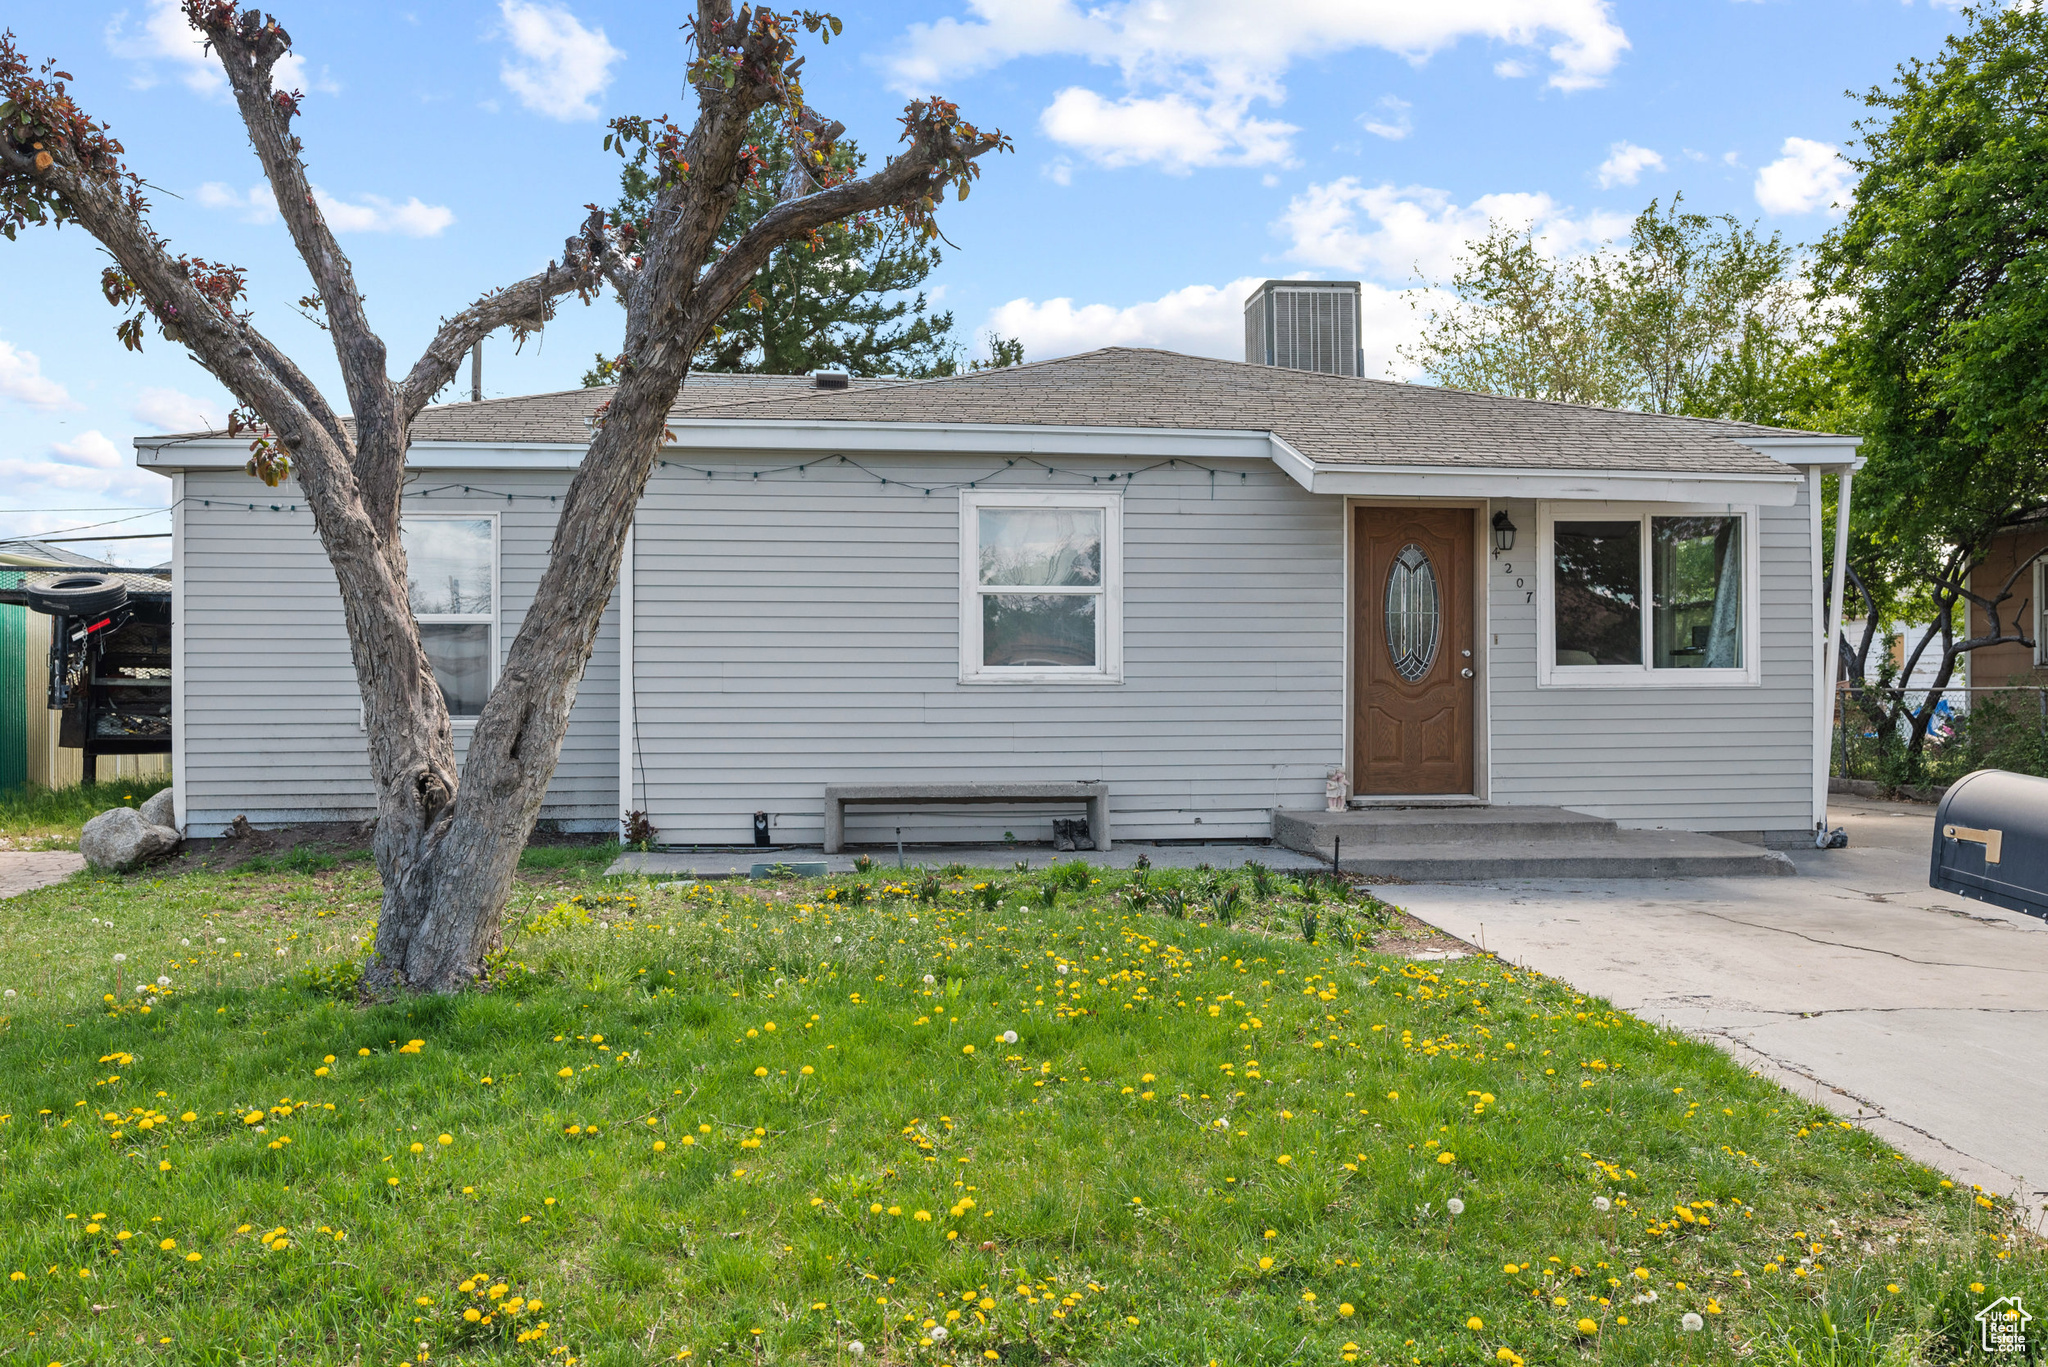
Active
$399,000
3
bds
|
2
ba
|
1,176
sqft
|
built
1954
4826 S 4860 W, Salt Lake City, UT 84118
$-1,204
Cash flow
-15.7%
Cash-on-Cash Return
2.7%
Cap rate
0.4%
Rent to Value Ratio
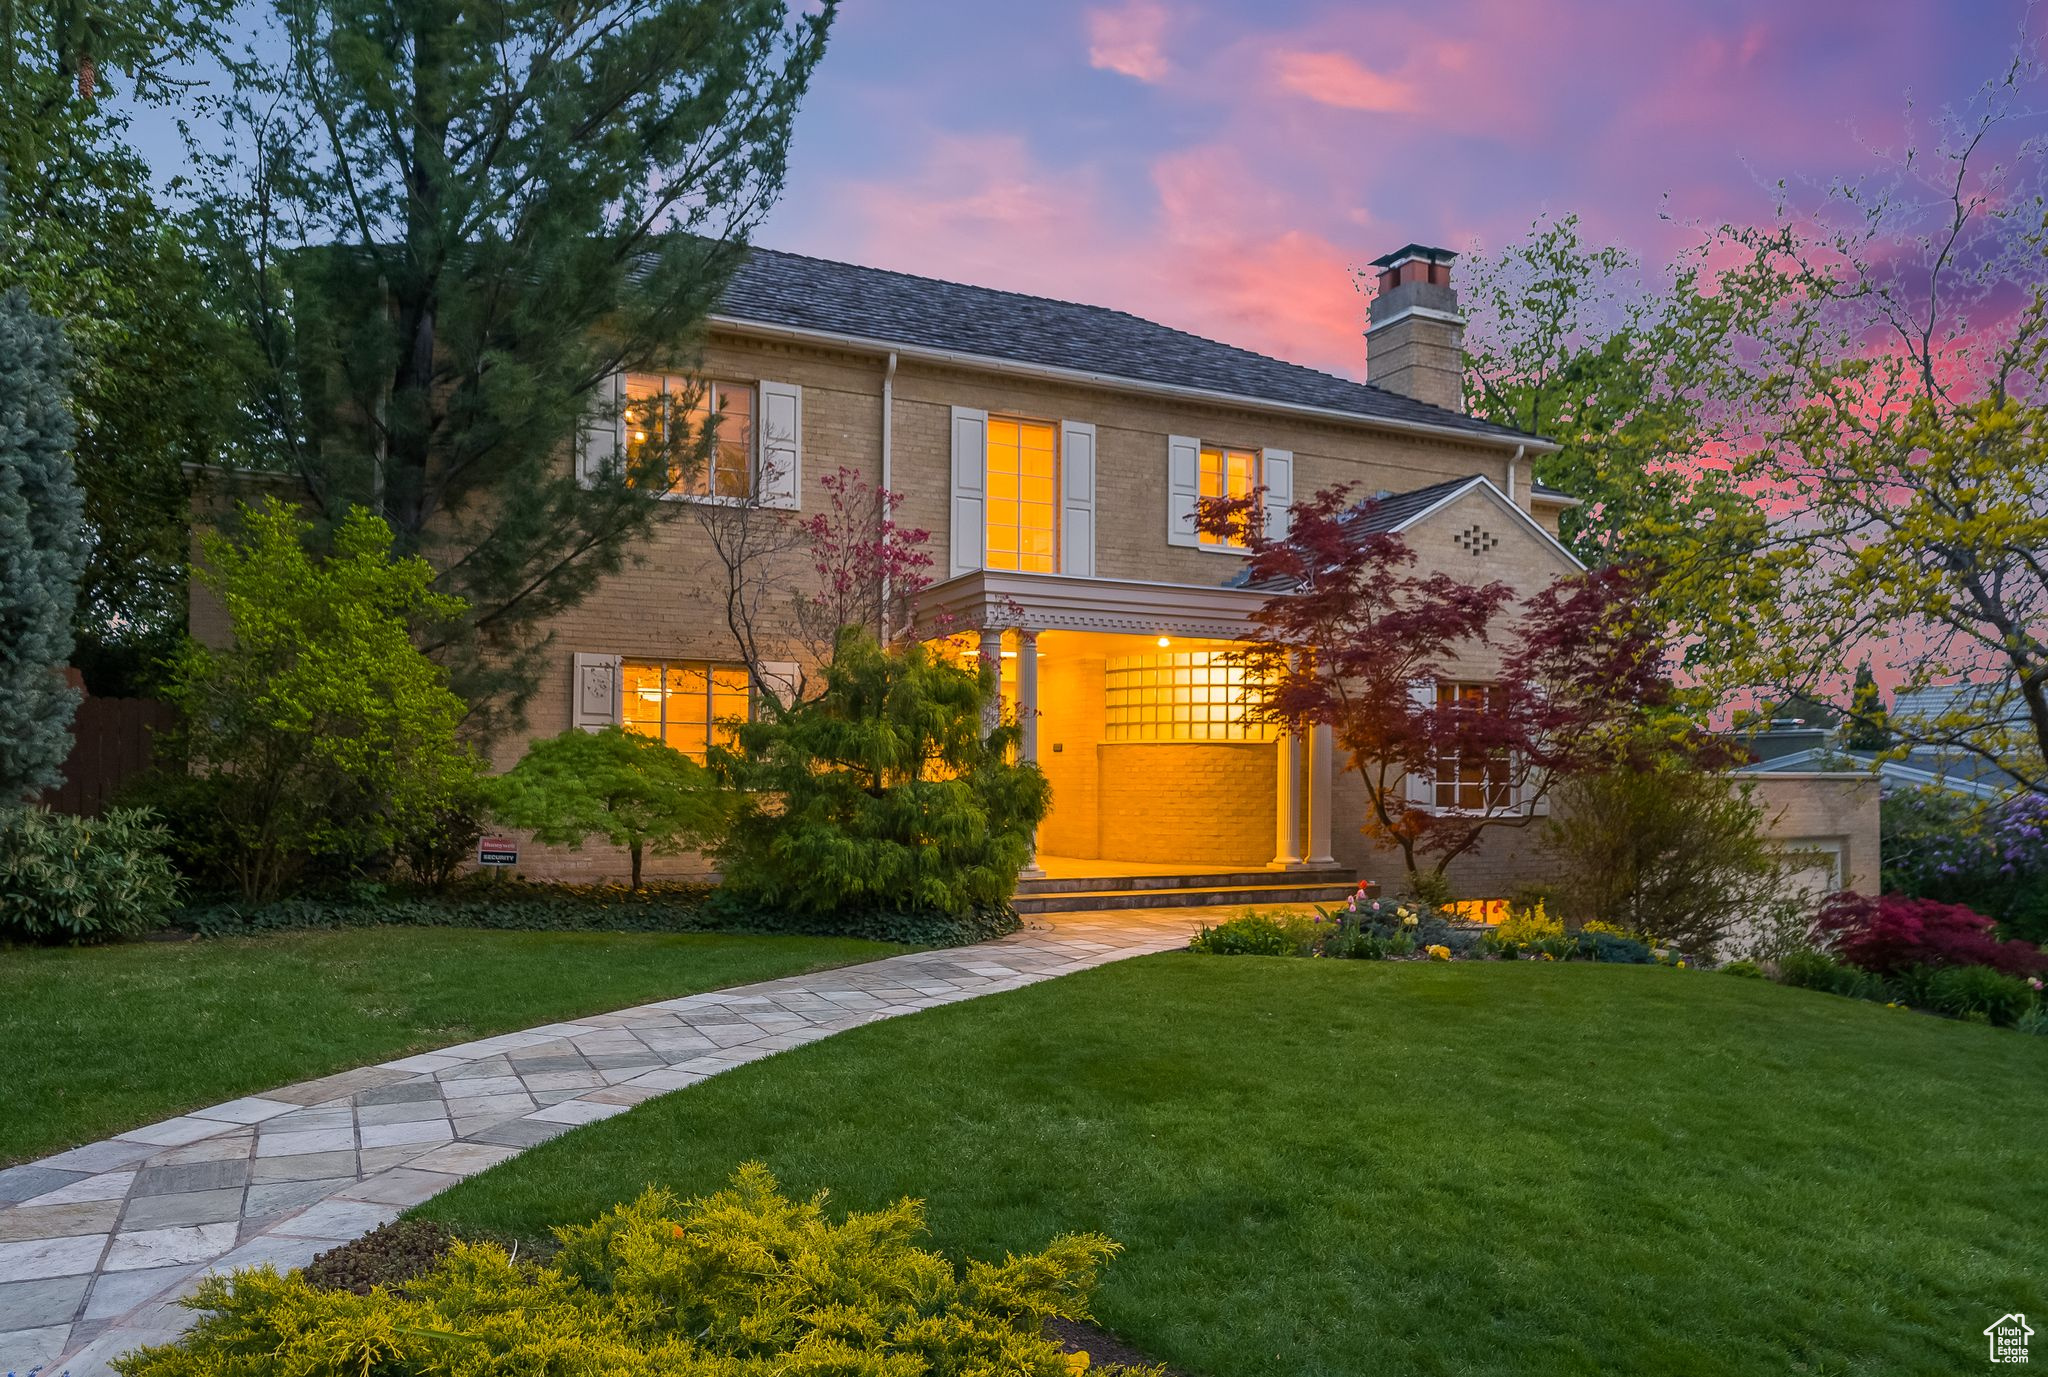
Active
$1,197,000
3
bds
|
3
ba
|
3,443
sqft
|
built
1980
799 Northpoint Ct, Salt Lake City, UT 84103
$-4,063
Cash flow
-17.7%
Cash-on-Cash Return
2.2%
Cap rate
0.4%
Rent to Value Ratio
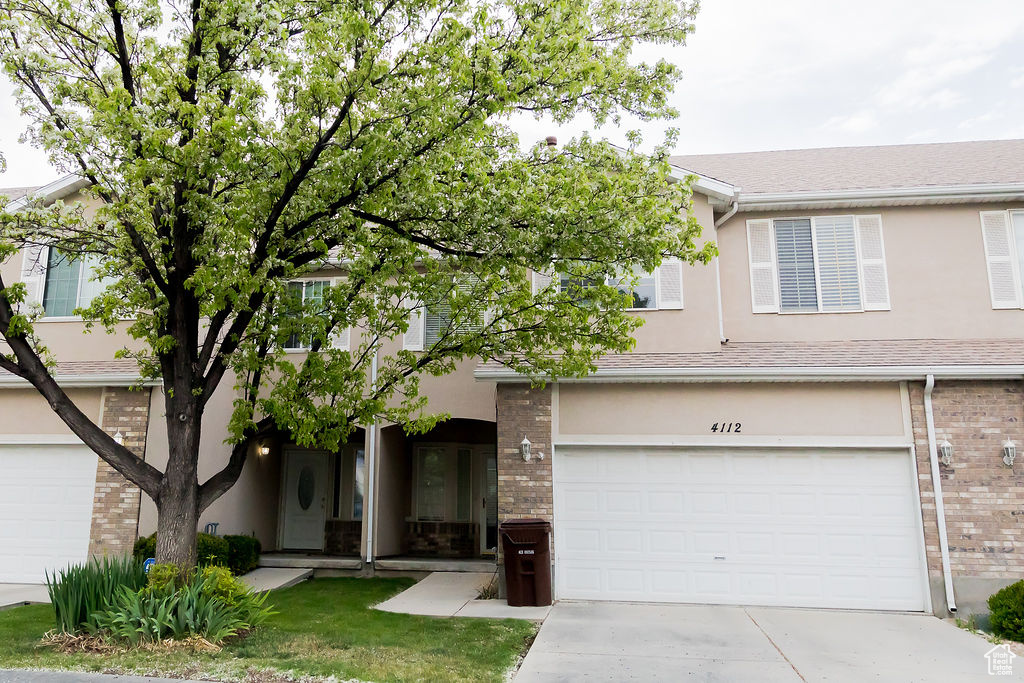
Active
$415,000
3
bds
|
3
ba
|
1,552
sqft
|
built
1999
4112 W 4645 S, Salt Lake City, UT 84120
$-1,208
Cash flow
-15.2%
Cash-on-Cash Return
2.8%
Cap rate
0.5%
Rent to Value Ratio
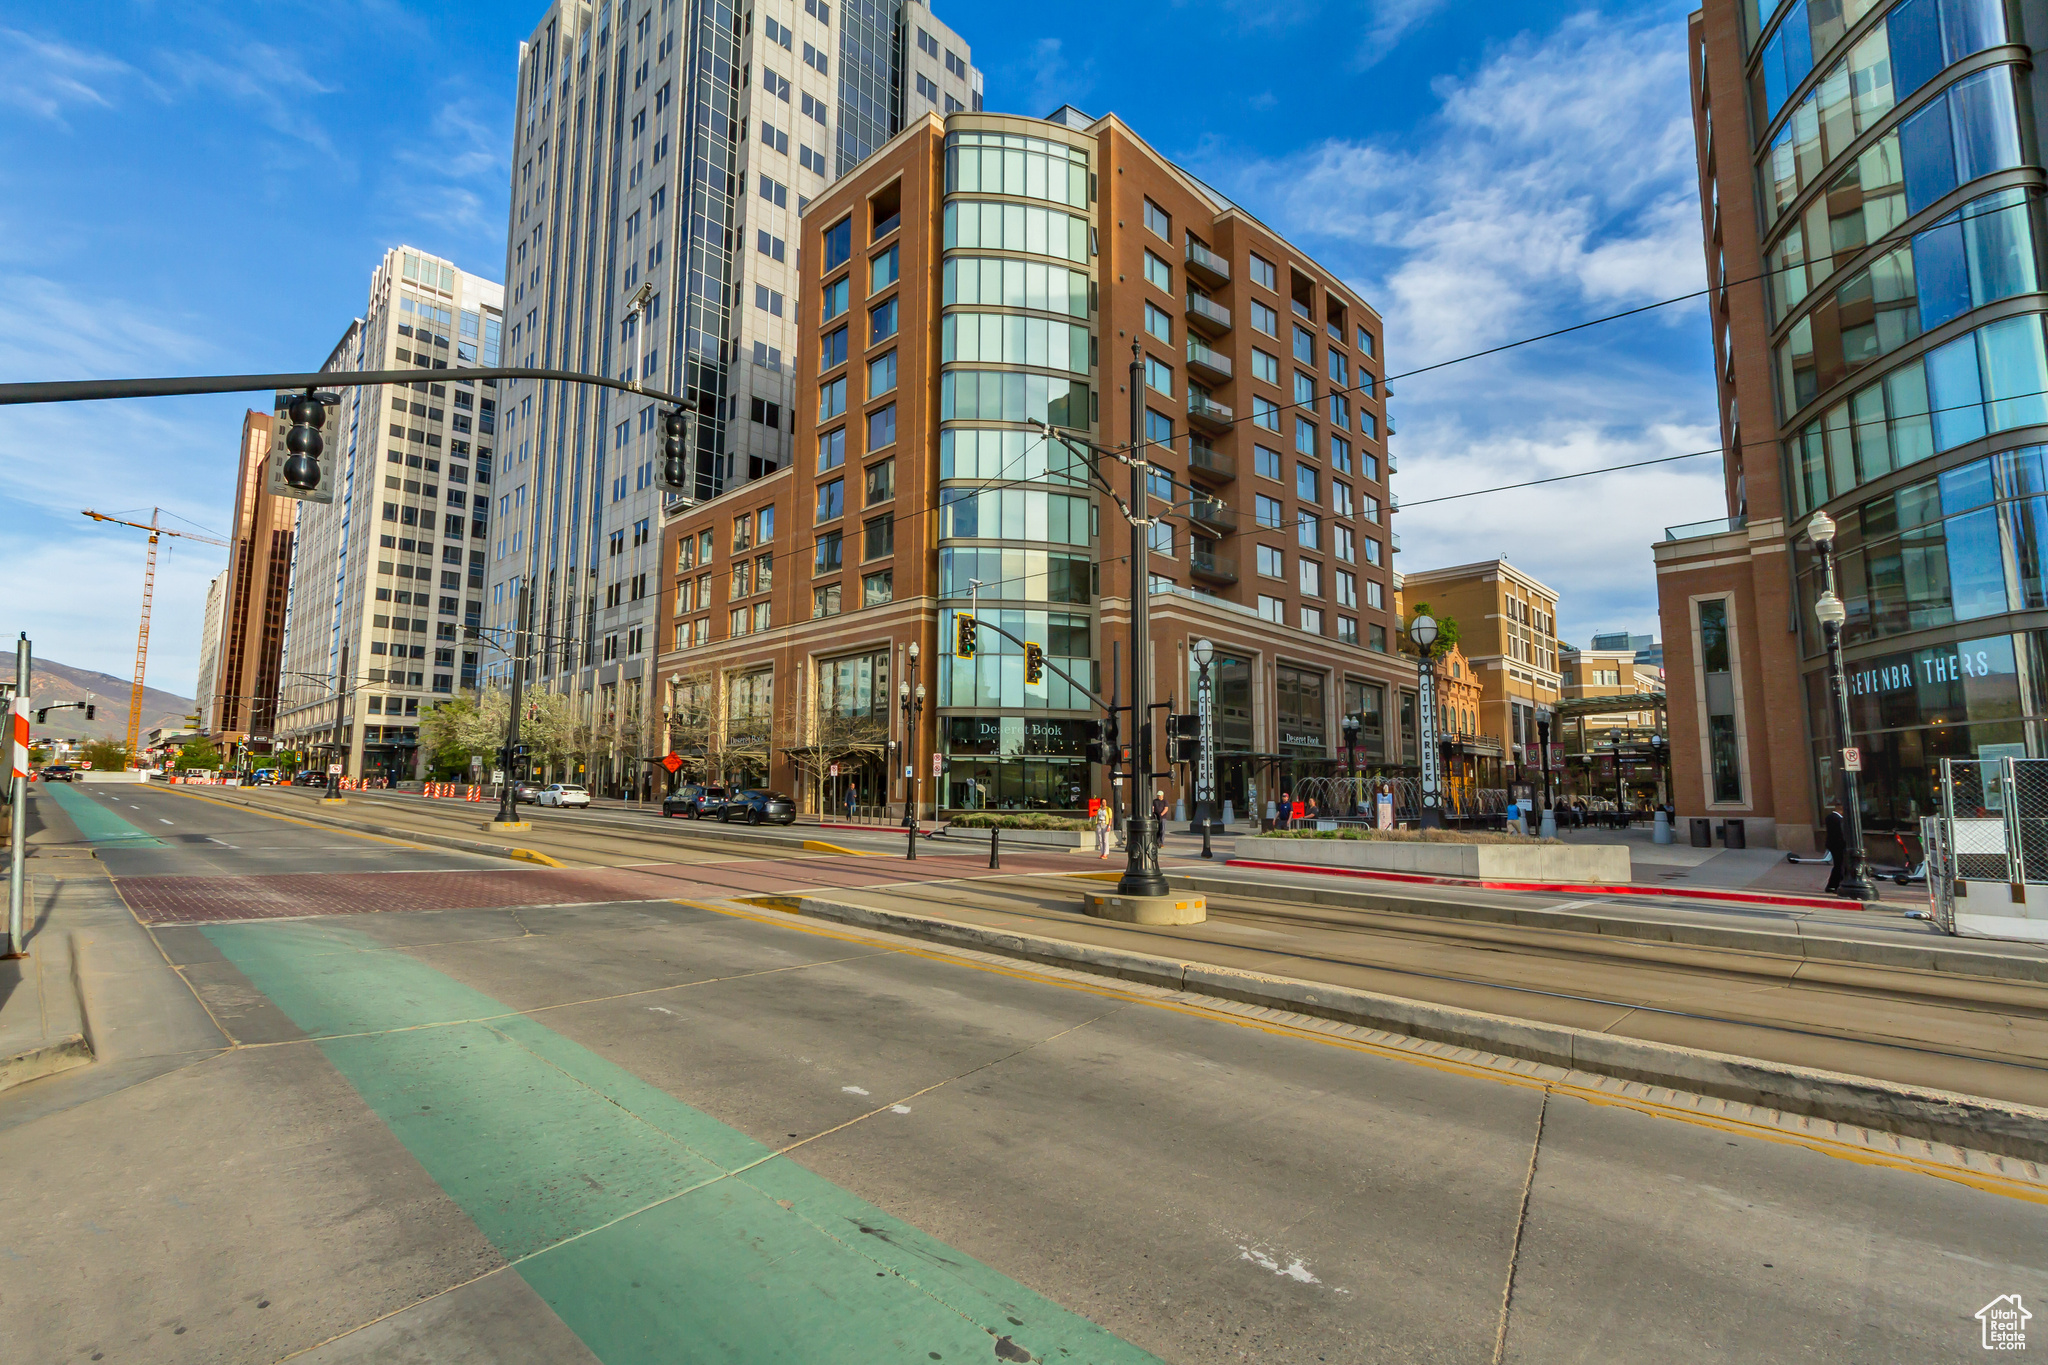
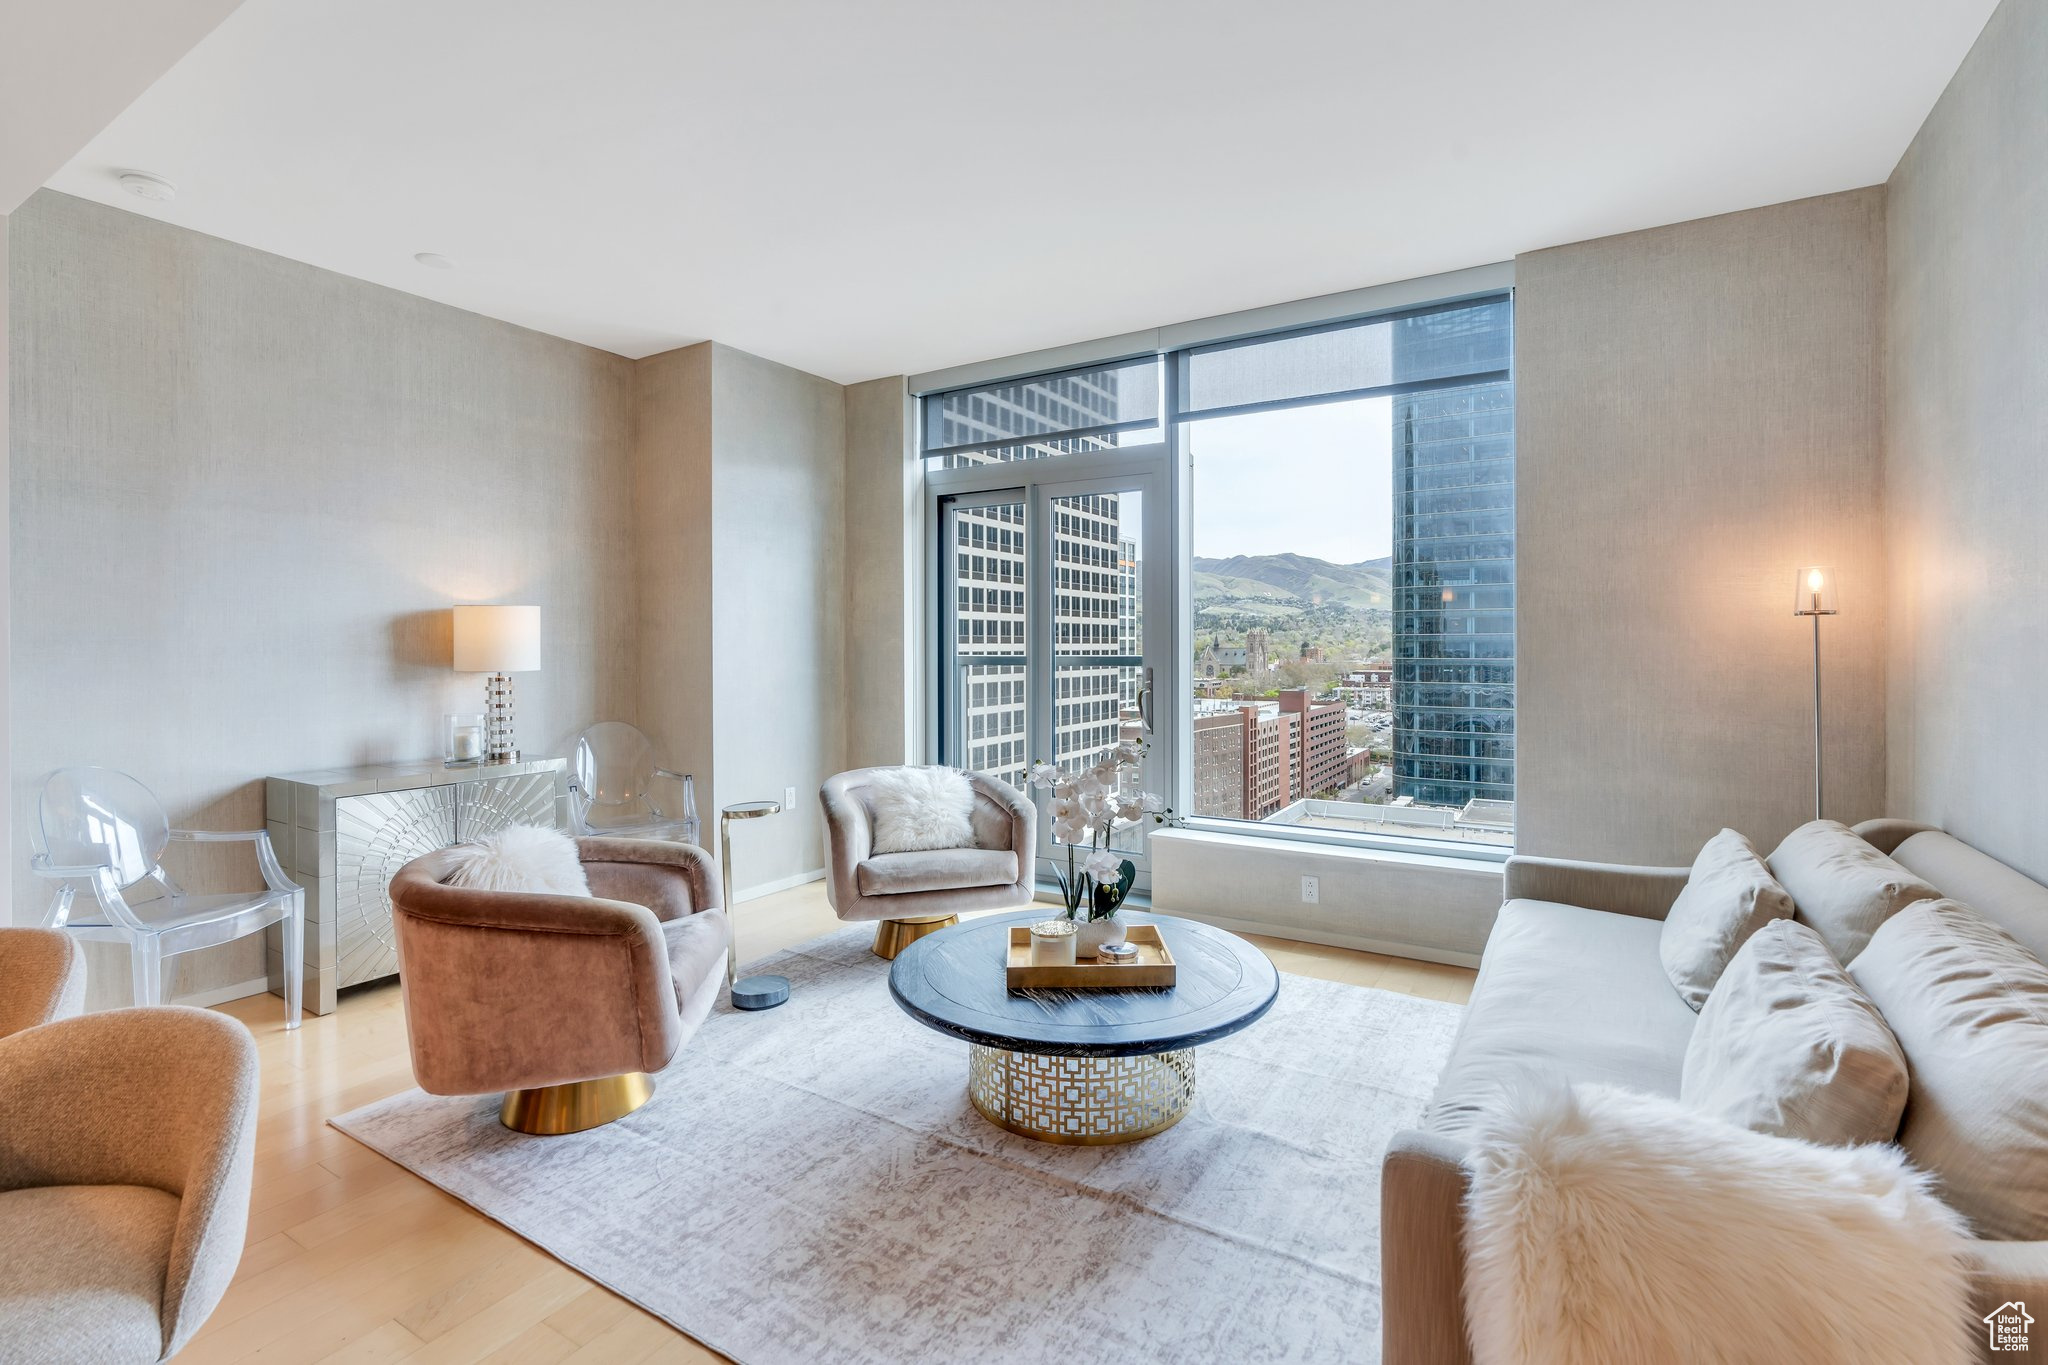
Active
$639,900
1
bds
|
1
ba
|
926
sqft
|
built
2010
45 W South Temple, Salt Lake City, UT 84101
$-2,658
Cash flow
-21.7%
Cash-on-Cash Return
1.3%
Cap rate
0.4%
Rent to Value Ratio
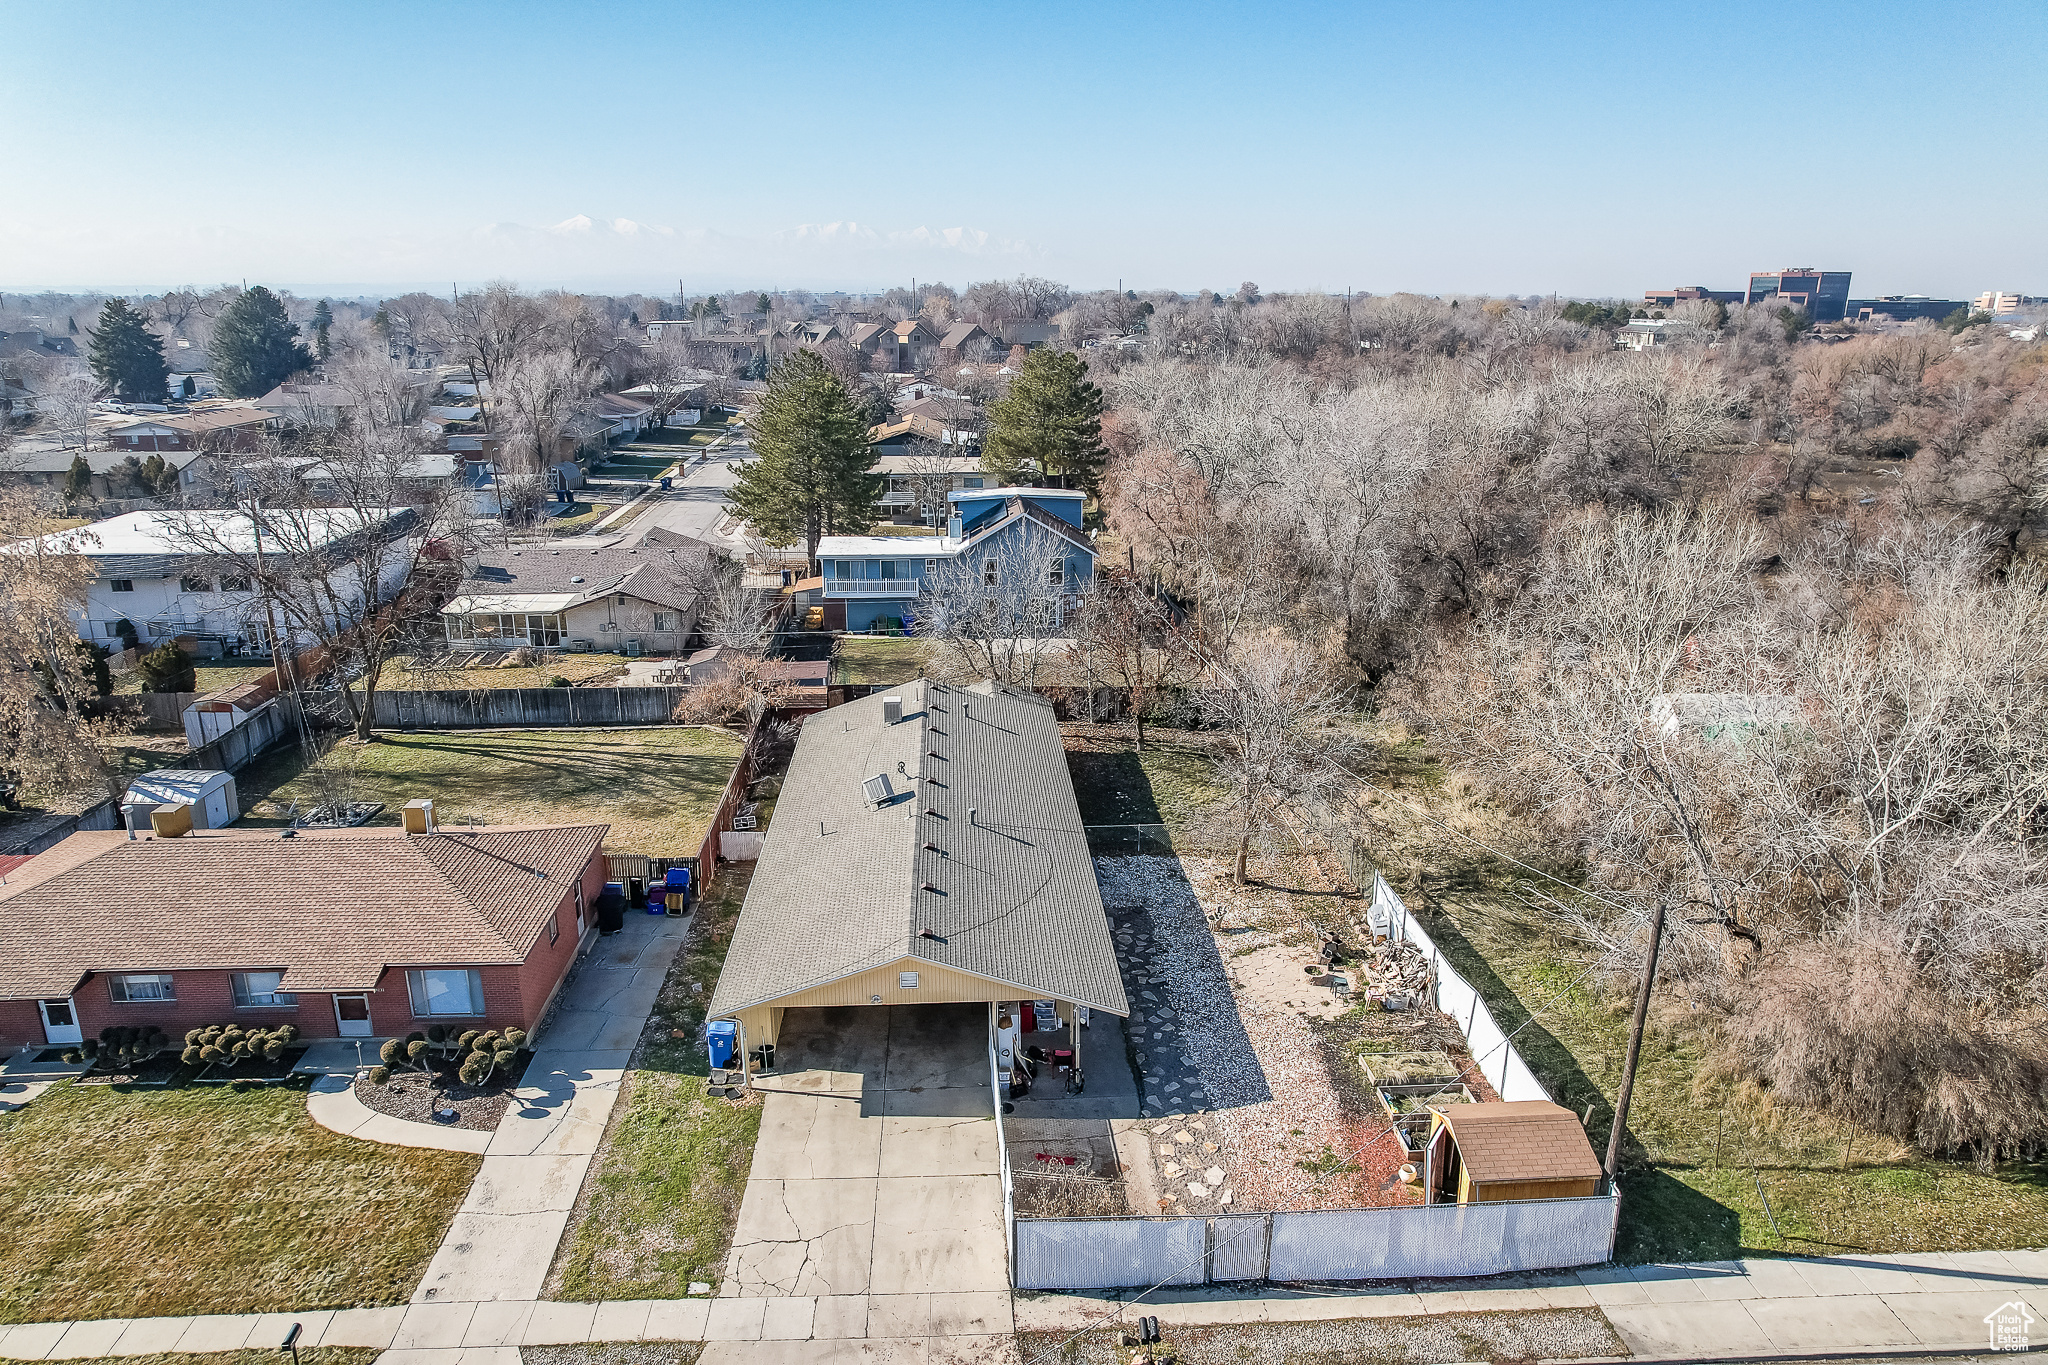
Active
$799,000
4
bds
|
2
ba
|
1,800
sqft
|
built
1964
4222 S 1100 E, Salt Lake City, UT 84124
$-2,692
Cash flow
-17.6%
Cash-on-Cash Return
2.2%
Cap rate
0.3%
Rent to Value Ratio
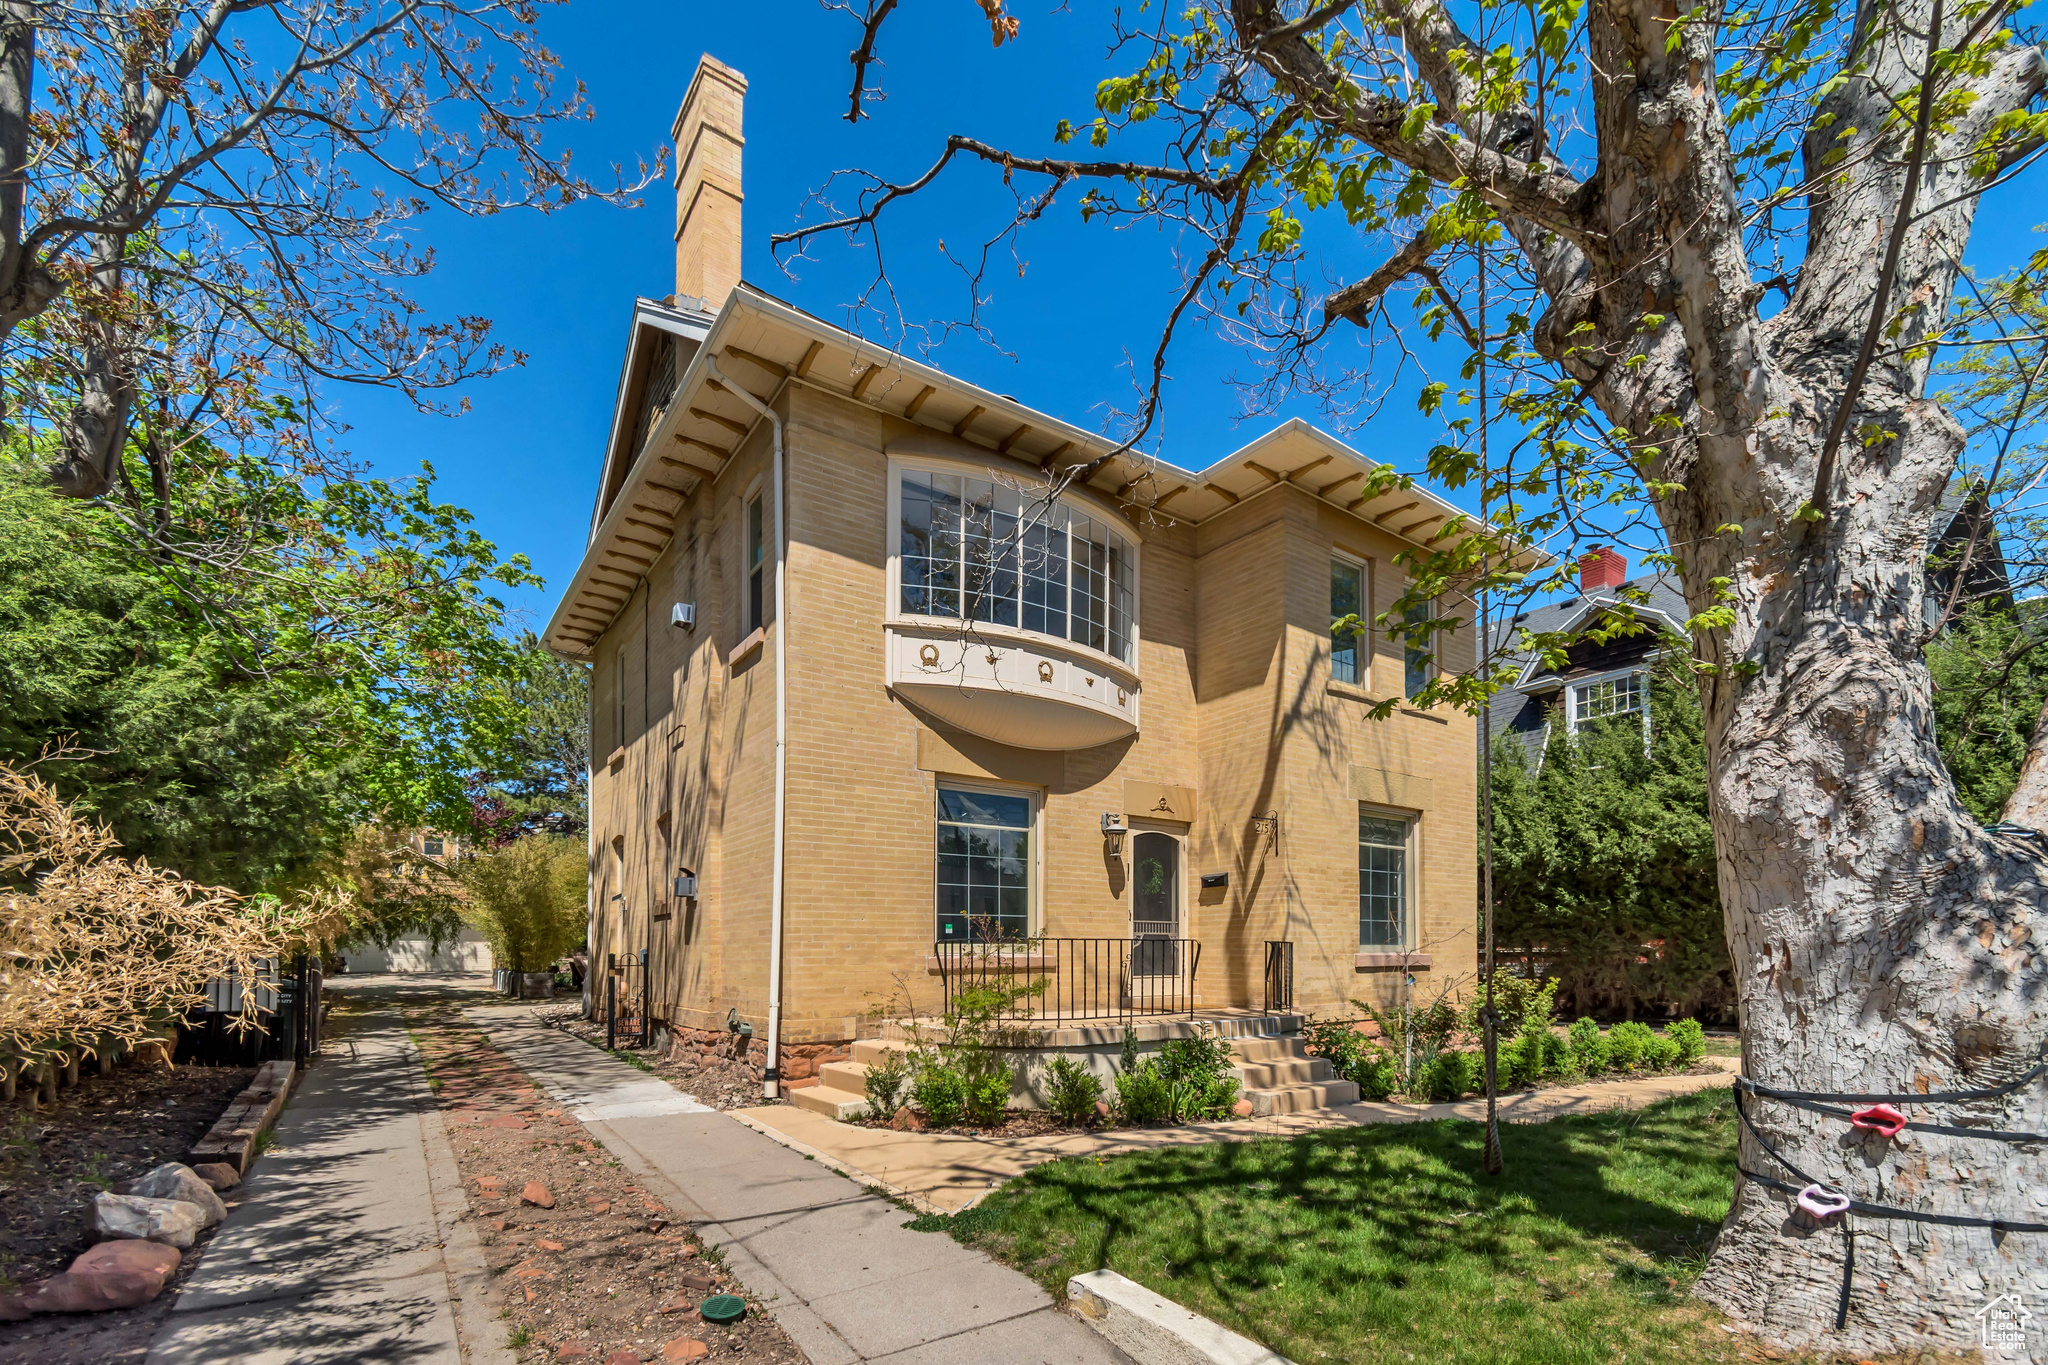
Active
$1,250,000
6
bds
|
4
ba
|
4,010
sqft
|
built
1901
215 E 2nd Ave, Salt Lake City, UT 84103
$-2,808
Cash flow
-11.7%
Cash-on-Cash Return
3.6%
Cap rate
0.5%
Rent to Value Ratio
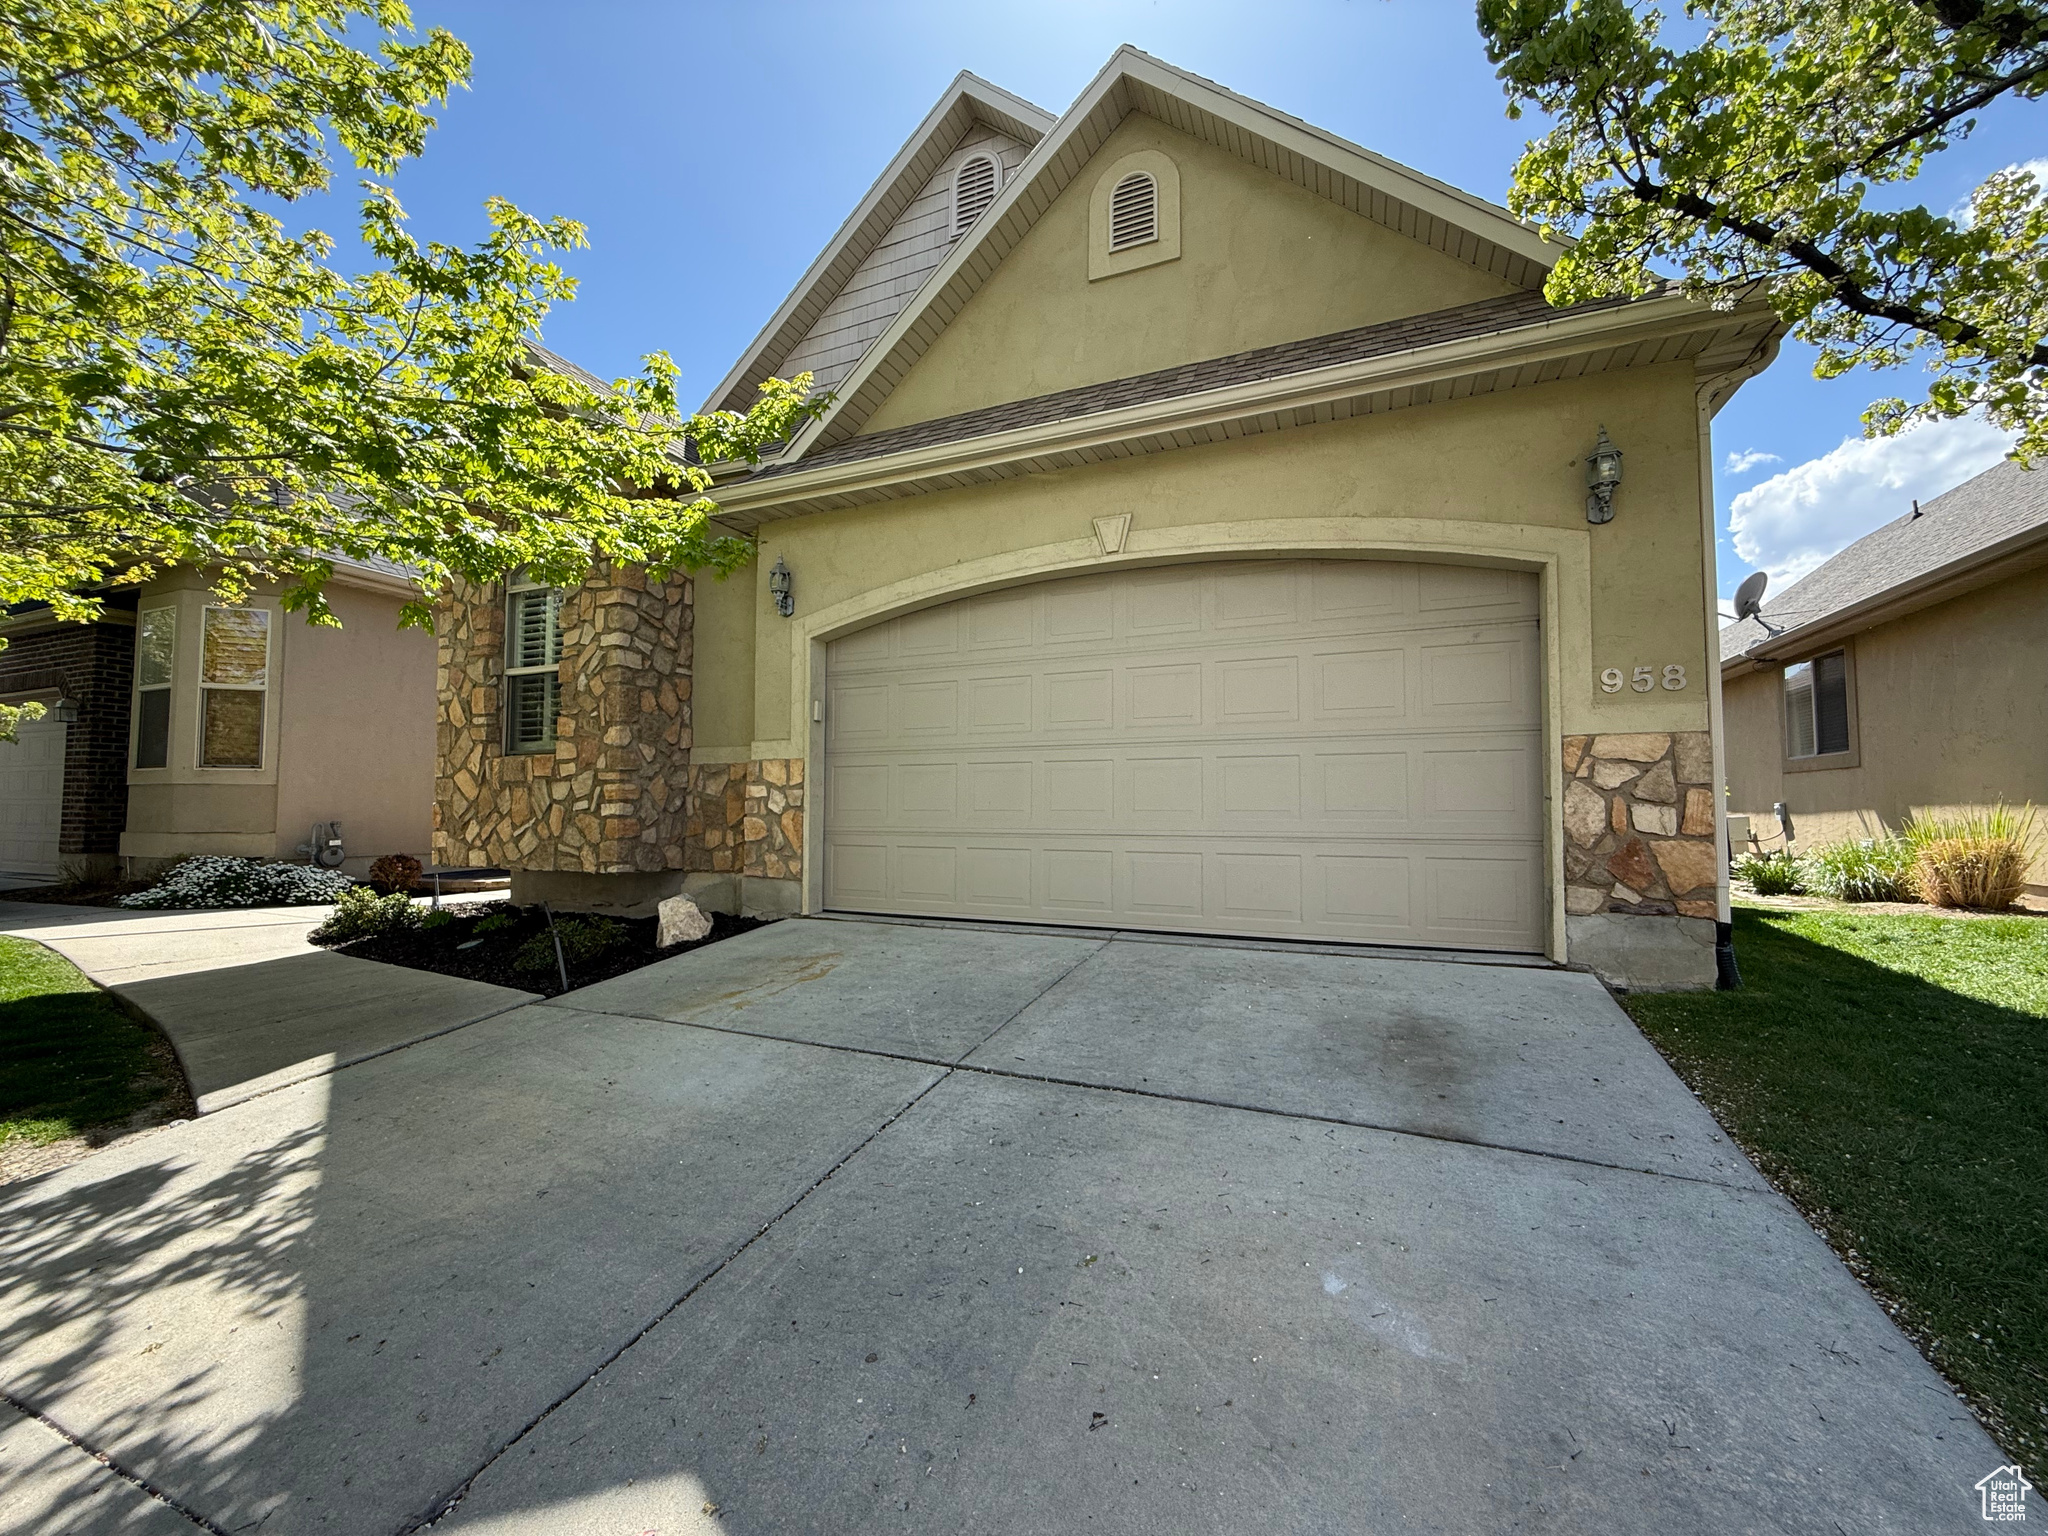
Active
$774,900
4
bds
|
3
ba
|
2,793
sqft
|
built
2004
958 E Montana Vista Ln, Salt Lake City, UT 84124
$-3,180
Cash flow
-21.4%
Cash-on-Cash Return
1.4%
Cap rate
0.3%
Rent to Value Ratio

Active
$1,950,000
3
bds
|
4
ba
|
5,498
sqft
|
built
2000
152 N Silver Oak Rd, Salt Lake City, UT 84108
$-8,402
Cash flow
-22.5%
Cash-on-Cash Return
1.1%
Cap rate
0.2%
Rent to Value Ratio
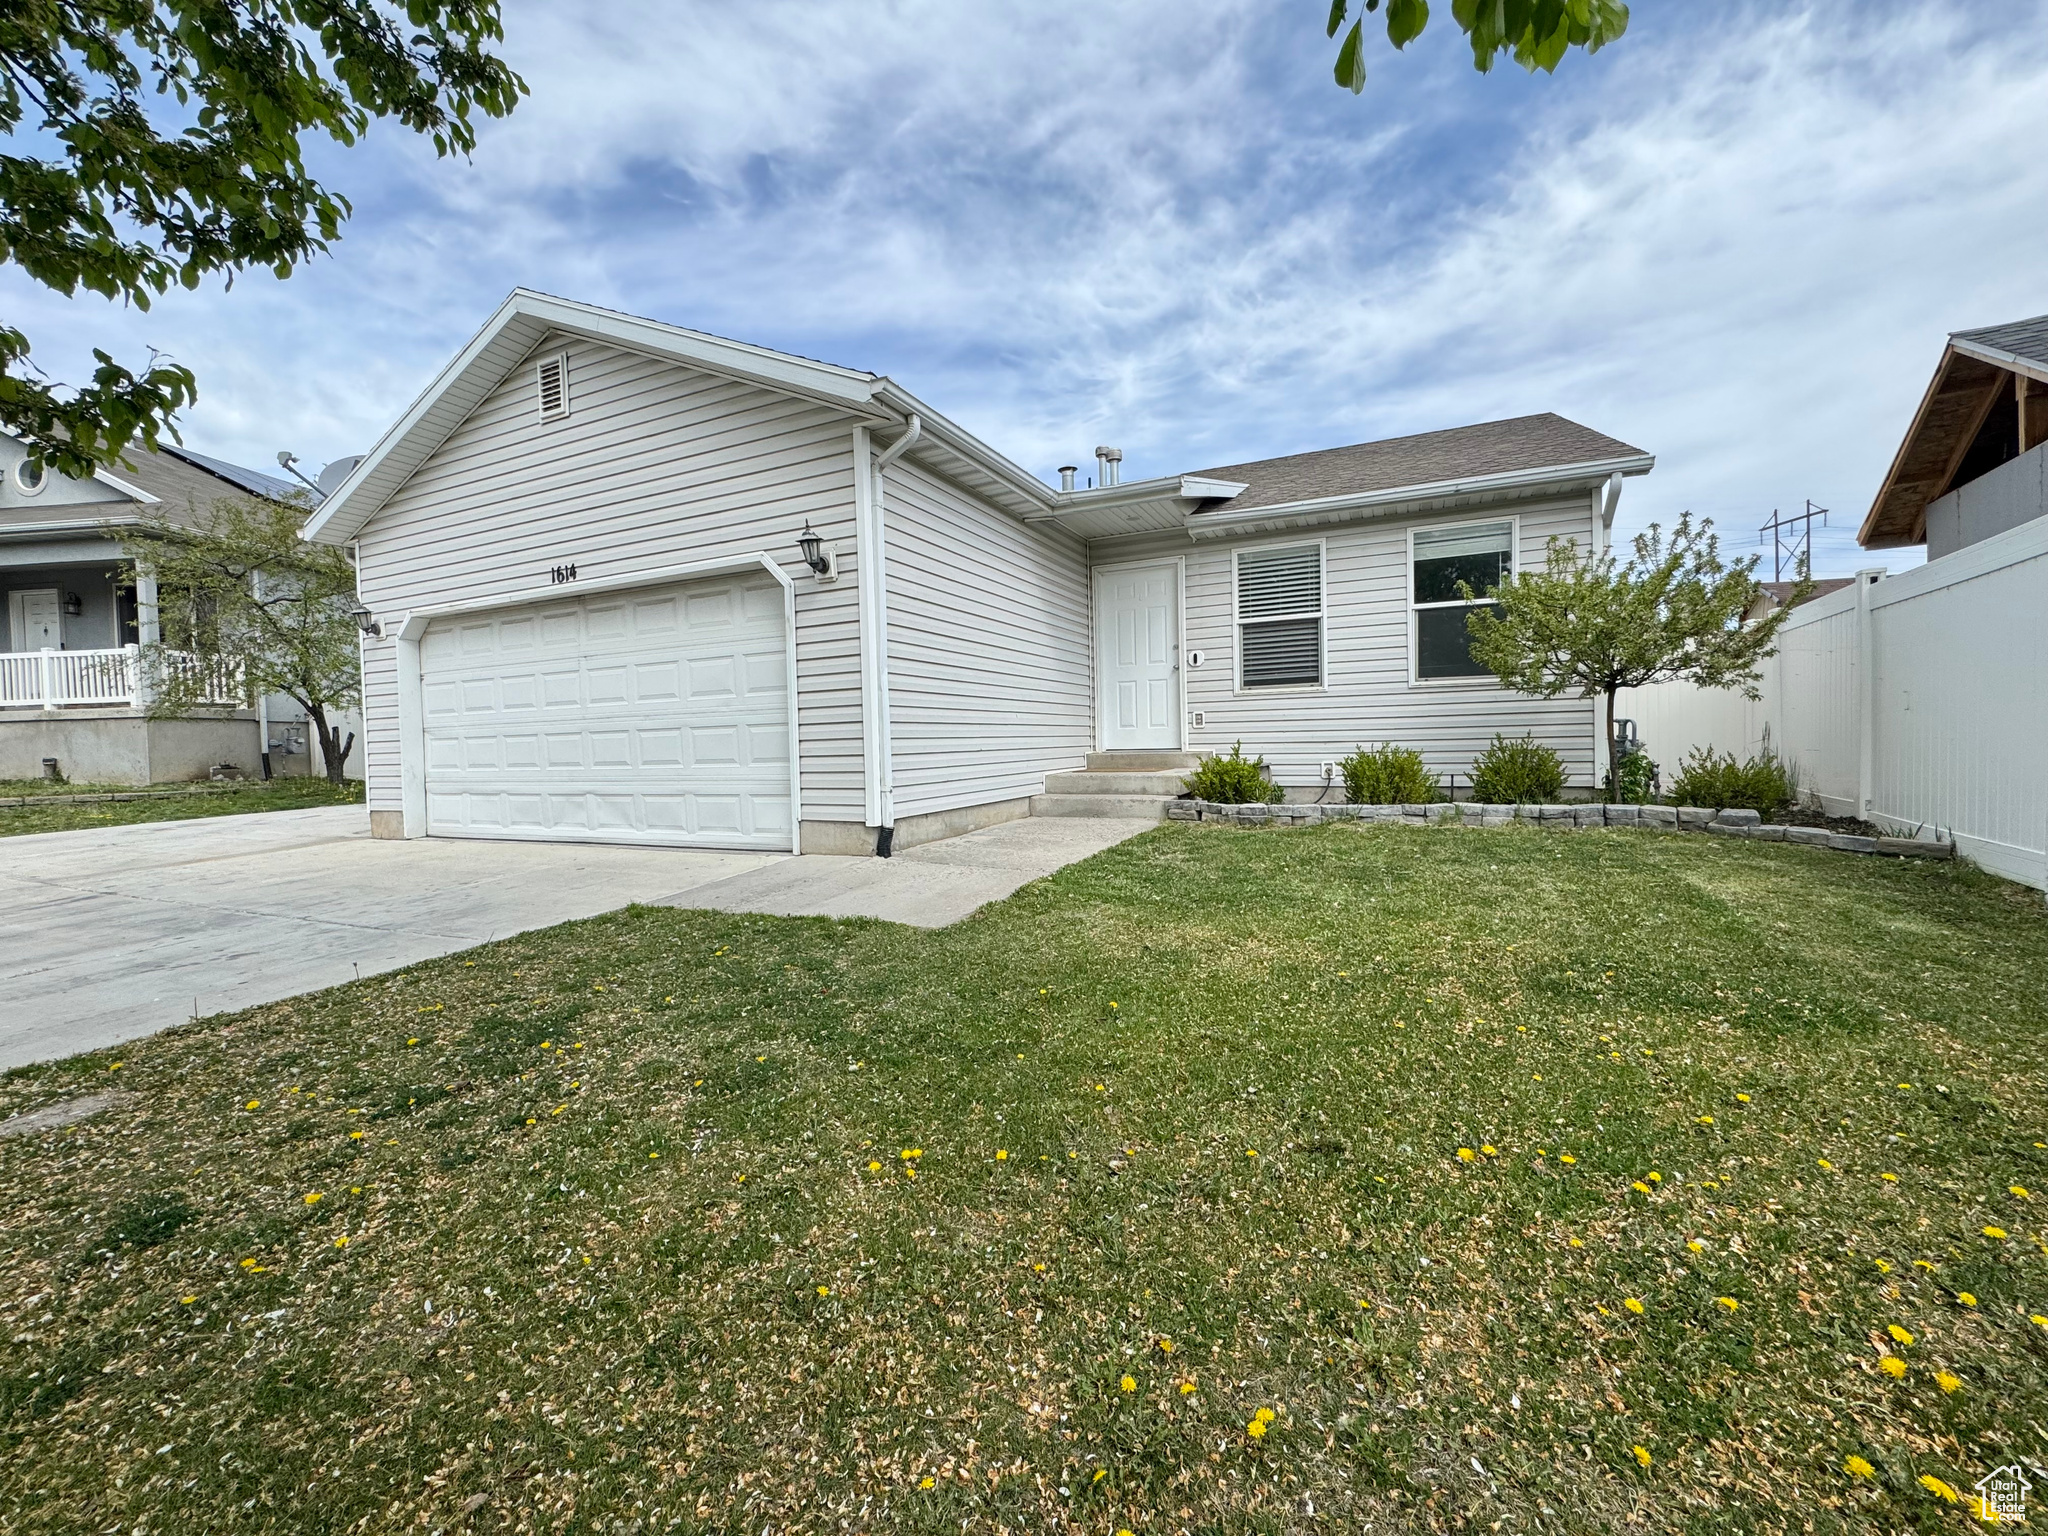
Active
$449,900
3
bds
|
2
ba
|
989
sqft
|
built
2006
1614 W Eisenhower Way, Salt Lake City, UT 84104
$-1,108
Cash flow
-12.8%
Cash-on-Cash Return
3.3%
Cap rate
0.4%
Rent to Value Ratio
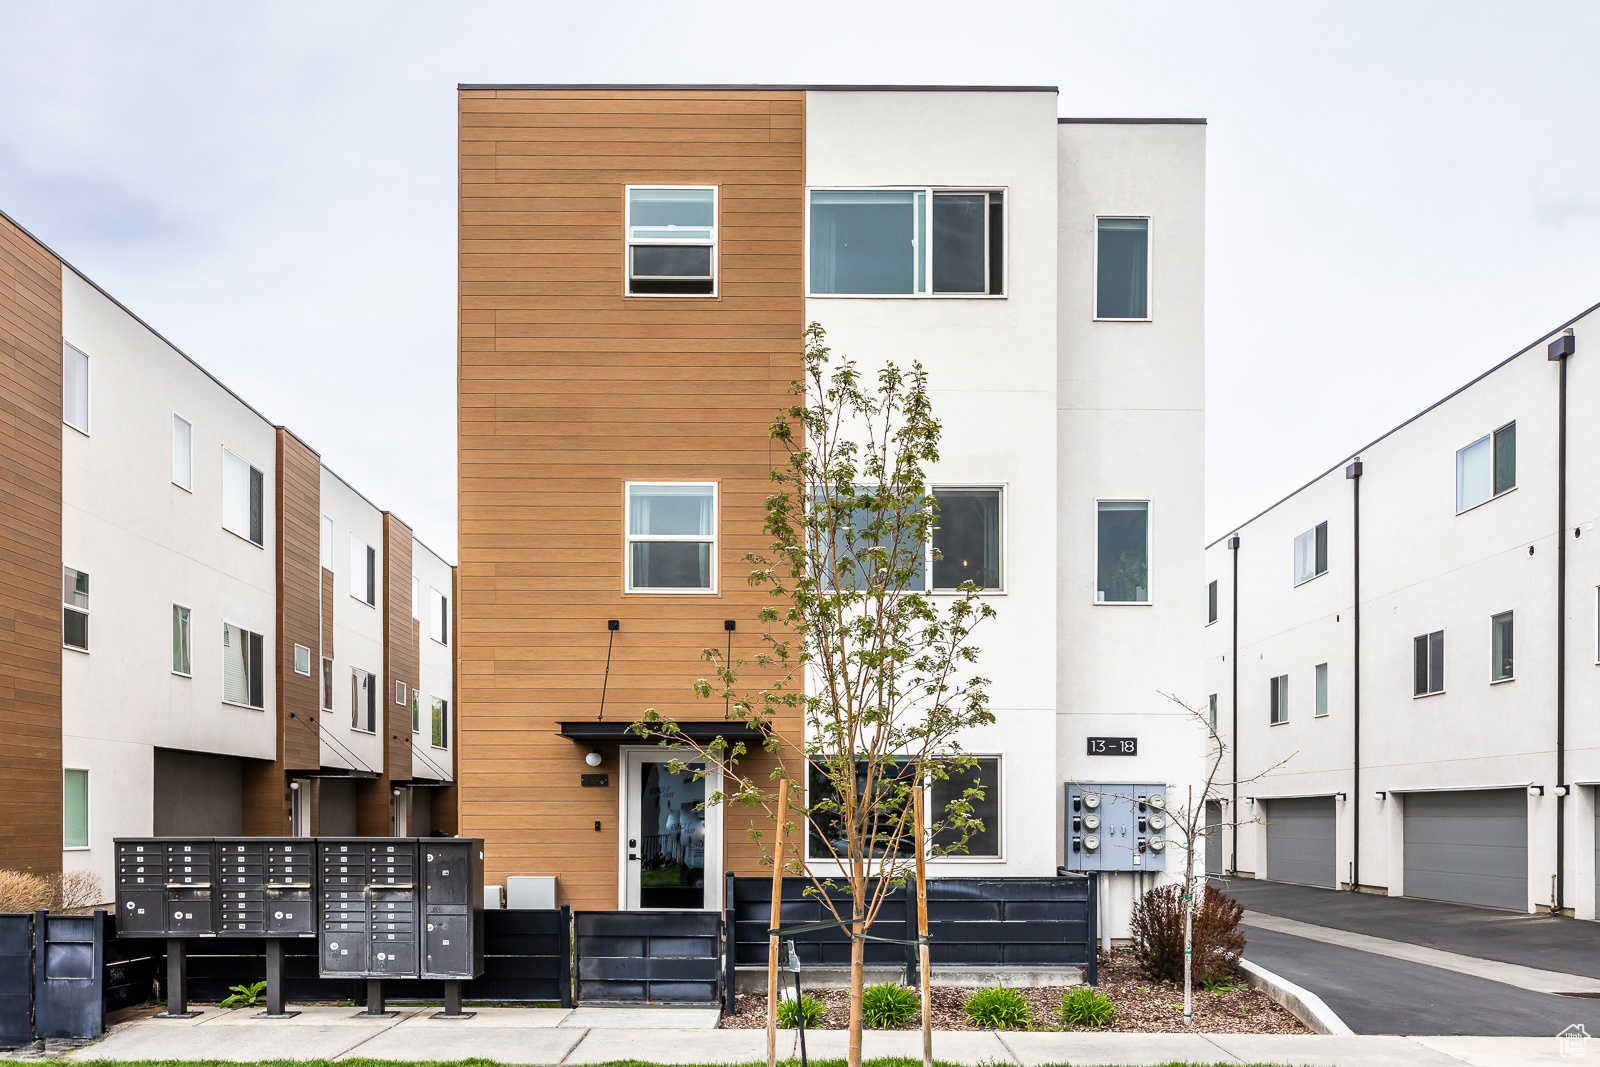
Active
$489,000
2
bds
|
3
ba
|
1,276
sqft
|
built
2020
1660 S Major St, Salt Lake City, UT 84115
$-1,037
Cash flow
-11.1%
Cash-on-Cash Return
3.7%
Cap rate
0.6%
Rent to Value Ratio
Active
$1,278,500
4
bds
|
3
ba
|
2,280
sqft
|
built
1955
1825 S 2600 E, Salt Lake City, UT 84108
$-5,057
Cash flow
-20.6%
Cash-on-Cash Return
1.5%
Cap rate
0.2%
Rent to Value Ratio
Active
$685,000
1
bds
|
1
ba
|
988
sqft
|
built
2011
35 E 100 S, Salt Lake City, UT 84111
$-3,120
Cash flow
-23.8%
Cash-on-Cash Return
0.8%
Cap rate
0.3%
Rent to Value Ratio
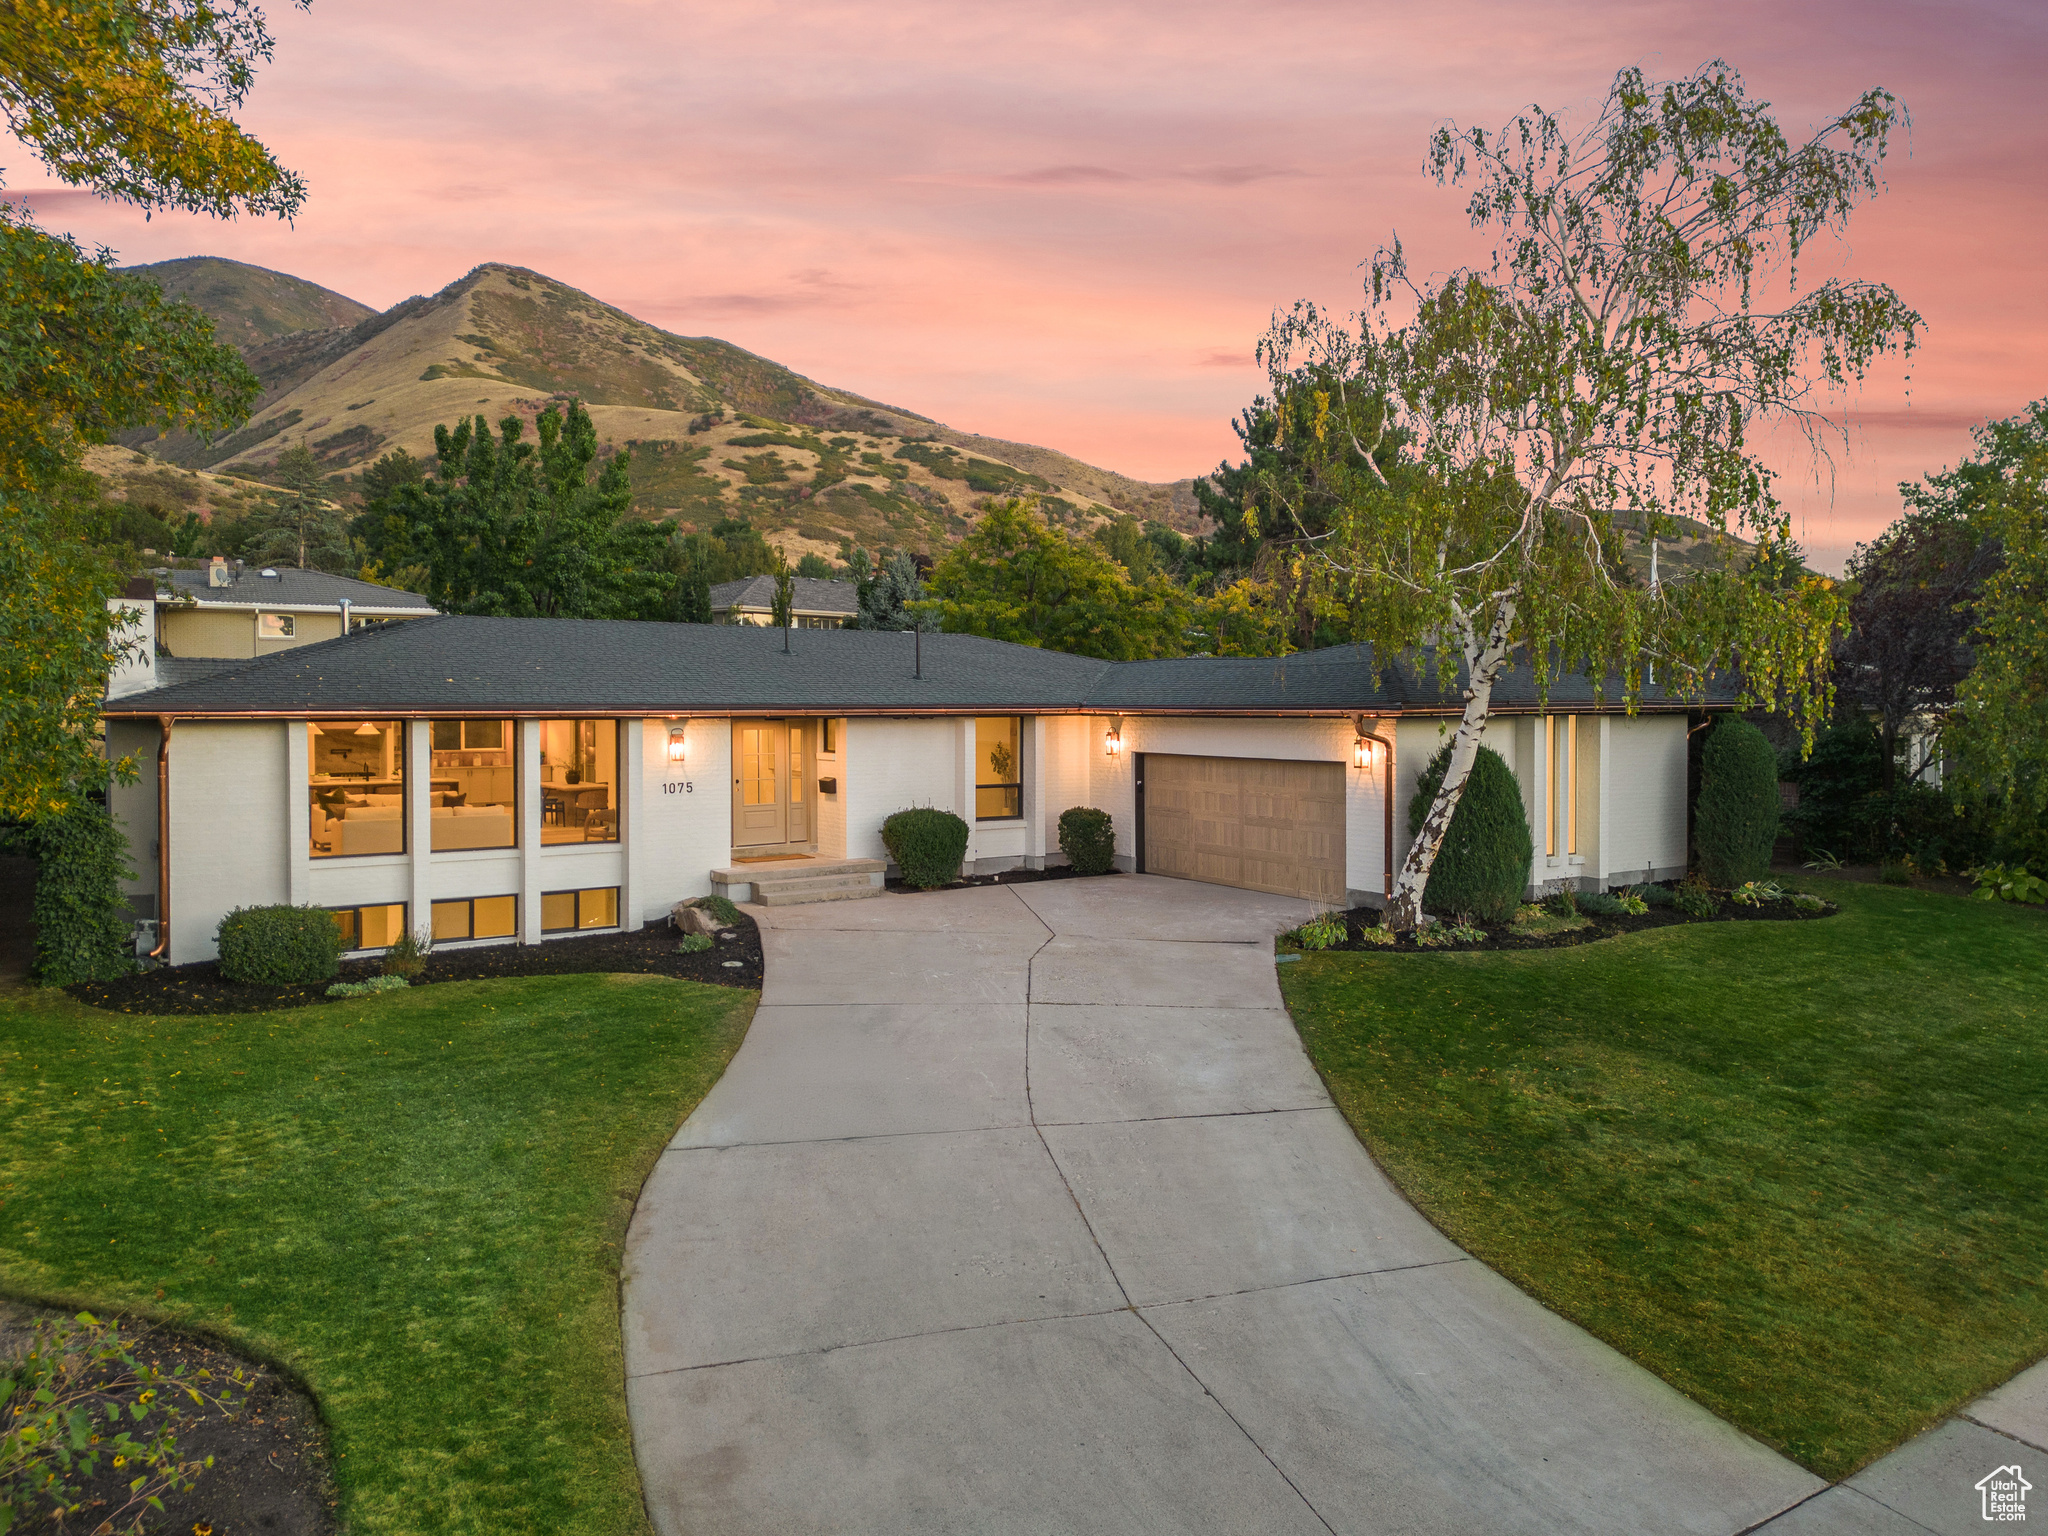
Active
$1,990,000
4
bds
|
3
ba
|
4,600
sqft
|
built
1971
1075 S Alton Way, Salt Lake City, UT 84108
$-5,373
Cash flow
-14.1%
Cash-on-Cash Return
3.0%
Cap rate
0.4%
Rent to Value Ratio

Active
$795,000
4
bds
|
3
ba
|
1,834
sqft
|
built
1901
263 G St, Salt Lake City, UT 84103
$-2,309
Cash flow
-15.2%
Cash-on-Cash Return
2.8%
Cap rate
0.4%
Rent to Value Ratio
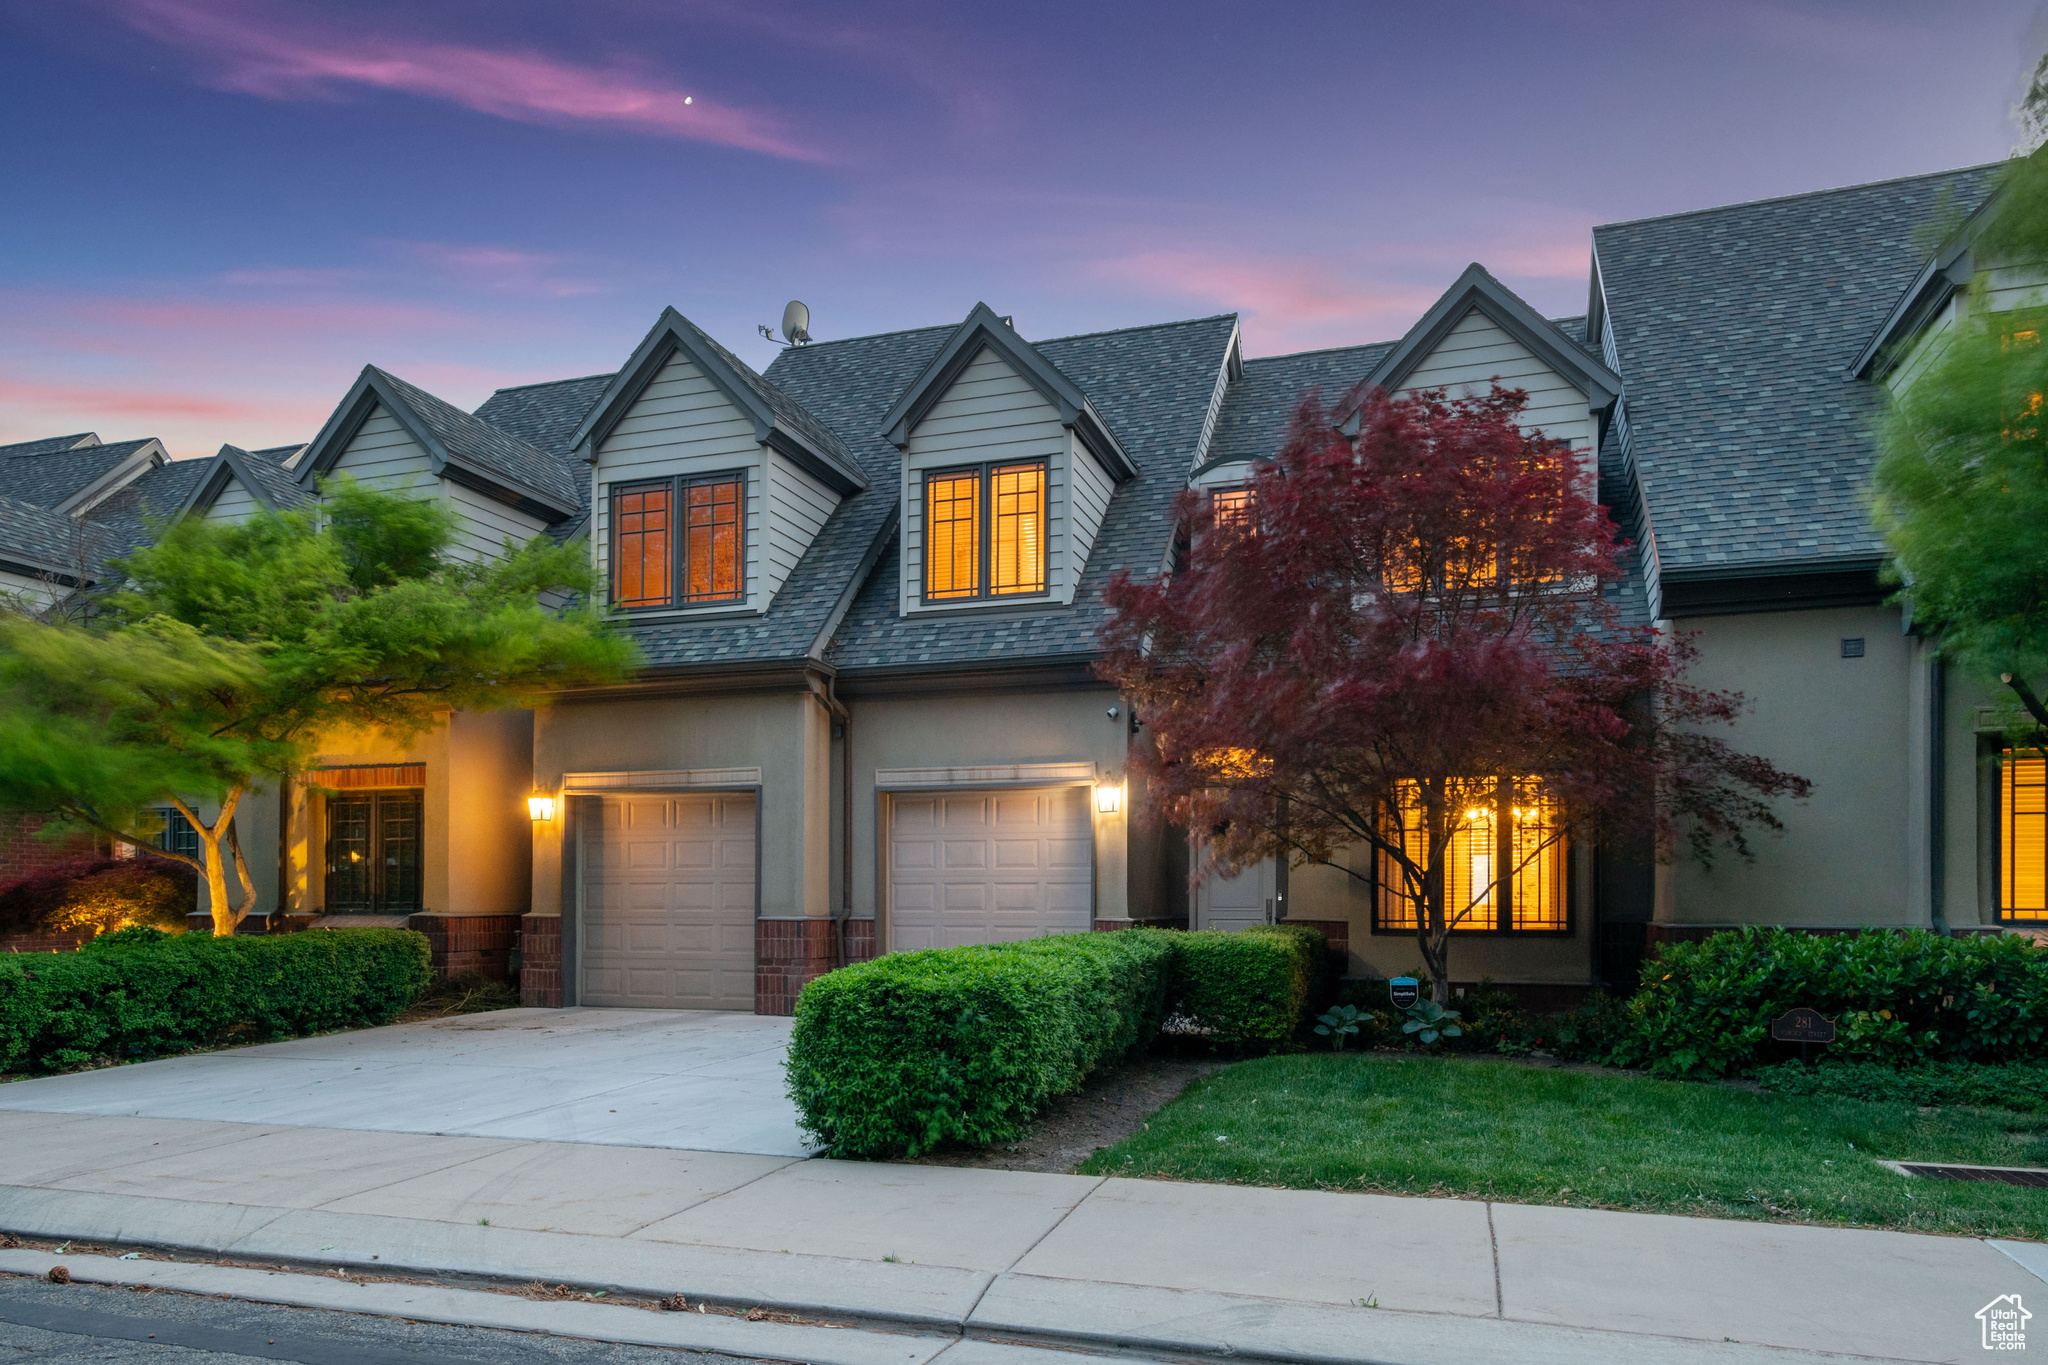
Active
$1,495,000
3
bds
|
5
ba
|
4,461
sqft
|
built
2000
281 N Almond St, Salt Lake City, UT 84103
$-4,324
Cash flow
-15.1%
Cash-on-Cash Return
2.8%
Cap rate
0.5%
Rent to Value Ratio
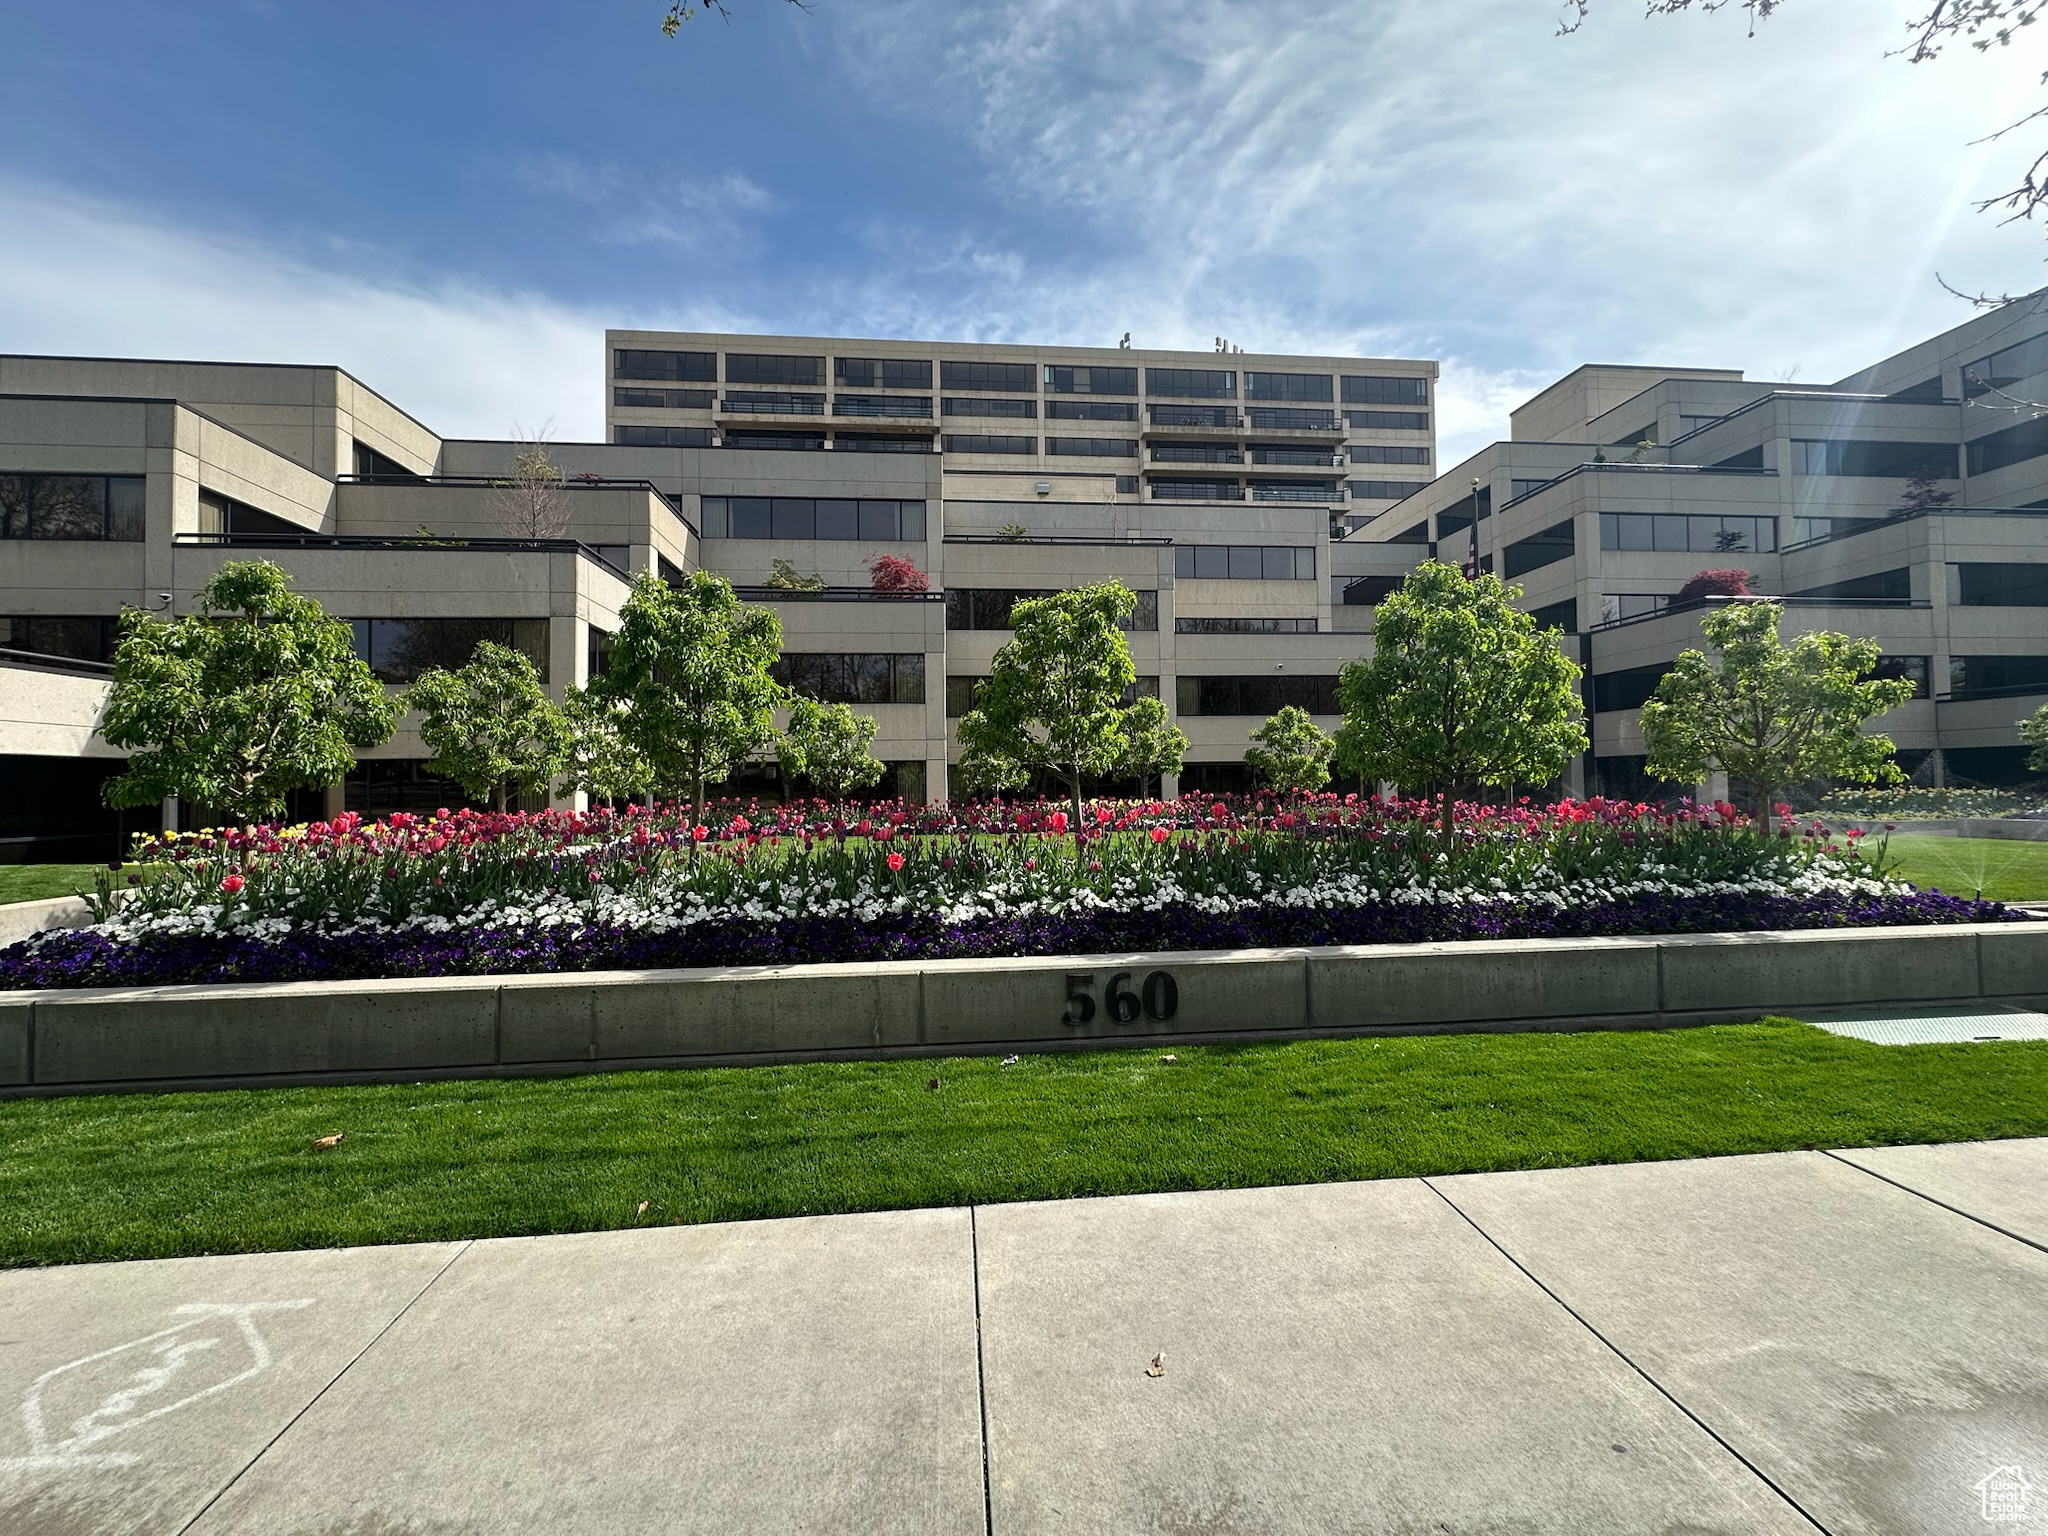
Active
$850,000
2
bds
|
2
ba
|
1,528
sqft
|
built
1983
560 E South Temple, Salt Lake City, UT 84102
$-3,369
Cash flow
-20.7%
Cash-on-Cash Return
1.5%
Cap rate
0.3%
Rent to Value Ratio

Active
$884,900
4
bds
|
2
ba
|
3,009
sqft
|
built
1912
946 E Princeton Ave, Salt Lake City, UT 84105
$-2,249
Cash flow
-13.3%
Cash-on-Cash Return
3.2%
Cap rate
0.4%
Rent to Value Ratio
Active
$2,650,000
5
bds
|
5
ba
|
5,314
sqft
|
built
1992
2457 S Scenic Dr, Salt Lake City, UT 84109
$-10,997
Cash flow
-21.7%
Cash-on-Cash Return
1.3%
Cap rate
0.2%
Rent to Value Ratio
Active
$290,000
2
bds
|
1
ba
|
938
sqft
|
built
1977
31 M St, Salt Lake City, UT 84103
$-618
Cash flow
-11.1%
Cash-on-Cash Return
3.7%
Cap rate
0.7%
Rent to Value Ratio
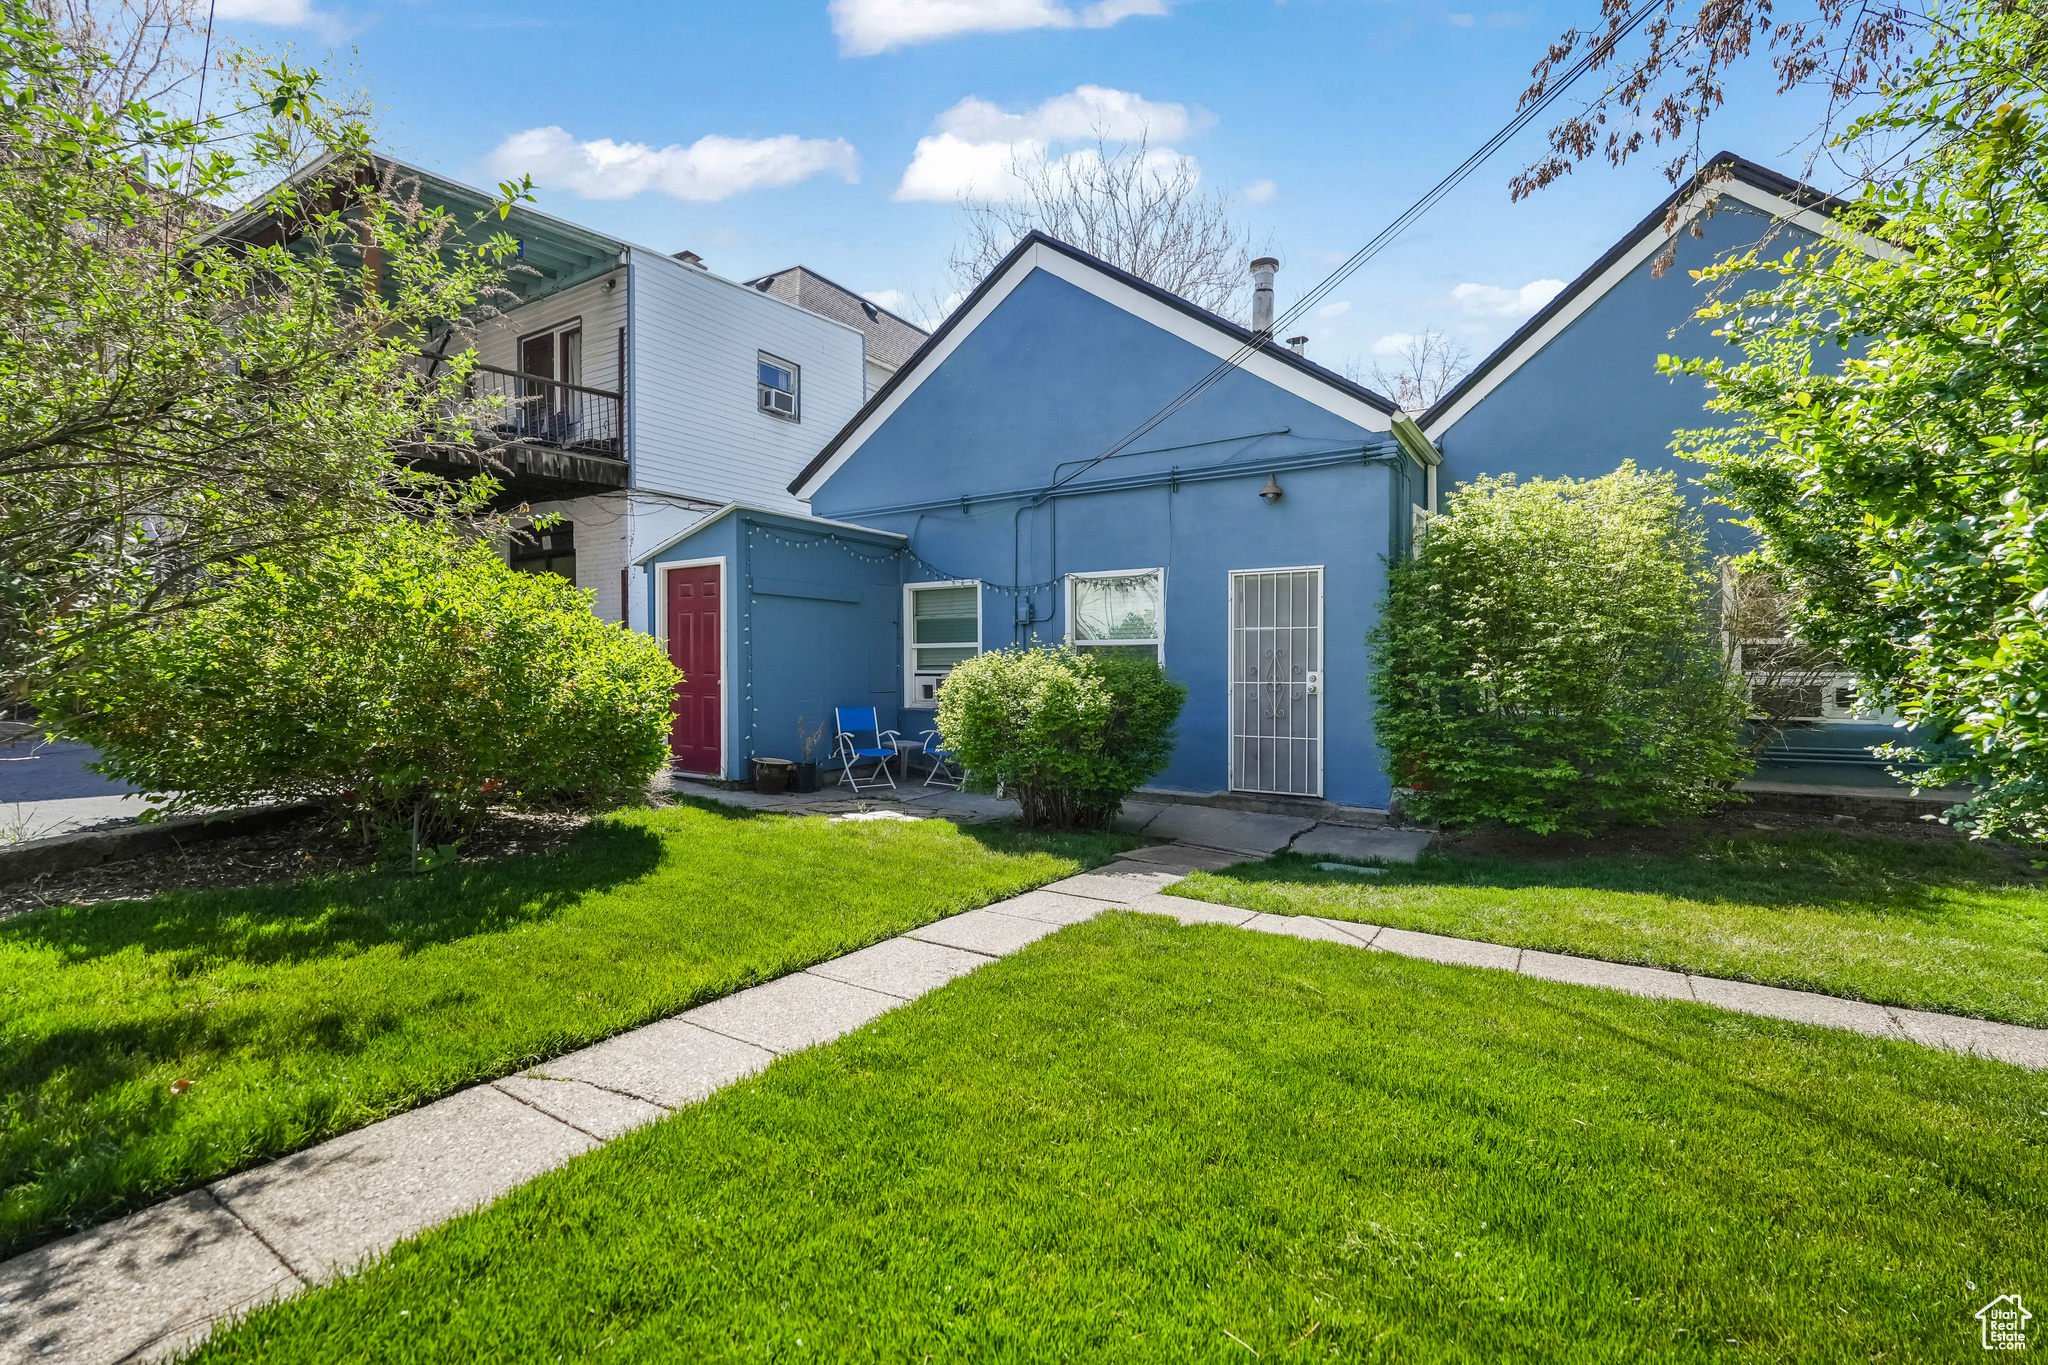
Active
$295,000
1
bds
|
1
ba
|
708
sqft
|
built
1968
521 E 5th Ave, Salt Lake City, UT 84103
$-919
Cash flow
-16.3%
Cash-on-Cash Return
2.5%
Cap rate
0.5%
Rent to Value Ratio

Active
$495,000
4
bds
|
1
ba
|
1,850
sqft
|
built
1951
1425 W Riverside Cir, Salt Lake City, UT 84116
$-1,180
Cash flow
-12.4%
Cash-on-Cash Return
3.4%
Cap rate
0.5%
Rent to Value Ratio
Active
$524,500
3
bds
|
3
ba
|
1,325
sqft
|
built
1922
557 N 1200 W, Salt Lake City, UT 84116
$-1,651
Cash flow
-16.4%
Cash-on-Cash Return
2.5%
Cap rate
0.3%
Rent to Value Ratio
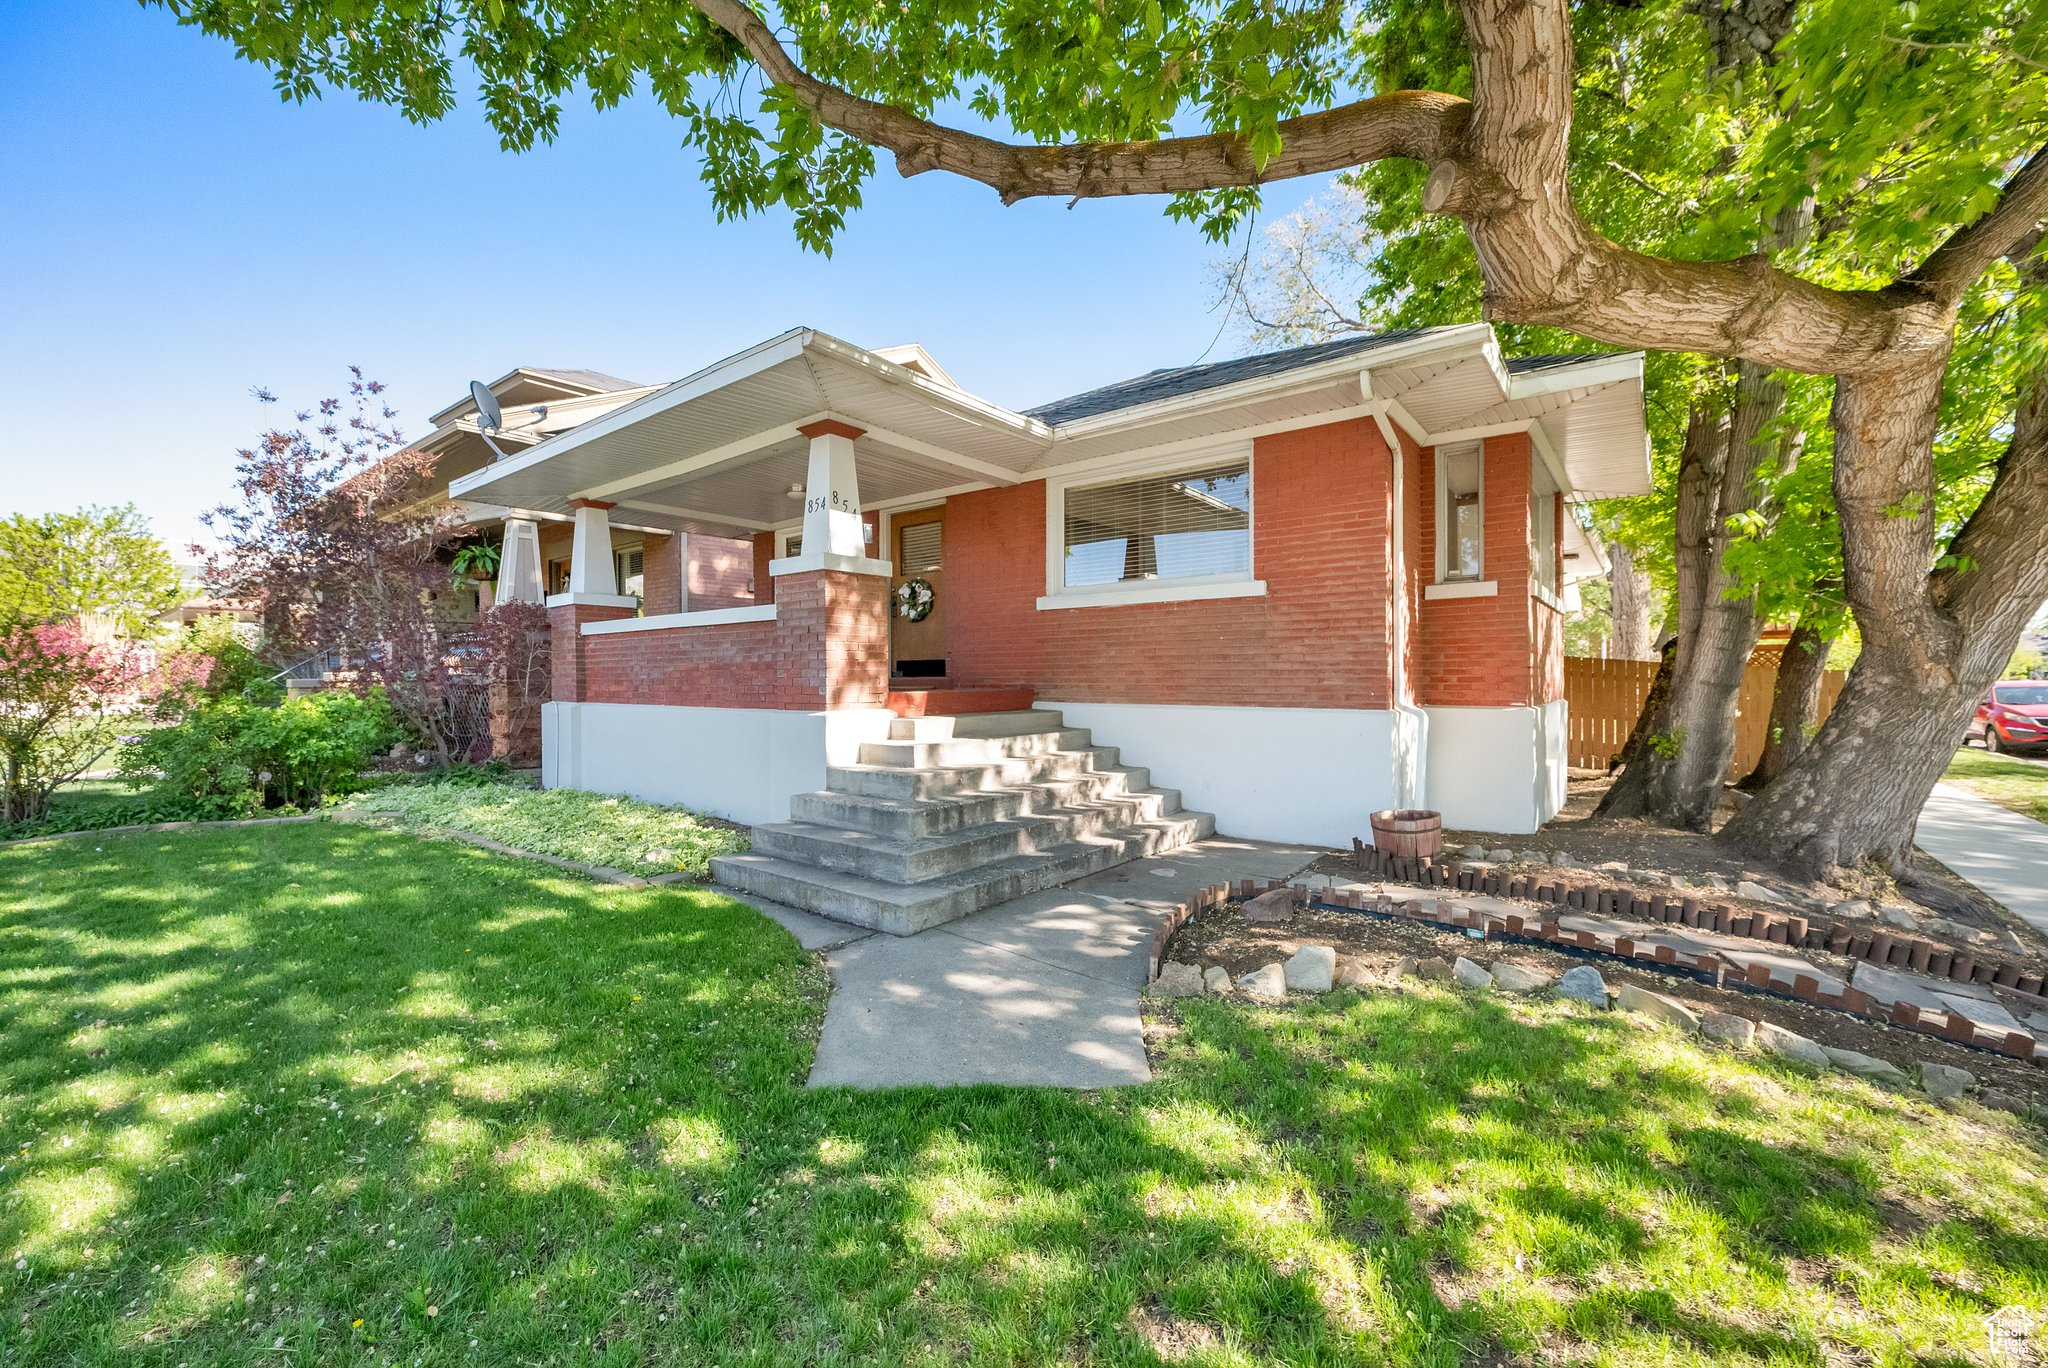
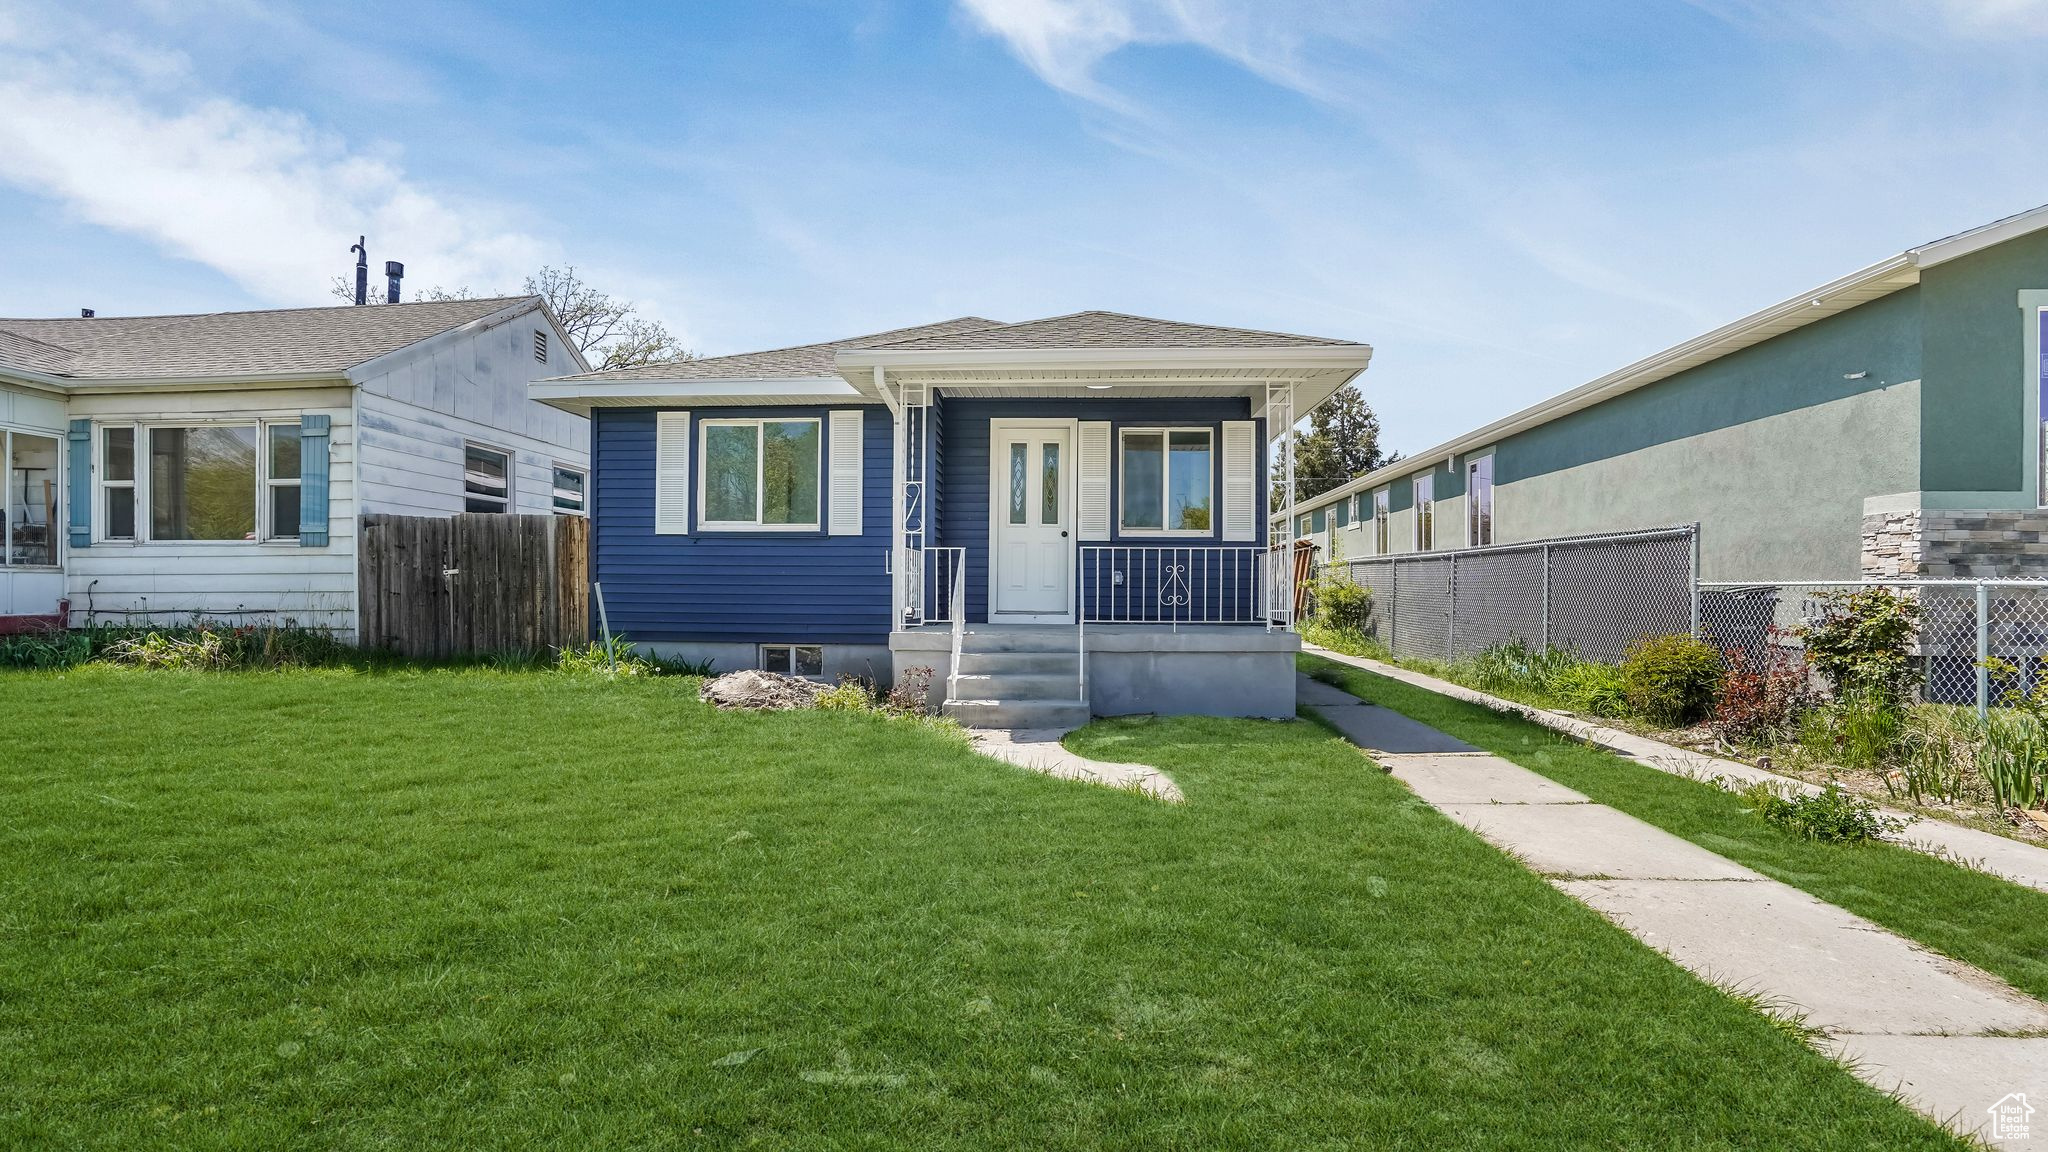
Active
$611,000
4
bds
|
1
ba
|
1,890
sqft
|
built
1915
854 E 1700 S, Salt Lake City, UT 84105
$-1,685
Cash flow
-14.4%
Cash-on-Cash Return
3.0%
Cap rate
0.4%
Rent to Value Ratio
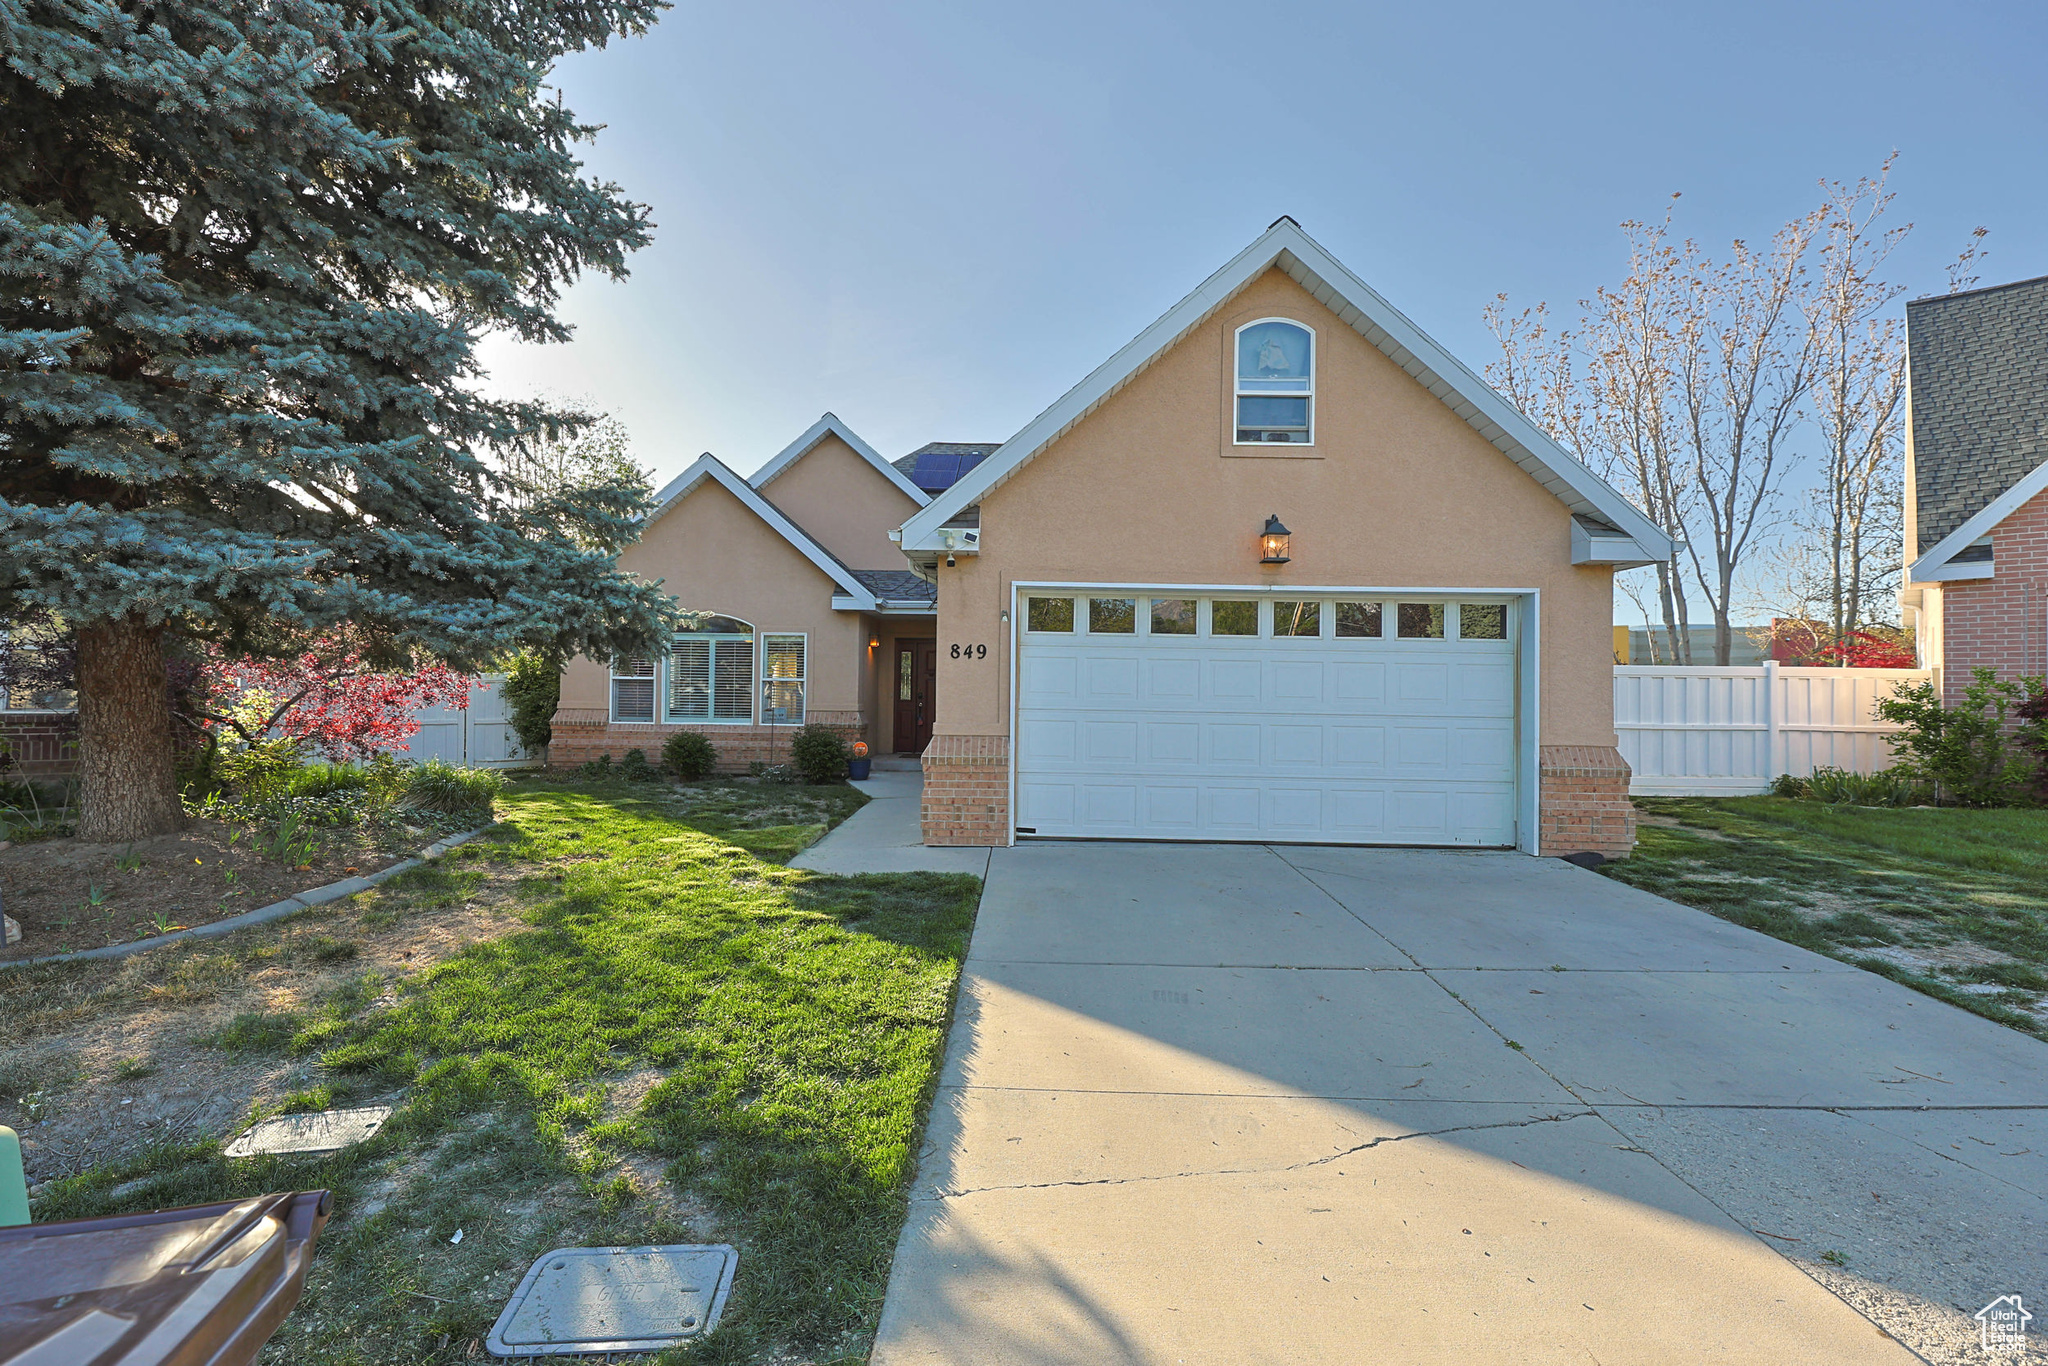
Active
$700,000
3
bds
|
2
ba
|
1,800
sqft
|
built
1999
849 E Forest Farm Cir, Salt Lake City, UT 84106
$-2,171
Cash flow
-16.2%
Cash-on-Cash Return
2.6%
Cap rate
0.4%
Rent to Value Ratio

Active
$2,295,000
6
bds
|
4
ba
|
5,985
sqft
|
built
1940
1230 E 11th Ave, Salt Lake City, UT 84103
$-7,060
Cash flow
-16.1%
Cash-on-Cash Return
2.6%
Cap rate
0.3%
Rent to Value Ratio
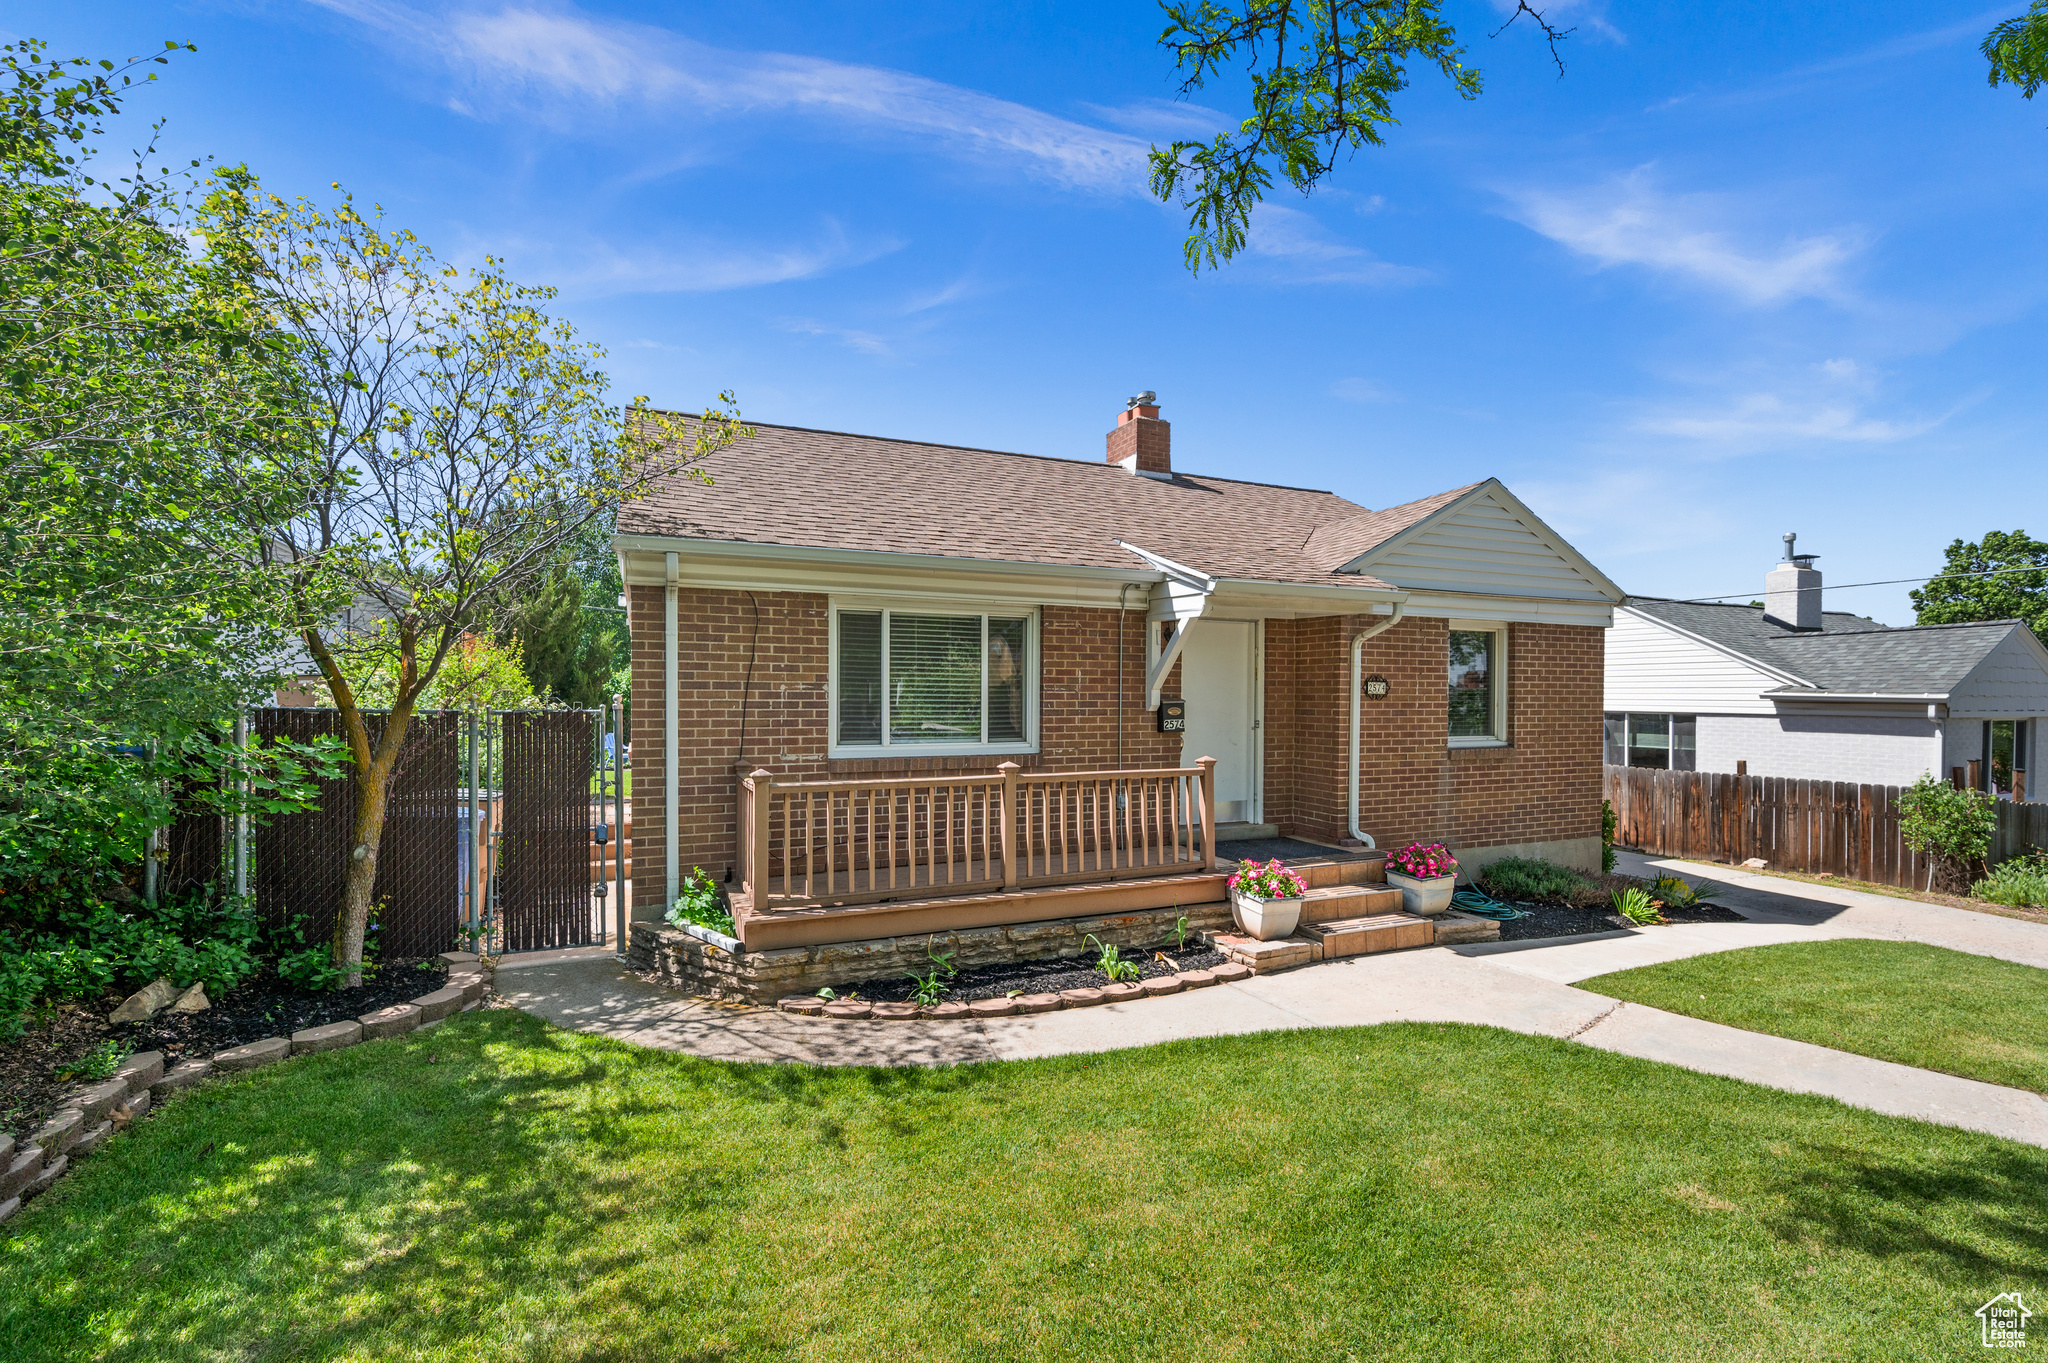
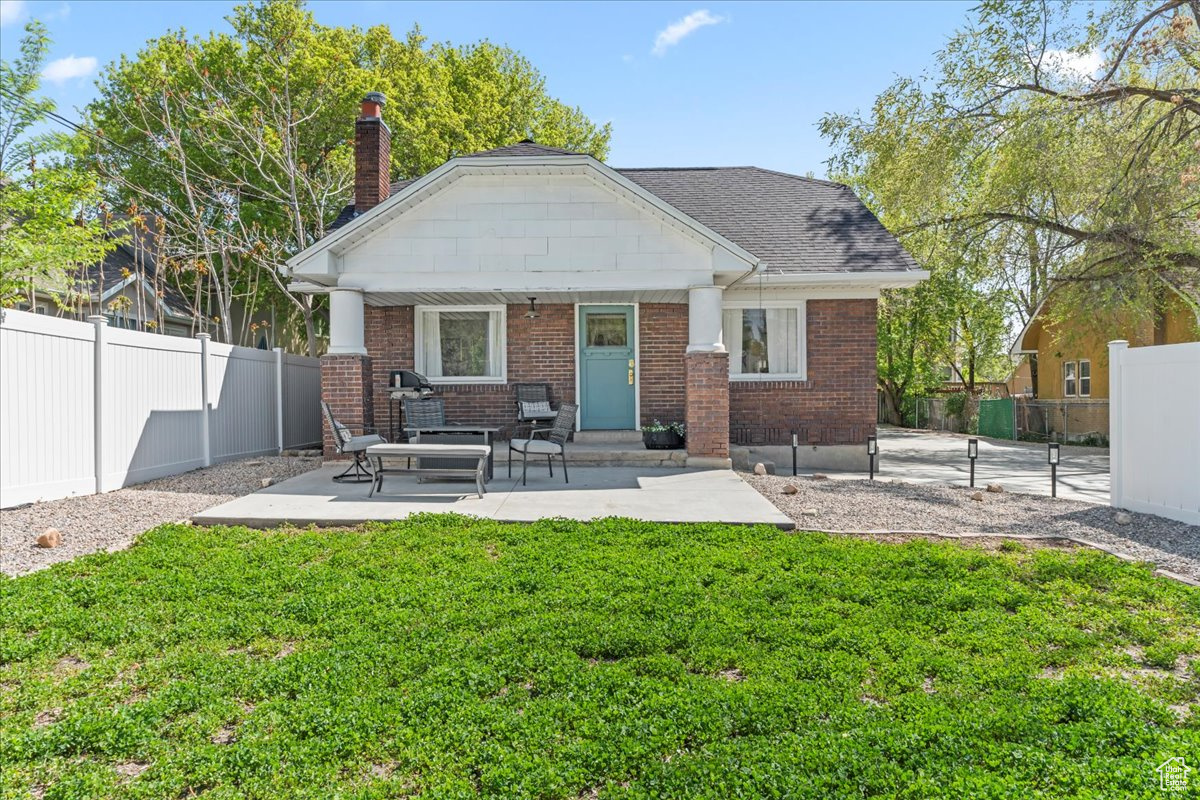
Active
$669,000
4
bds
|
2
ba
|
1,648
sqft
|
built
1947
2574 E Elm Ave, Salt Lake City, UT 84109
$-1,773
Cash flow
-13.8%
Cash-on-Cash Return
3.1%
Cap rate
0.4%
Rent to Value Ratio
Active
$2,800,000
4
bds
|
5
ba
|
5,780
sqft
|
built
1937
1500 E Arlington Dr, Salt Lake City, UT 84103
$-11,878
Cash flow
-22.1%
Cash-on-Cash Return
1.2%
Cap rate
0.2%
Rent to Value Ratio
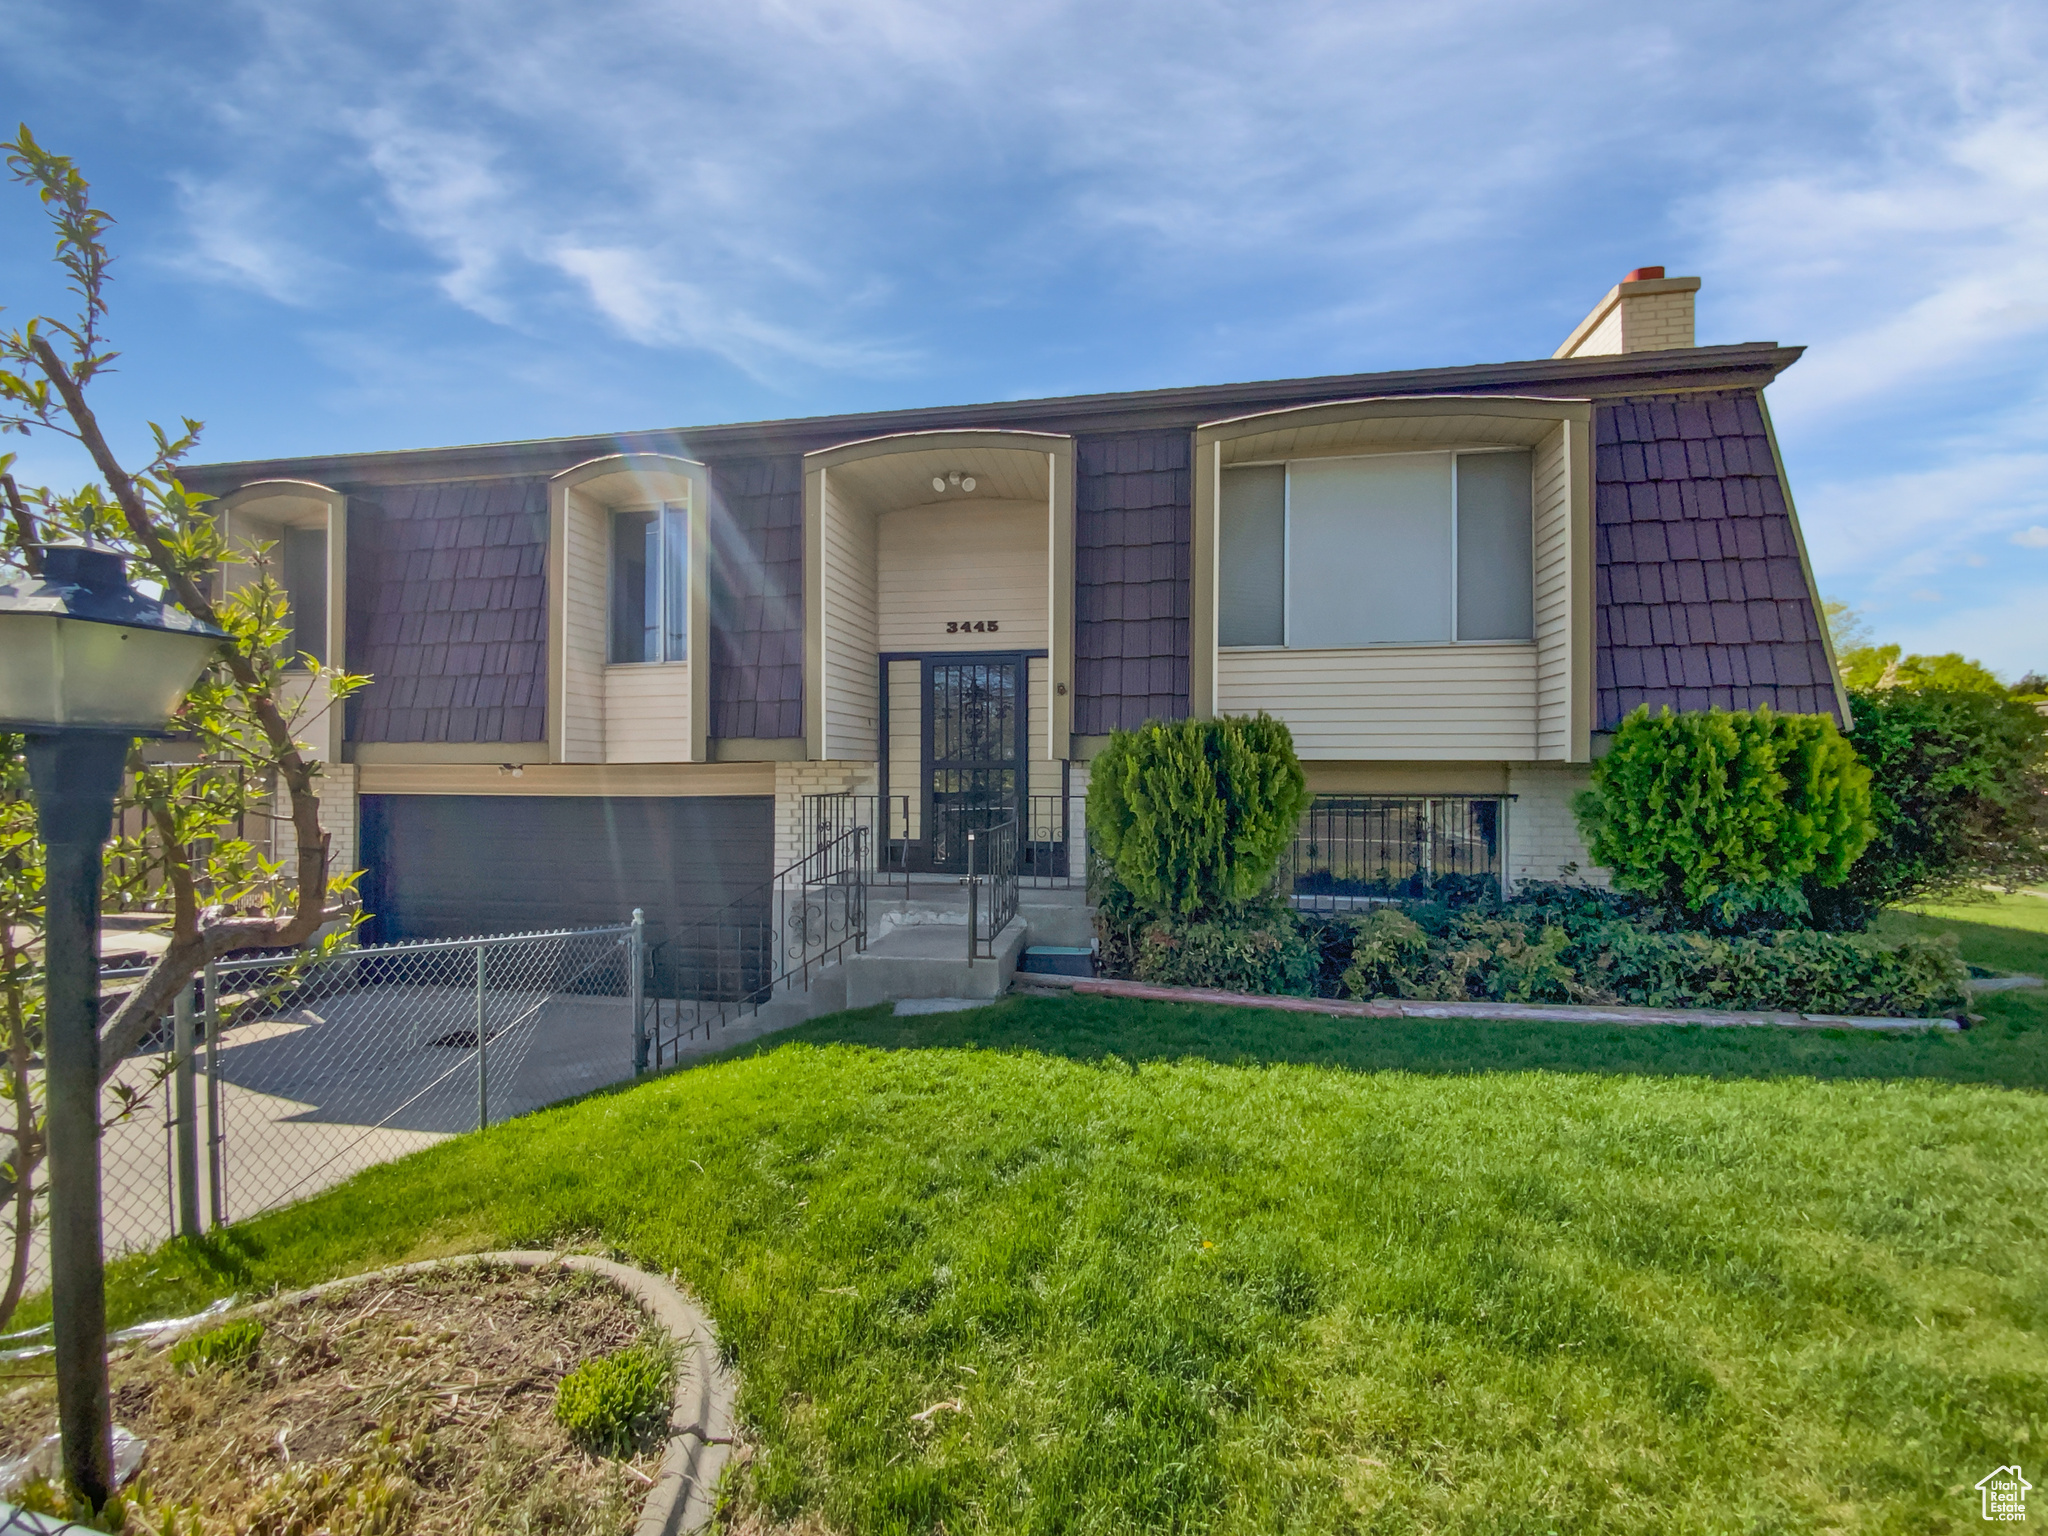
Active
$445,000
3
bds
|
2
ba
|
1,685
sqft
|
built
1972
3445 W 3650 S, Salt Lake City, UT 84119
$-1,131
Cash flow
-13.3%
Cash-on-Cash Return
3.2%
Cap rate
0.4%
Rent to Value Ratio
Active
$849,900
4
bds
|
3
ba
|
2,392
sqft
|
built
1924
1870 E 3900 S, Salt Lake City, UT 84124
$-2,238
Cash flow
-13.7%
Cash-on-Cash Return
3.1%
Cap rate
0.4%
Rent to Value Ratio
Pending
$625,000
5
bds
|
3
ba
|
2,184
sqft
|
built
1958
2344 E Arnett Dr, Salt Lake City, UT 84109
$-2,200
Cash flow
-18.4%
Cash-on-Cash Return
2.1%
Cap rate
0.3%
Rent to Value Ratio
Active
$799,000
4
bds
|
3
ba
|
2,702
sqft
|
built
1927
1067 S 400 E, Salt Lake City, UT 84111
$-2,487
Cash flow
-16.2%
Cash-on-Cash Return
2.5%
Cap rate
0.4%
Rent to Value Ratio
Active
$624,900
6
bds
|
3
ba
|
2,250
sqft
|
built
1962
3724 S Carolyn St, Salt Lake City, UT 84106
$-2,134
Cash flow
-17.8%
Cash-on-Cash Return
2.2%
Cap rate
0.3%
Rent to Value Ratio
Active
$524,900
3
bds
|
2
ba
|
2,028
sqft
|
built
1973
4227 S Hopi Dr, Salt Lake City, UT 84119
$-1,734
Cash flow
-17.2%
Cash-on-Cash Return
2.3%
Cap rate
0.3%
Rent to Value Ratio
Active
$515,000
4
bds
|
3
ba
|
1,925
sqft
|
built
1956
4209 W 3860 S, Salt Lake City, UT 84120
$-1,423
Cash flow
-14.4%
Cash-on-Cash Return
3.0%
Cap rate
0.4%
Rent to Value Ratio

Active
$545,000
4
bds
|
3
ba
|
1,603
sqft
|
built
2019
230 W 1300 S, Salt Lake City, UT 84115
$-1,414
Cash flow
-13.5%
Cash-on-Cash Return
3.2%
Cap rate
0.5%
Rent to Value Ratio
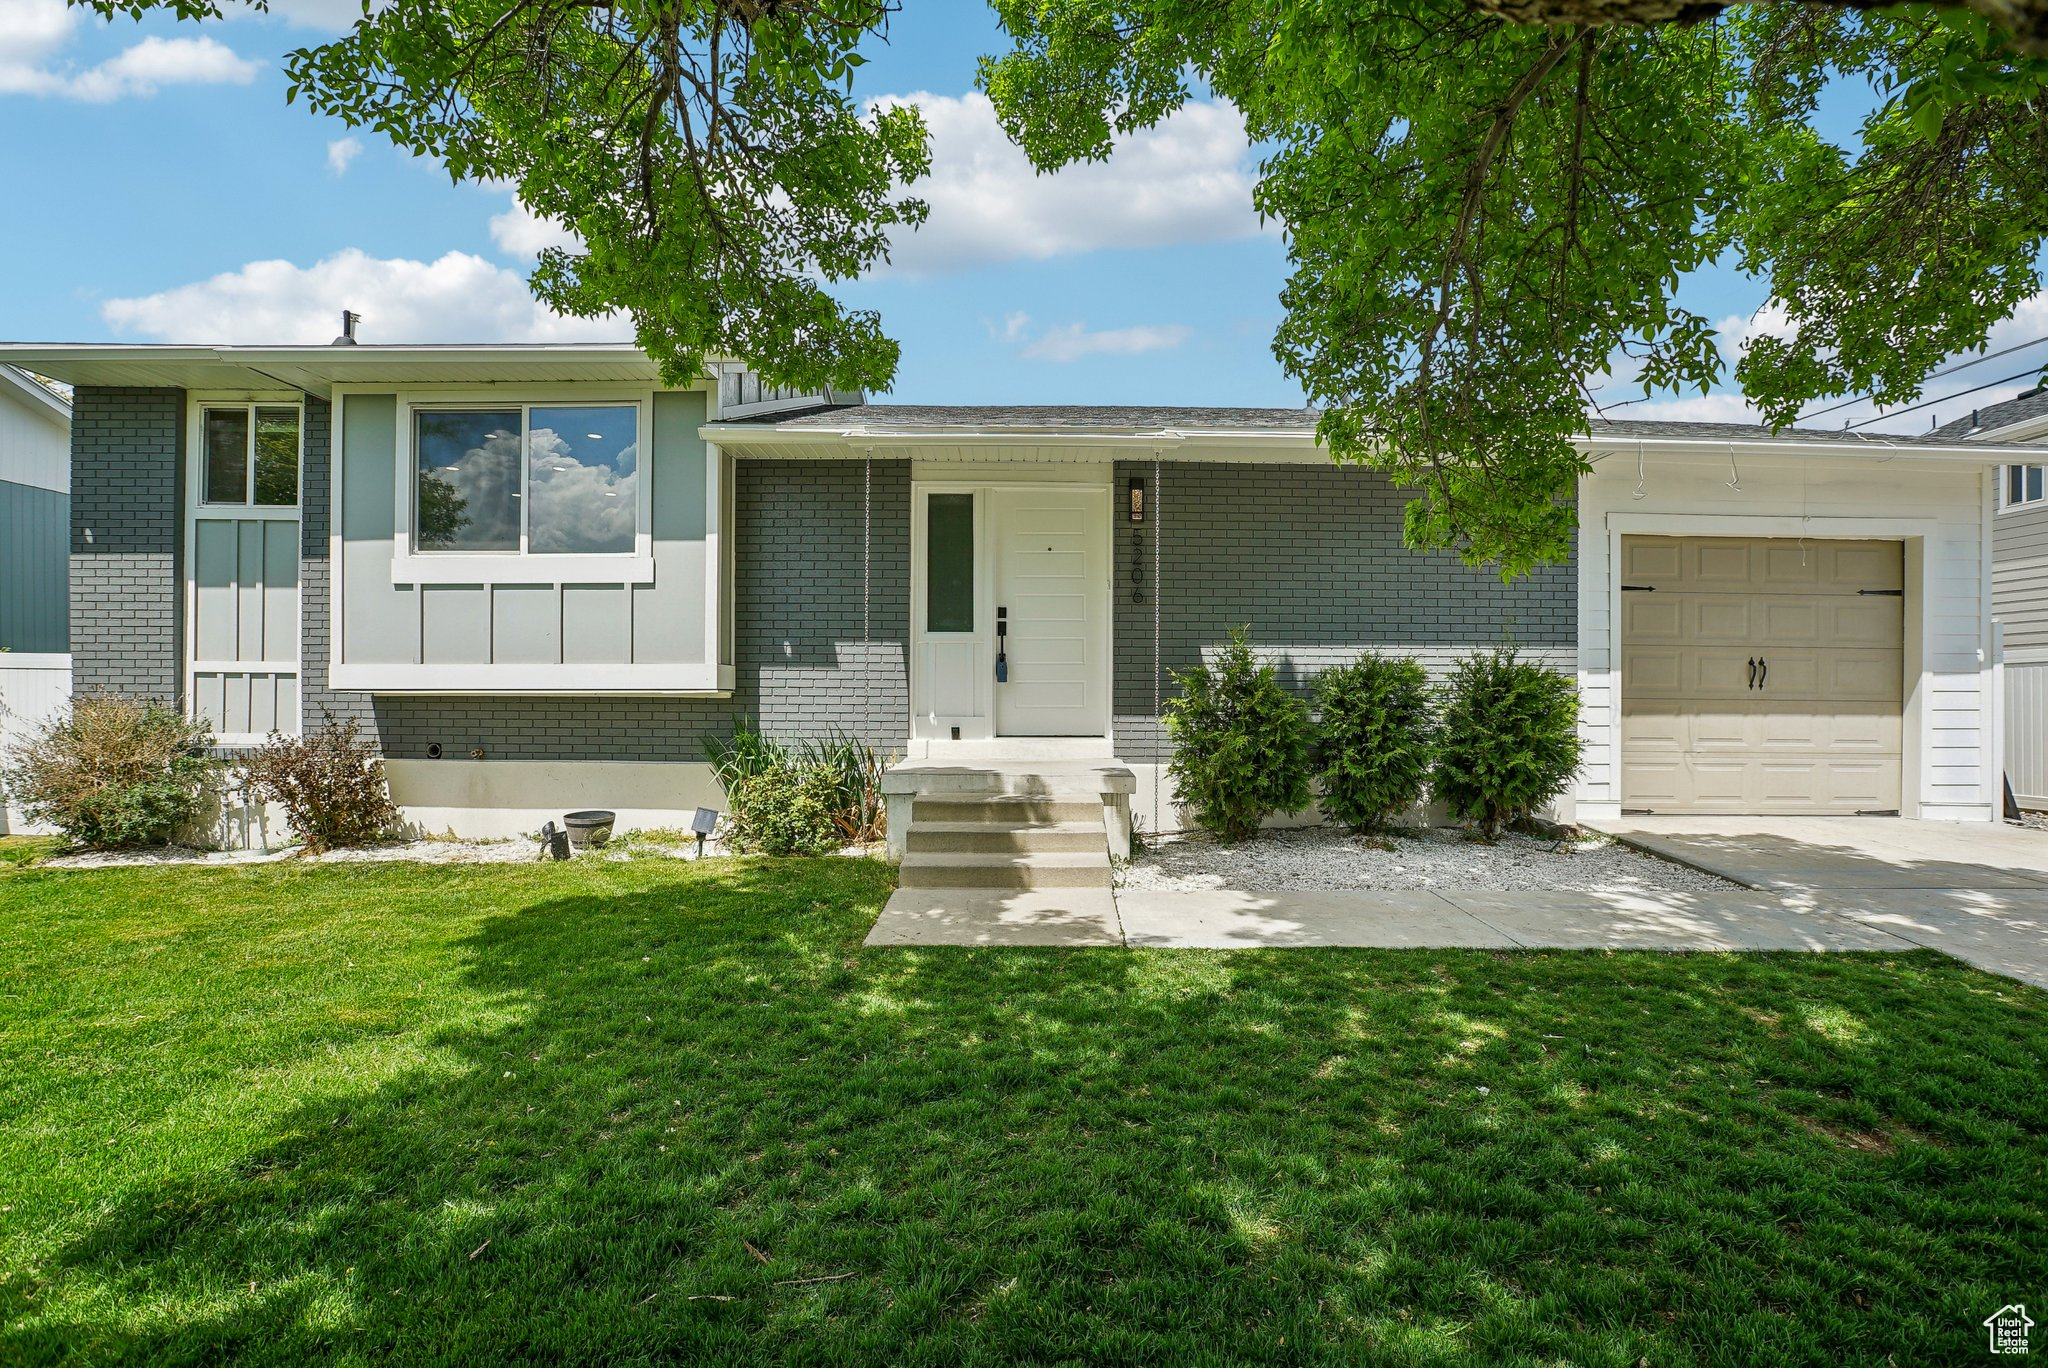
Active
$650,000
5
bds
|
2
ba
|
1,956
sqft
|
built
1976
5206 W Hunter Dr, Salt Lake City, UT 84120
$-1,698
Cash flow
-13.6%
Cash-on-Cash Return
3.1%
Cap rate
0.4%
Rent to Value Ratio