Salt Lake City, UT Investment Properties for Sale
Browse homes for sale and investment properties in Salt Lake City, UT. Refine your search by price, property type, or more.
Best cash flowing properties in Salt Lake City, UT
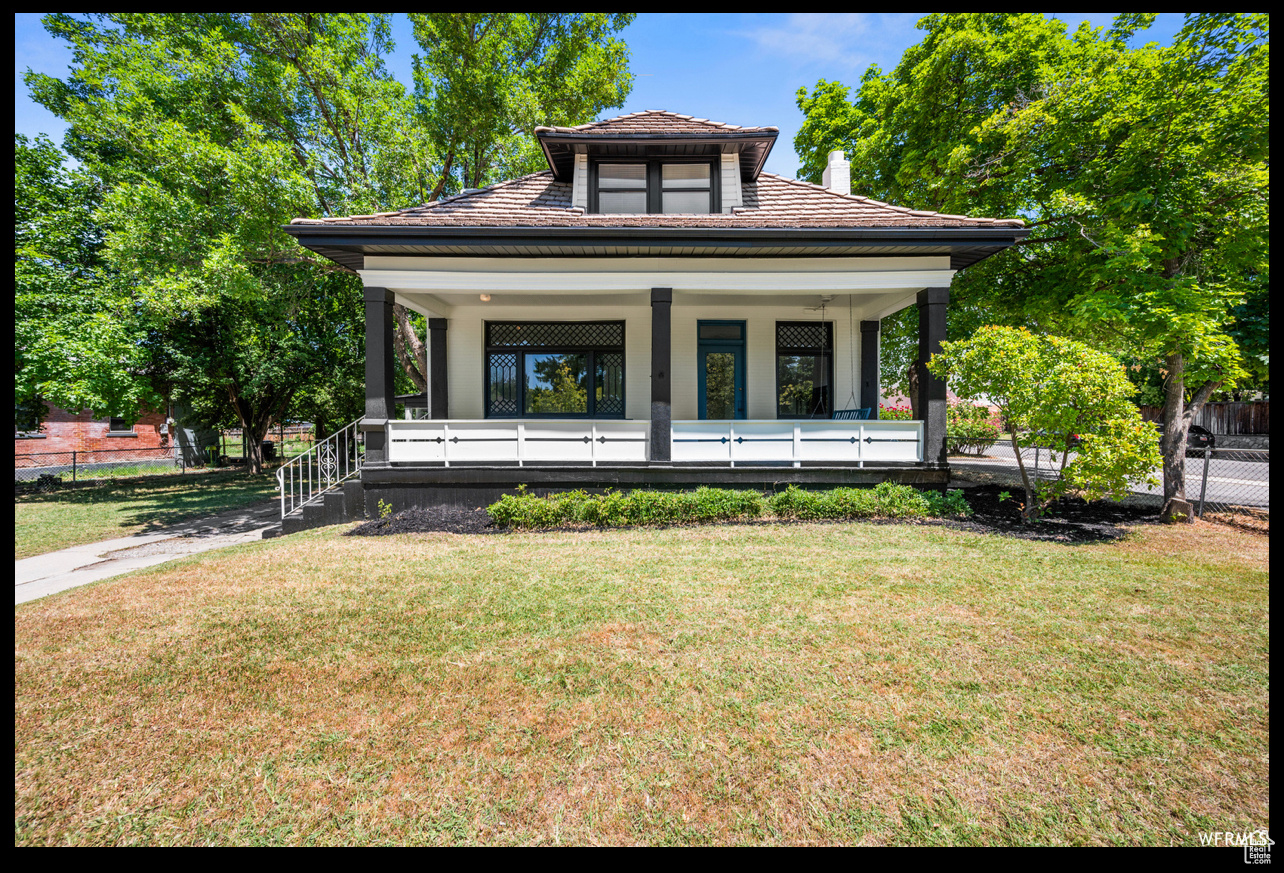
Active
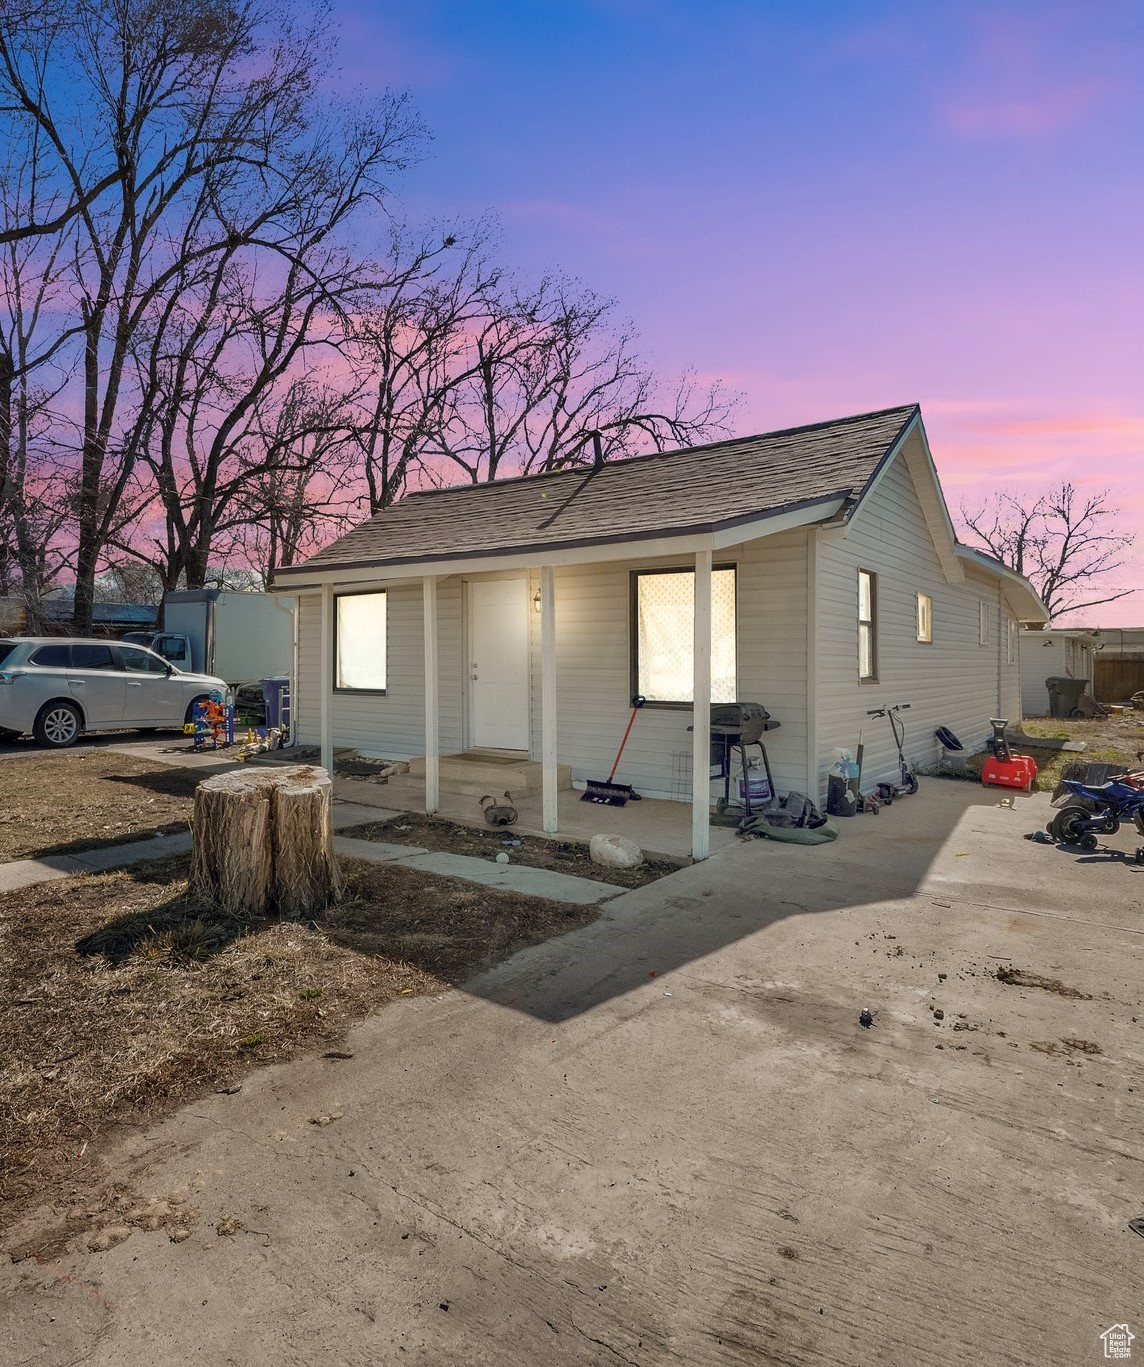
$258,000
1
bds
|
1
ba
|
691
sqft
|
built
1963
87 W 300 N, Salt Lake City, UT 84103
$-531
Cash flow
-10.7%
Cash-on-Cash Return
3.8%
Cap rate
0.7%
Rent to Value Ratio
Active
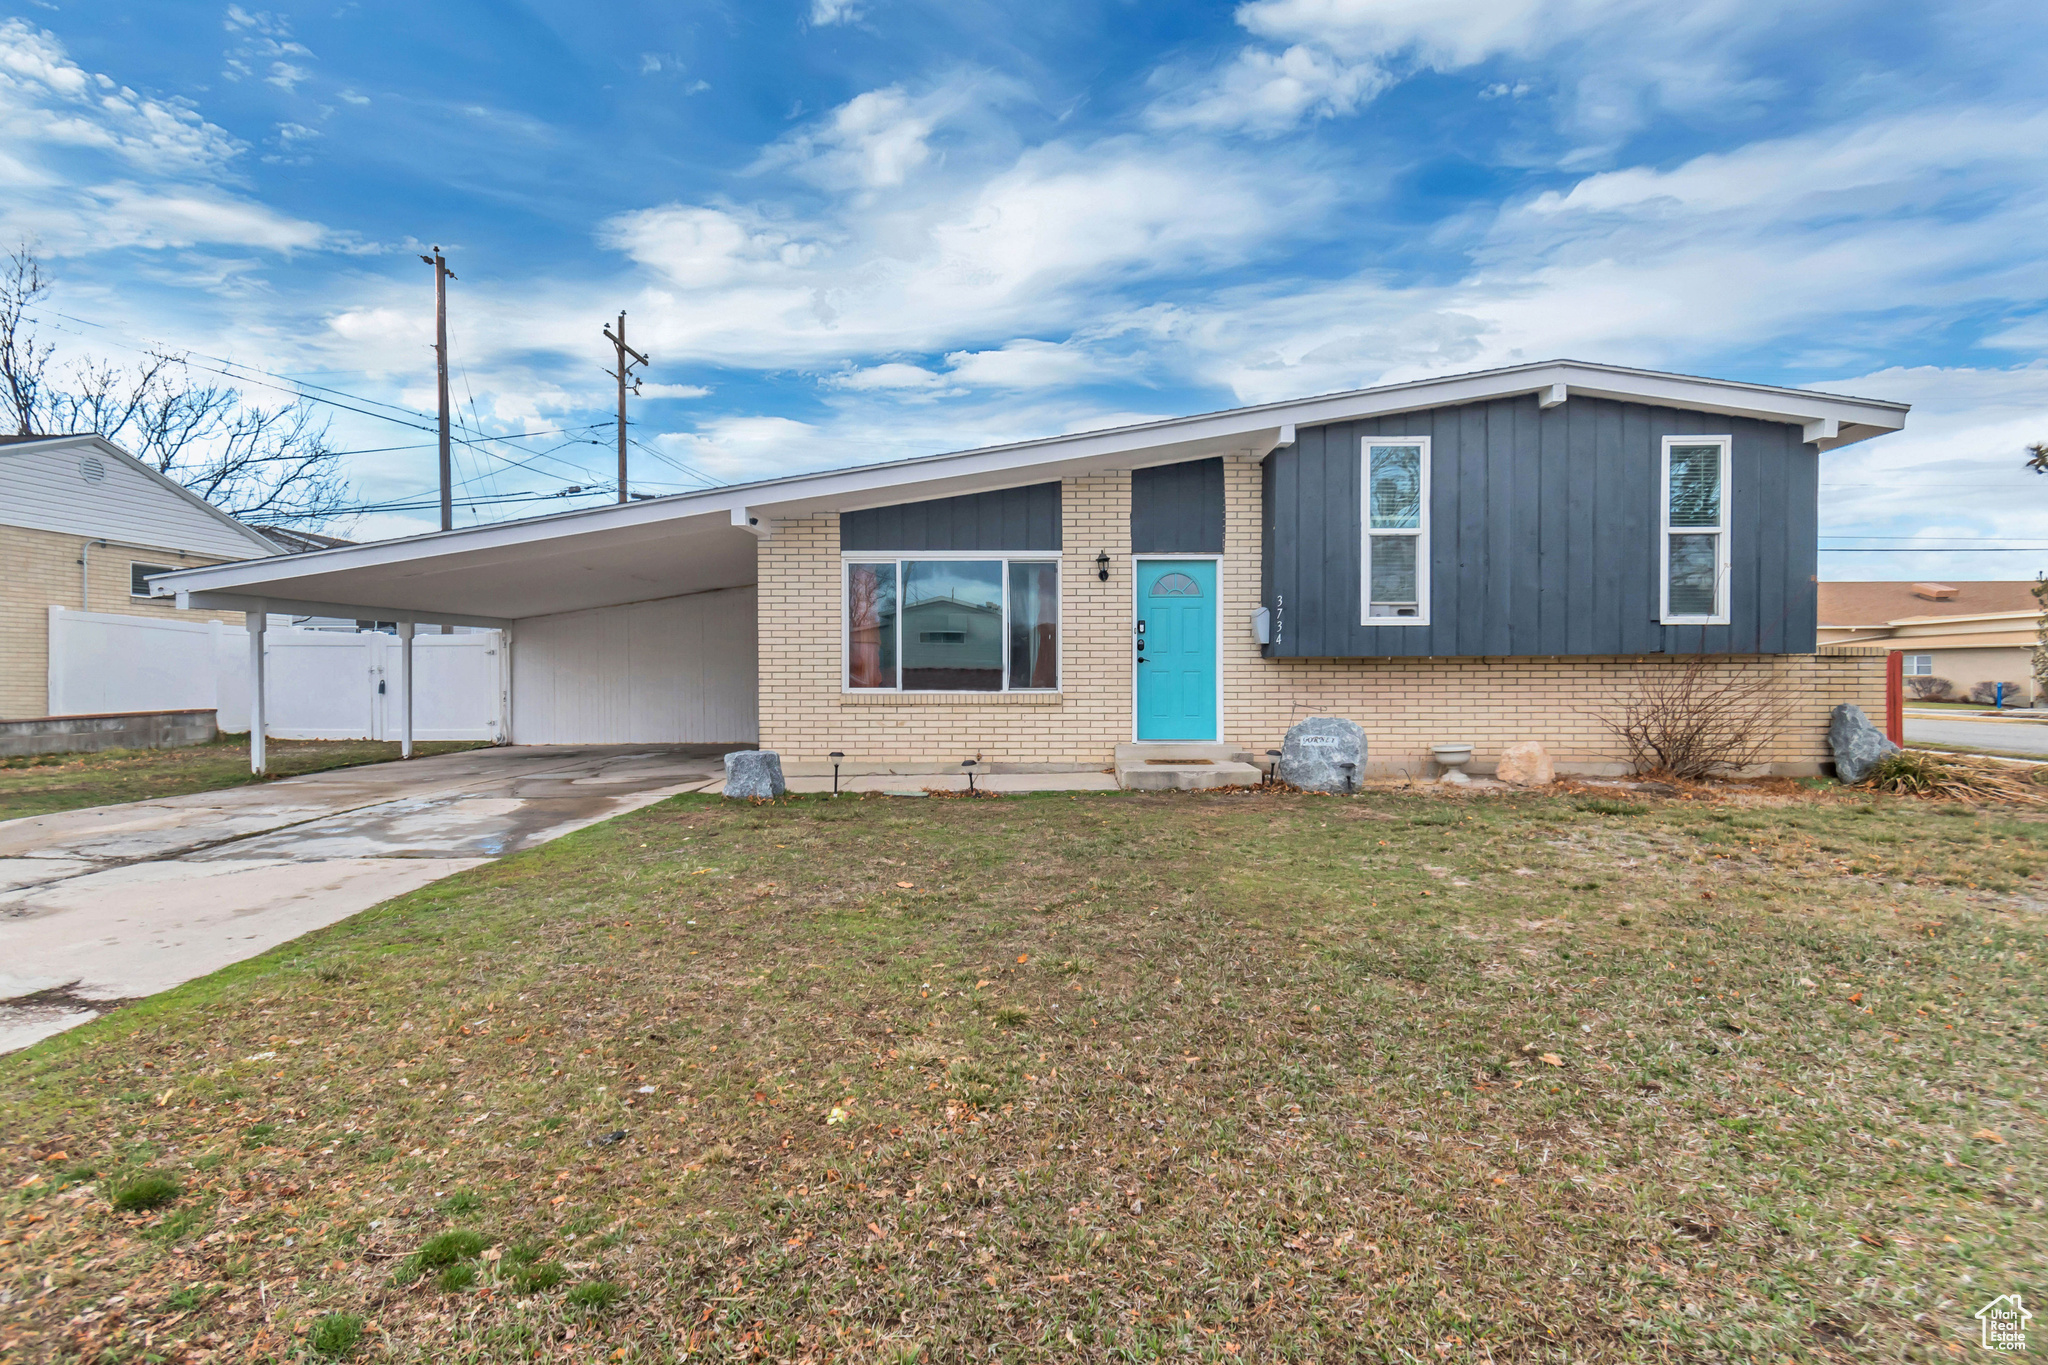
$319,000
1
bds
|
2
ba
|
755
sqft
|
built
2007
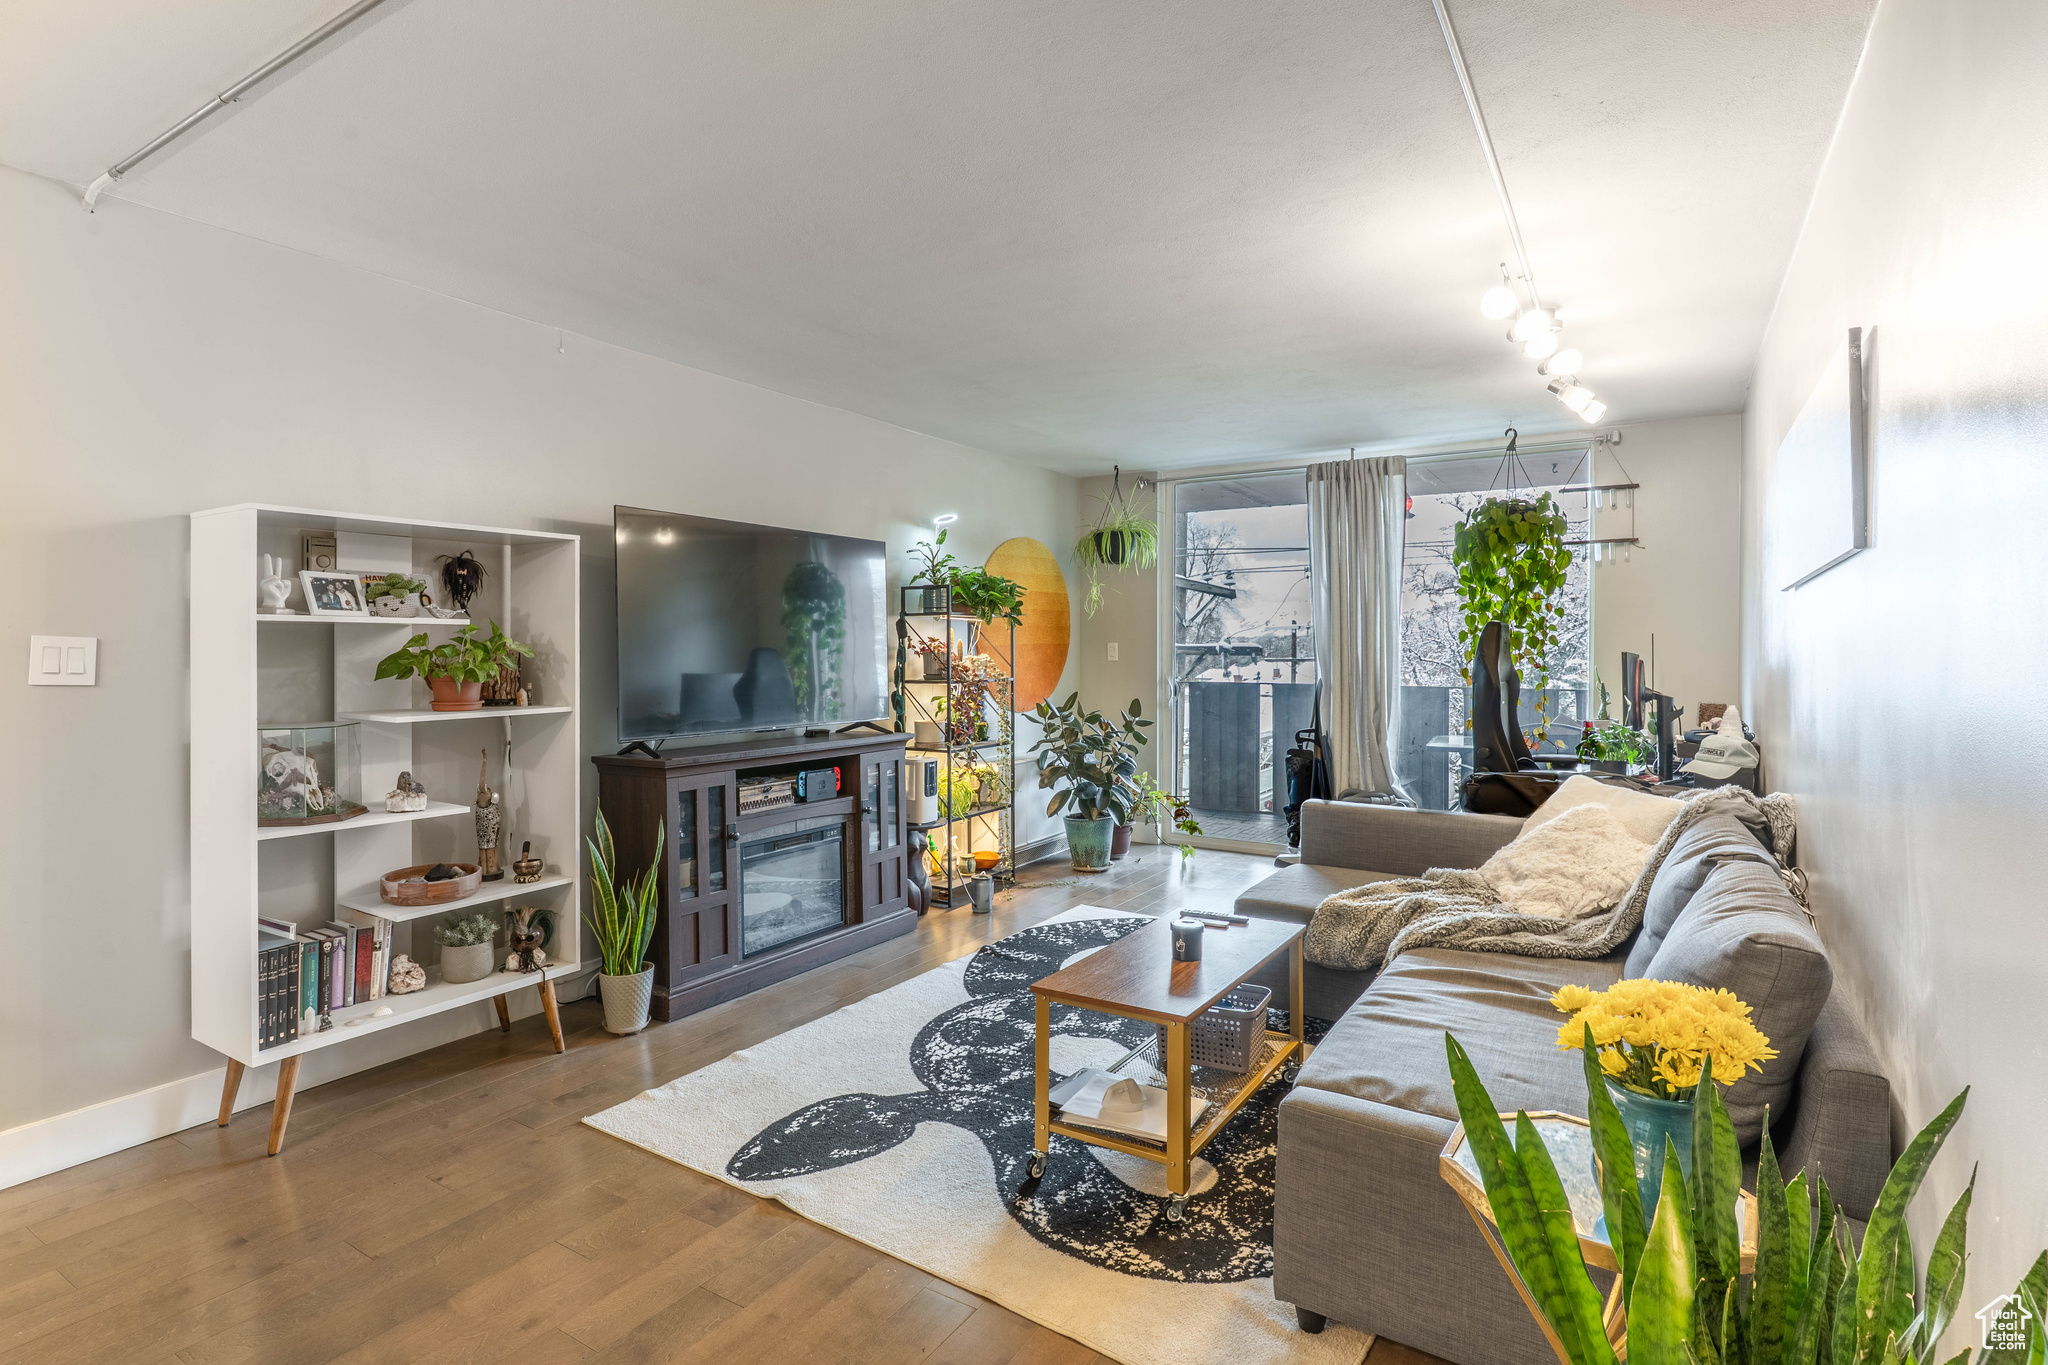
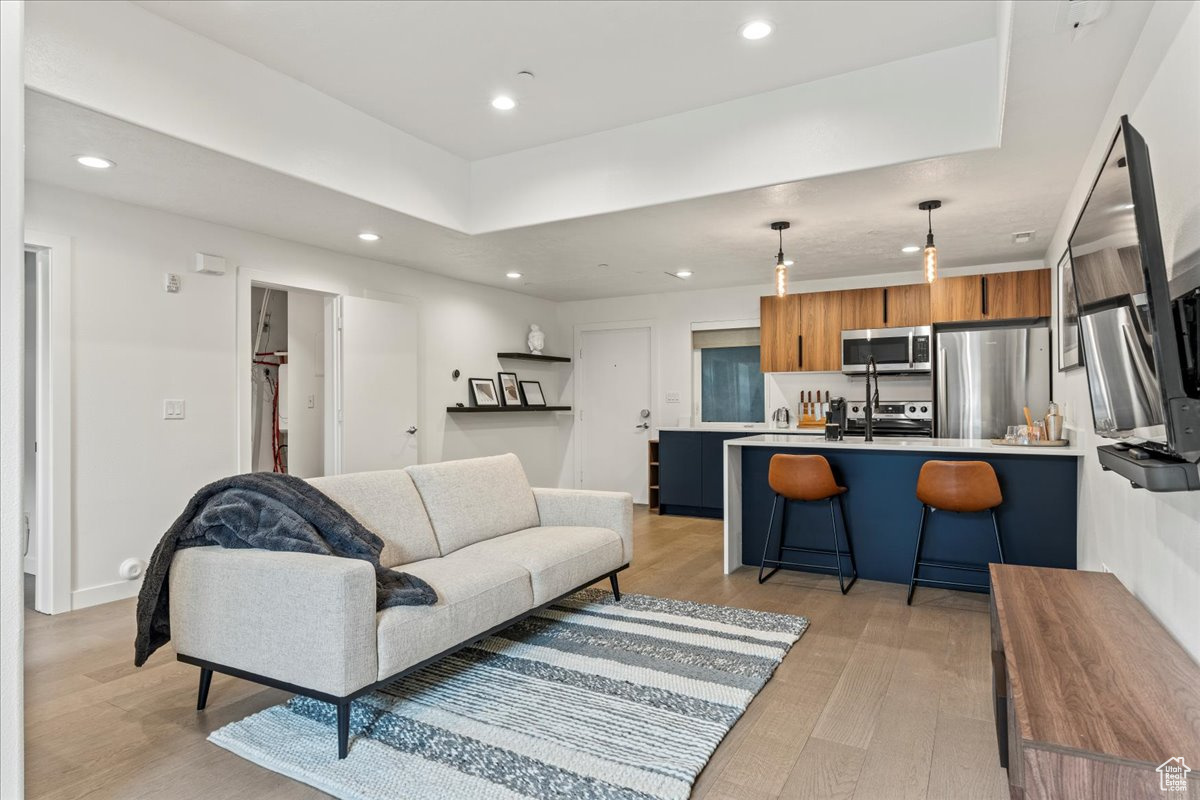
725 S 200 W, Salt Lake City, UT 84101
$-626
Cash flow
-10.2%
Cash-on-Cash Return
3.9%
Cap rate
0.6%
Rent to Value Ratio
678 out of 780 properties for sale in Salt Lake City, UT
Limited Results Shown
Create a free account, or log in to reveal all property listings and enjoy the complete experience.
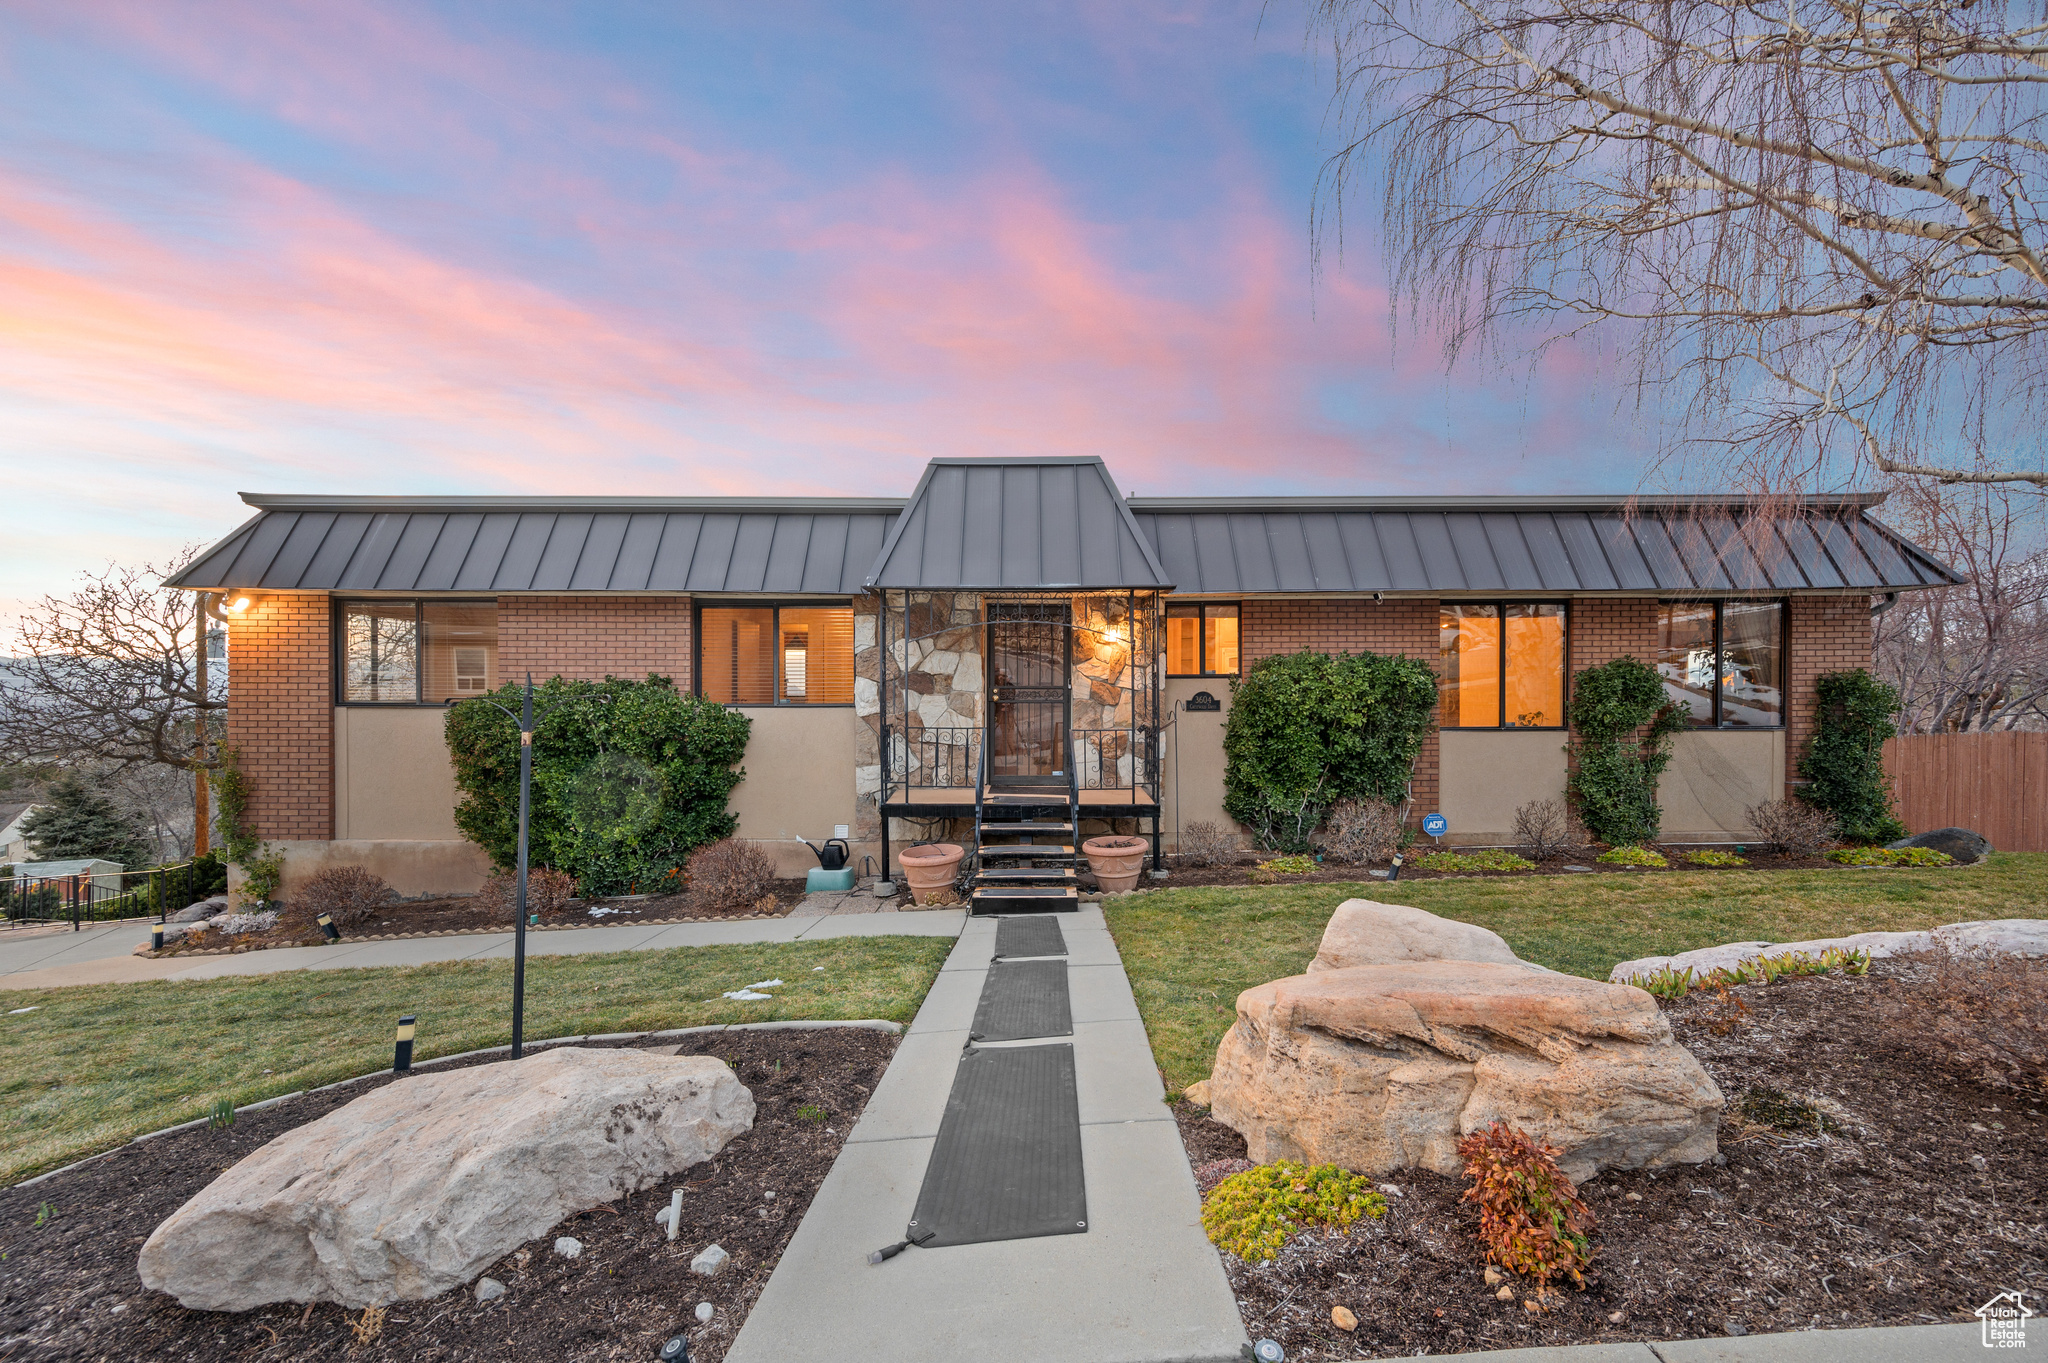
Active
$1,300,000
4
bds
|
3
ba
|
4,135
sqft
|
built
1968
3604 S Crestwood Dr, Salt Lake City, UT 84109
$-5,083
Cash flow
-20.4%
Cash-on-Cash Return
1.6%
Cap rate
0.2%
Rent to Value Ratio
Active
$399,900
3
bds
|
1
ba
|
998
sqft
|
built
1909
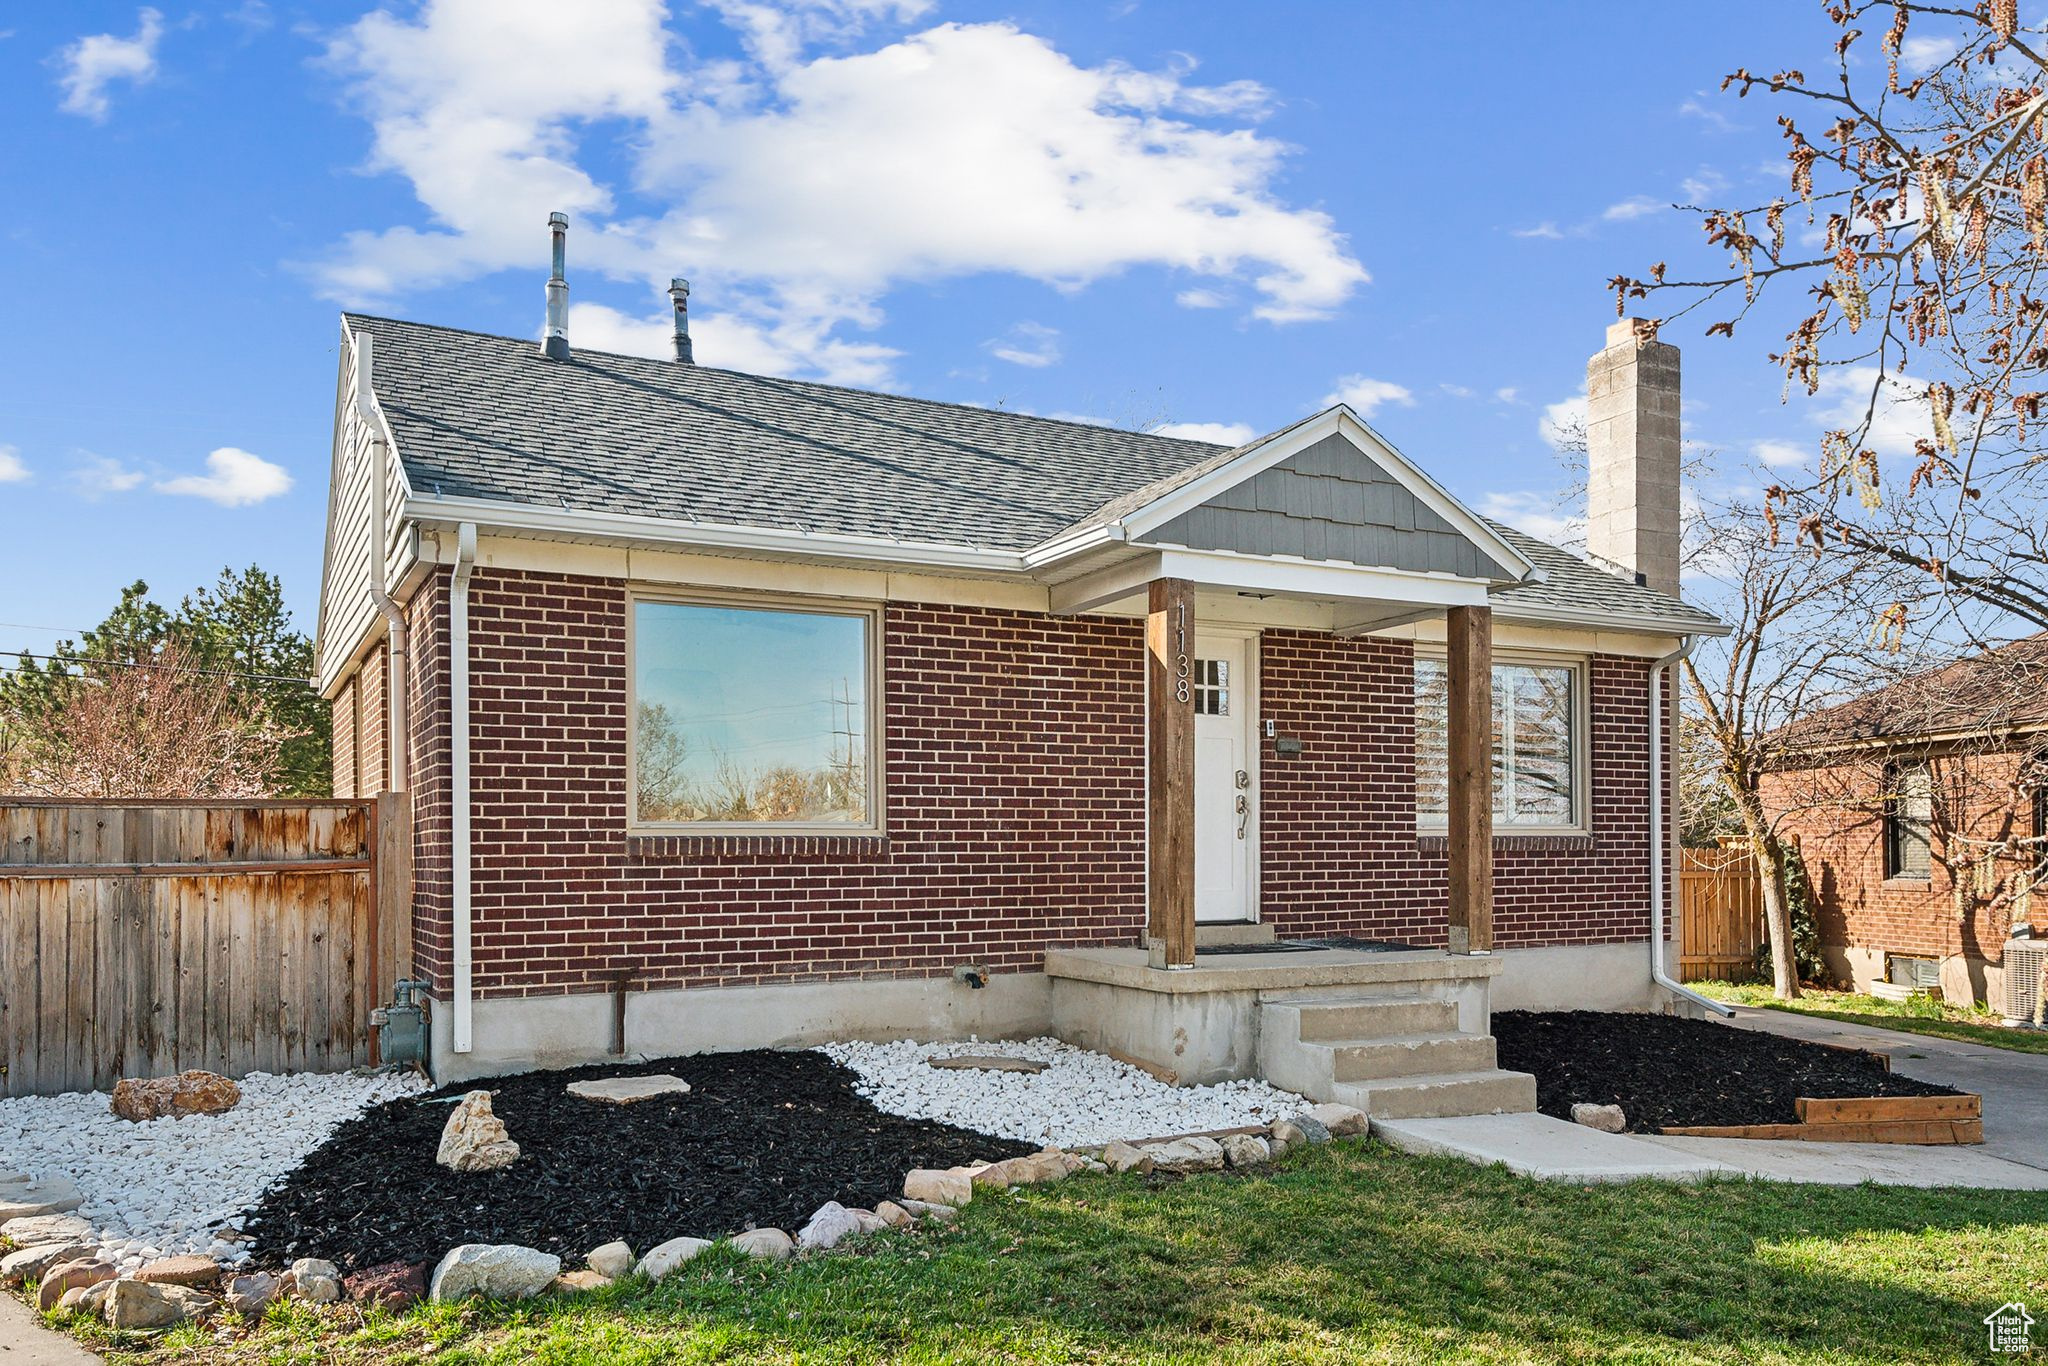
1022 W 400 N, Salt Lake City, UT 84116
$-1,106
Cash flow
-14.4%
Cash-on-Cash Return
3.0%
Cap rate
0.4%
Rent to Value Ratio

Active
$12,500,000
4
bds
|
9
ba
|
11,438
sqft
|
built
1992
3826 E Thousand Oaks Cir, Salt Lake City, UT 84124
$-64,301
Cash flow
-26.8%
Cash-on-Cash Return
0.1%
Cap rate
0.1%
Rent to Value Ratio
Active
$345,000
1
bds
|
1
ba
|
694
sqft
|
built
1901
251 N Center St, Salt Lake City, UT 84103
$-917
Cash flow
-13.9%
Cash-on-Cash Return
3.1%
Cap rate
0.5%
Rent to Value Ratio
Active
$549,500
3
bds
|
2
ba
|
1,547
sqft
|
built
1924
248 E Westminster Ave, Salt Lake City, UT 84115
$-1,783
Cash flow
-16.9%
Cash-on-Cash Return
2.4%
Cap rate
0.3%
Rent to Value Ratio
Active
$711,000
4
bds
|
2
ba
|
1,866
sqft
|
built
1929
1592 S 1300 E, Salt Lake City, UT 84105
$-1,862
Cash flow
-13.7%
Cash-on-Cash Return
3.1%
Cap rate
0.4%
Rent to Value Ratio
Active
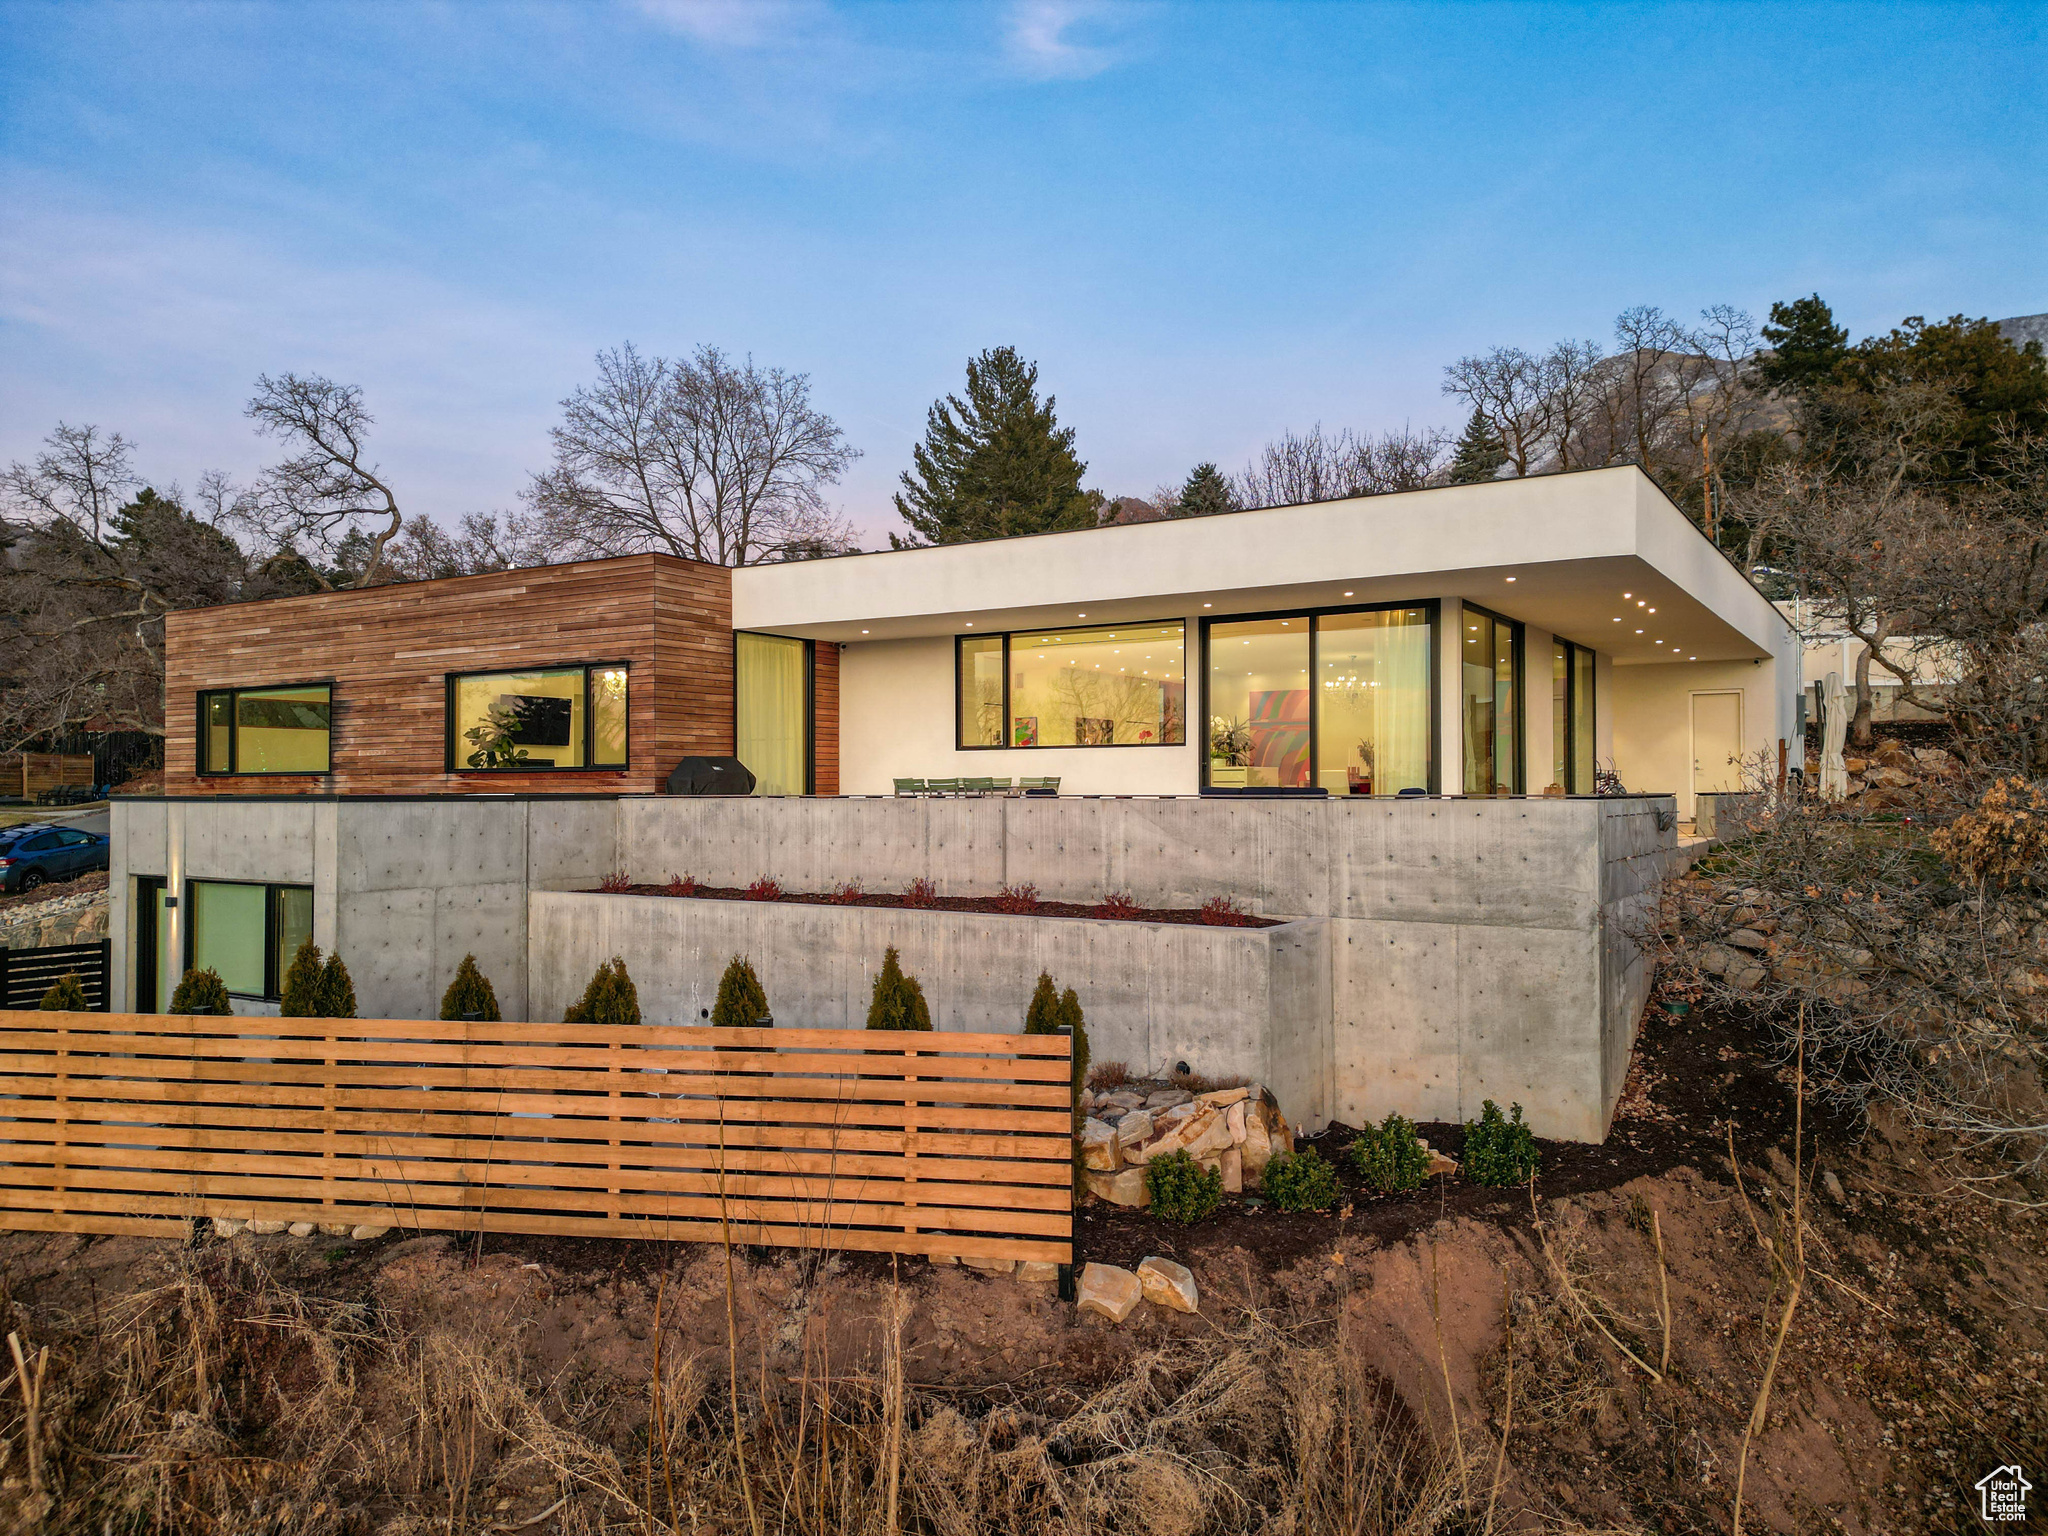
$1,849,000
5
bds
|
4
ba
|
4,823
sqft
|
built
1949
3404 S 2130 E, Salt Lake City, UT 84109
$-7,472
Cash flow
-21.1%
Cash-on-Cash Return
1.4%
Cap rate
0.2%
Rent to Value Ratio
Active
$419,500
3
bds
|
1
ba
|
768
sqft
|
built
1940
1505 W Shelley Ave, Salt Lake City, UT 84119
$-1,291
Cash flow
-16.1%
Cash-on-Cash Return
2.6%
Cap rate
0.4%
Rent to Value Ratio
Active
$439,900
3
bds
|
2
ba
|
1,638
sqft
|
built
1965
3734 S Bannock St, Salt Lake City, UT 84120
$-1,120
Cash flow
-13.3%
Cash-on-Cash Return
3.2%
Cap rate
0.5%
Rent to Value Ratio
Active
$585,000
7
bds
|
4
ba
|
2,158
sqft
|
built
1914
535 S Post St, Salt Lake City, UT 84104
$-2,001
Cash flow
-17.8%
Cash-on-Cash Return
2.2%
Cap rate
0.3%
Rent to Value Ratio
Active
$1,599,000
3
bds
|
2
ba
|
1,868
sqft
|
built
1985
230 E Broadway, Salt Lake City, UT 84111
$-6,470
Cash flow
-21.1%
Cash-on-Cash Return
1.4%
Cap rate
0.3%
Rent to Value Ratio
Active
$258,000
1
bds
|
1
ba
|
691
sqft
|
built
1963
87 W 300 N, Salt Lake City, UT 84103
$-531
Cash flow
-10.7%
Cash-on-Cash Return
3.8%
Cap rate
0.7%
Rent to Value Ratio
Active
$725,000
2
bds
|
3
ba
|
2,140
sqft
|
built
1985
171 E 3rd Ave, Salt Lake City, UT 84103
$-2,615
Cash flow
-18.8%
Cash-on-Cash Return
2.0%
Cap rate
0.4%
Rent to Value Ratio
Active
$819,900
5
bds
|
3
ba
|
2,292
sqft
|
built
1959
1220 E 1300 S, Salt Lake City, UT 84105
$-3,077
Cash flow
-19.6%
Cash-on-Cash Return
1.8%
Cap rate
0.3%
Rent to Value Ratio
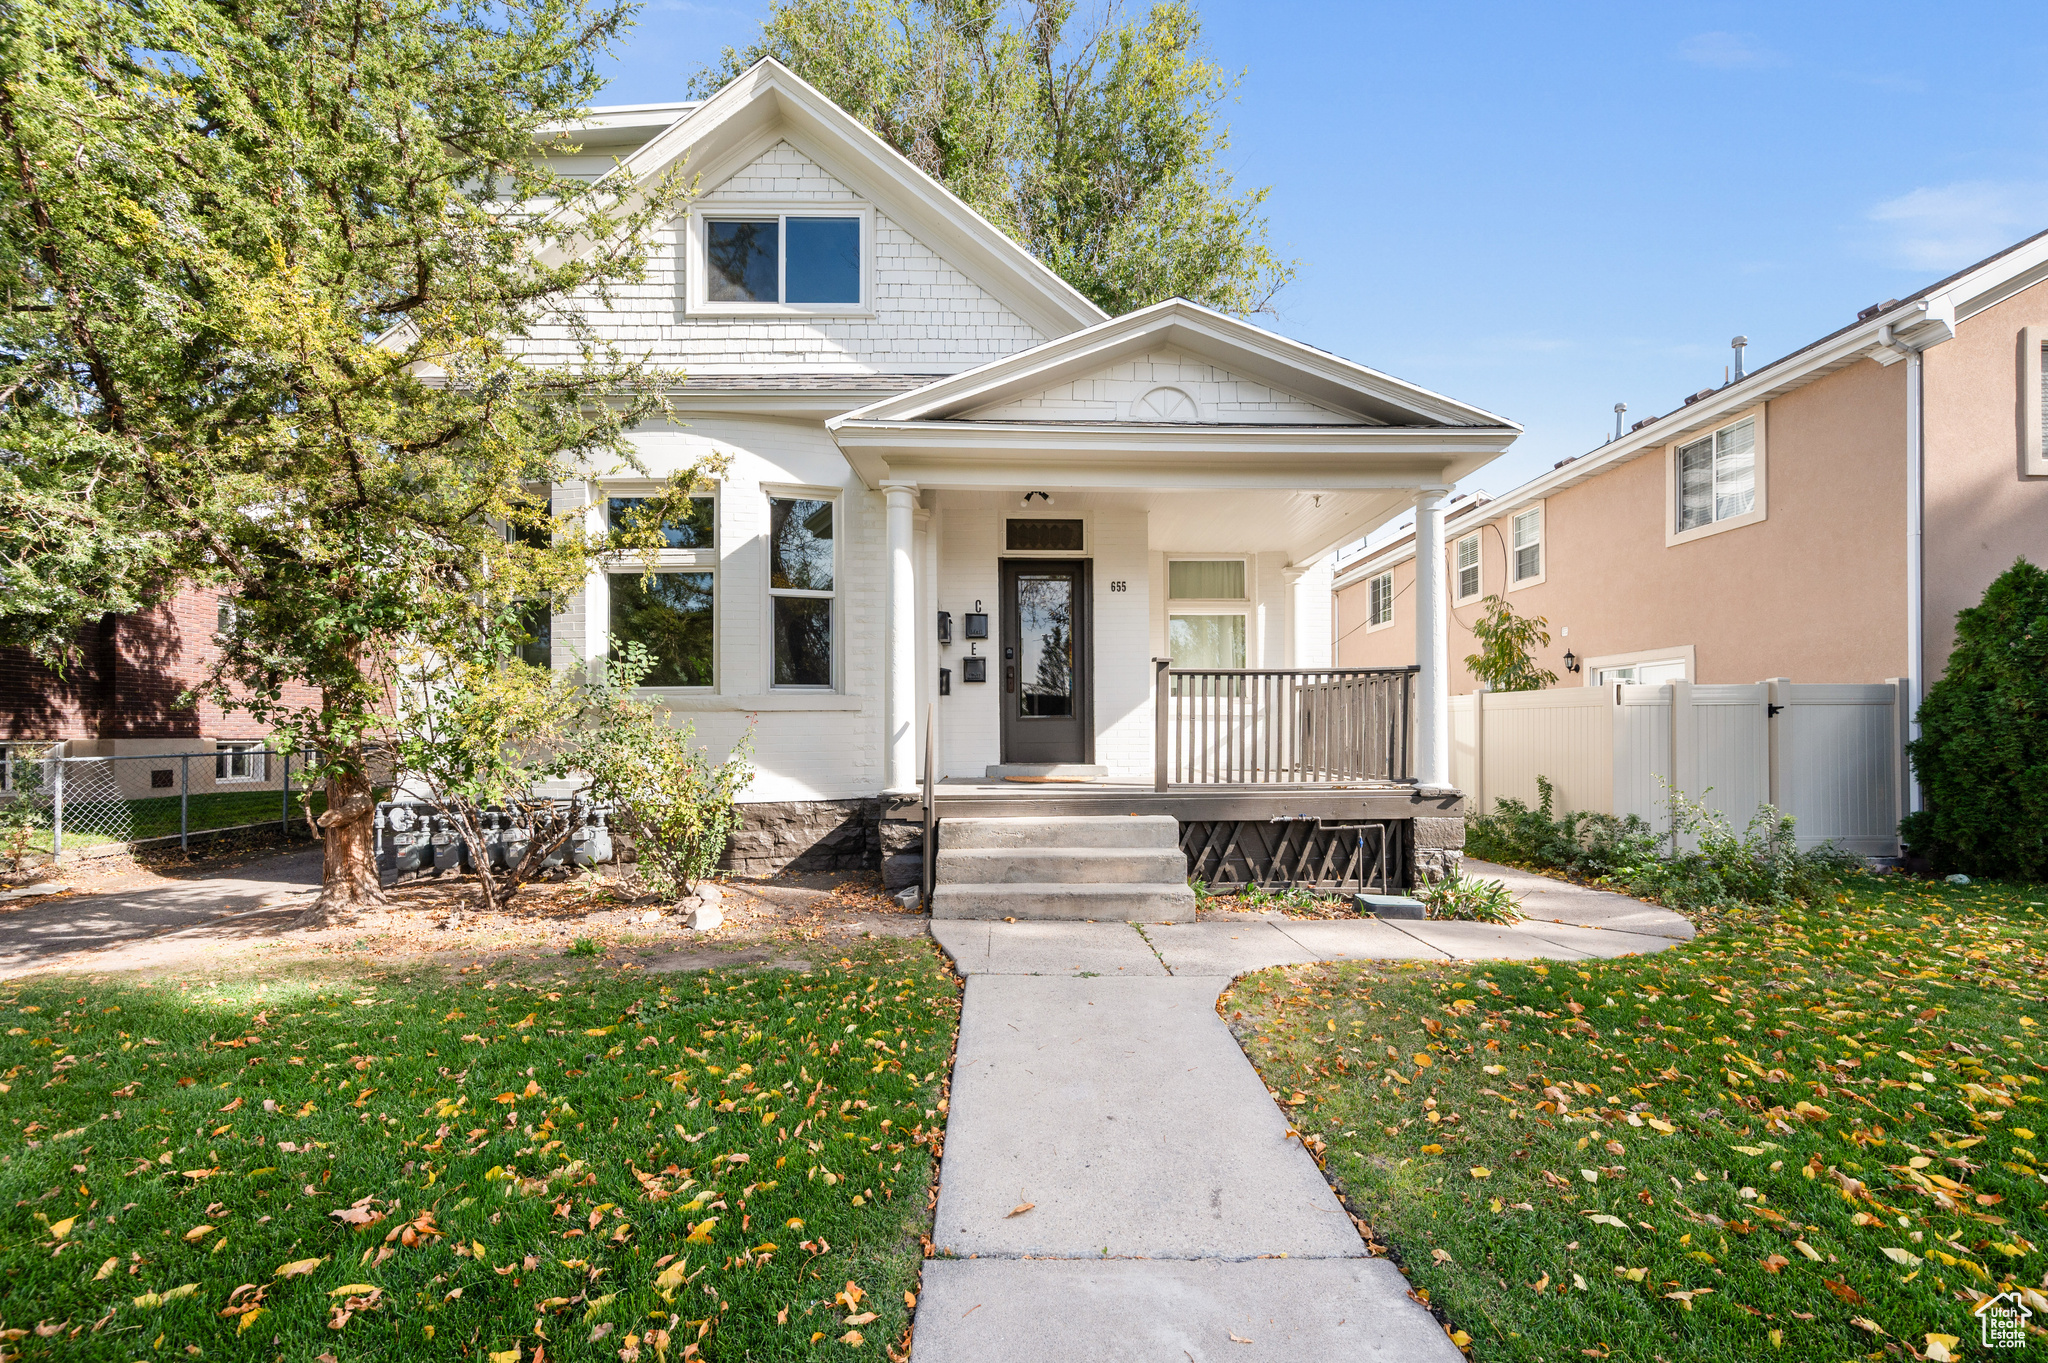
Active
$1,299,000
7
bds
|
5
ba
|
3,579
sqft
|
built
1906
655 S 800 E, Salt Lake City, UT 84102
$-5,267
Cash flow
-21.2%
Cash-on-Cash Return
1.4%
Cap rate
0.2%
Rent to Value Ratio
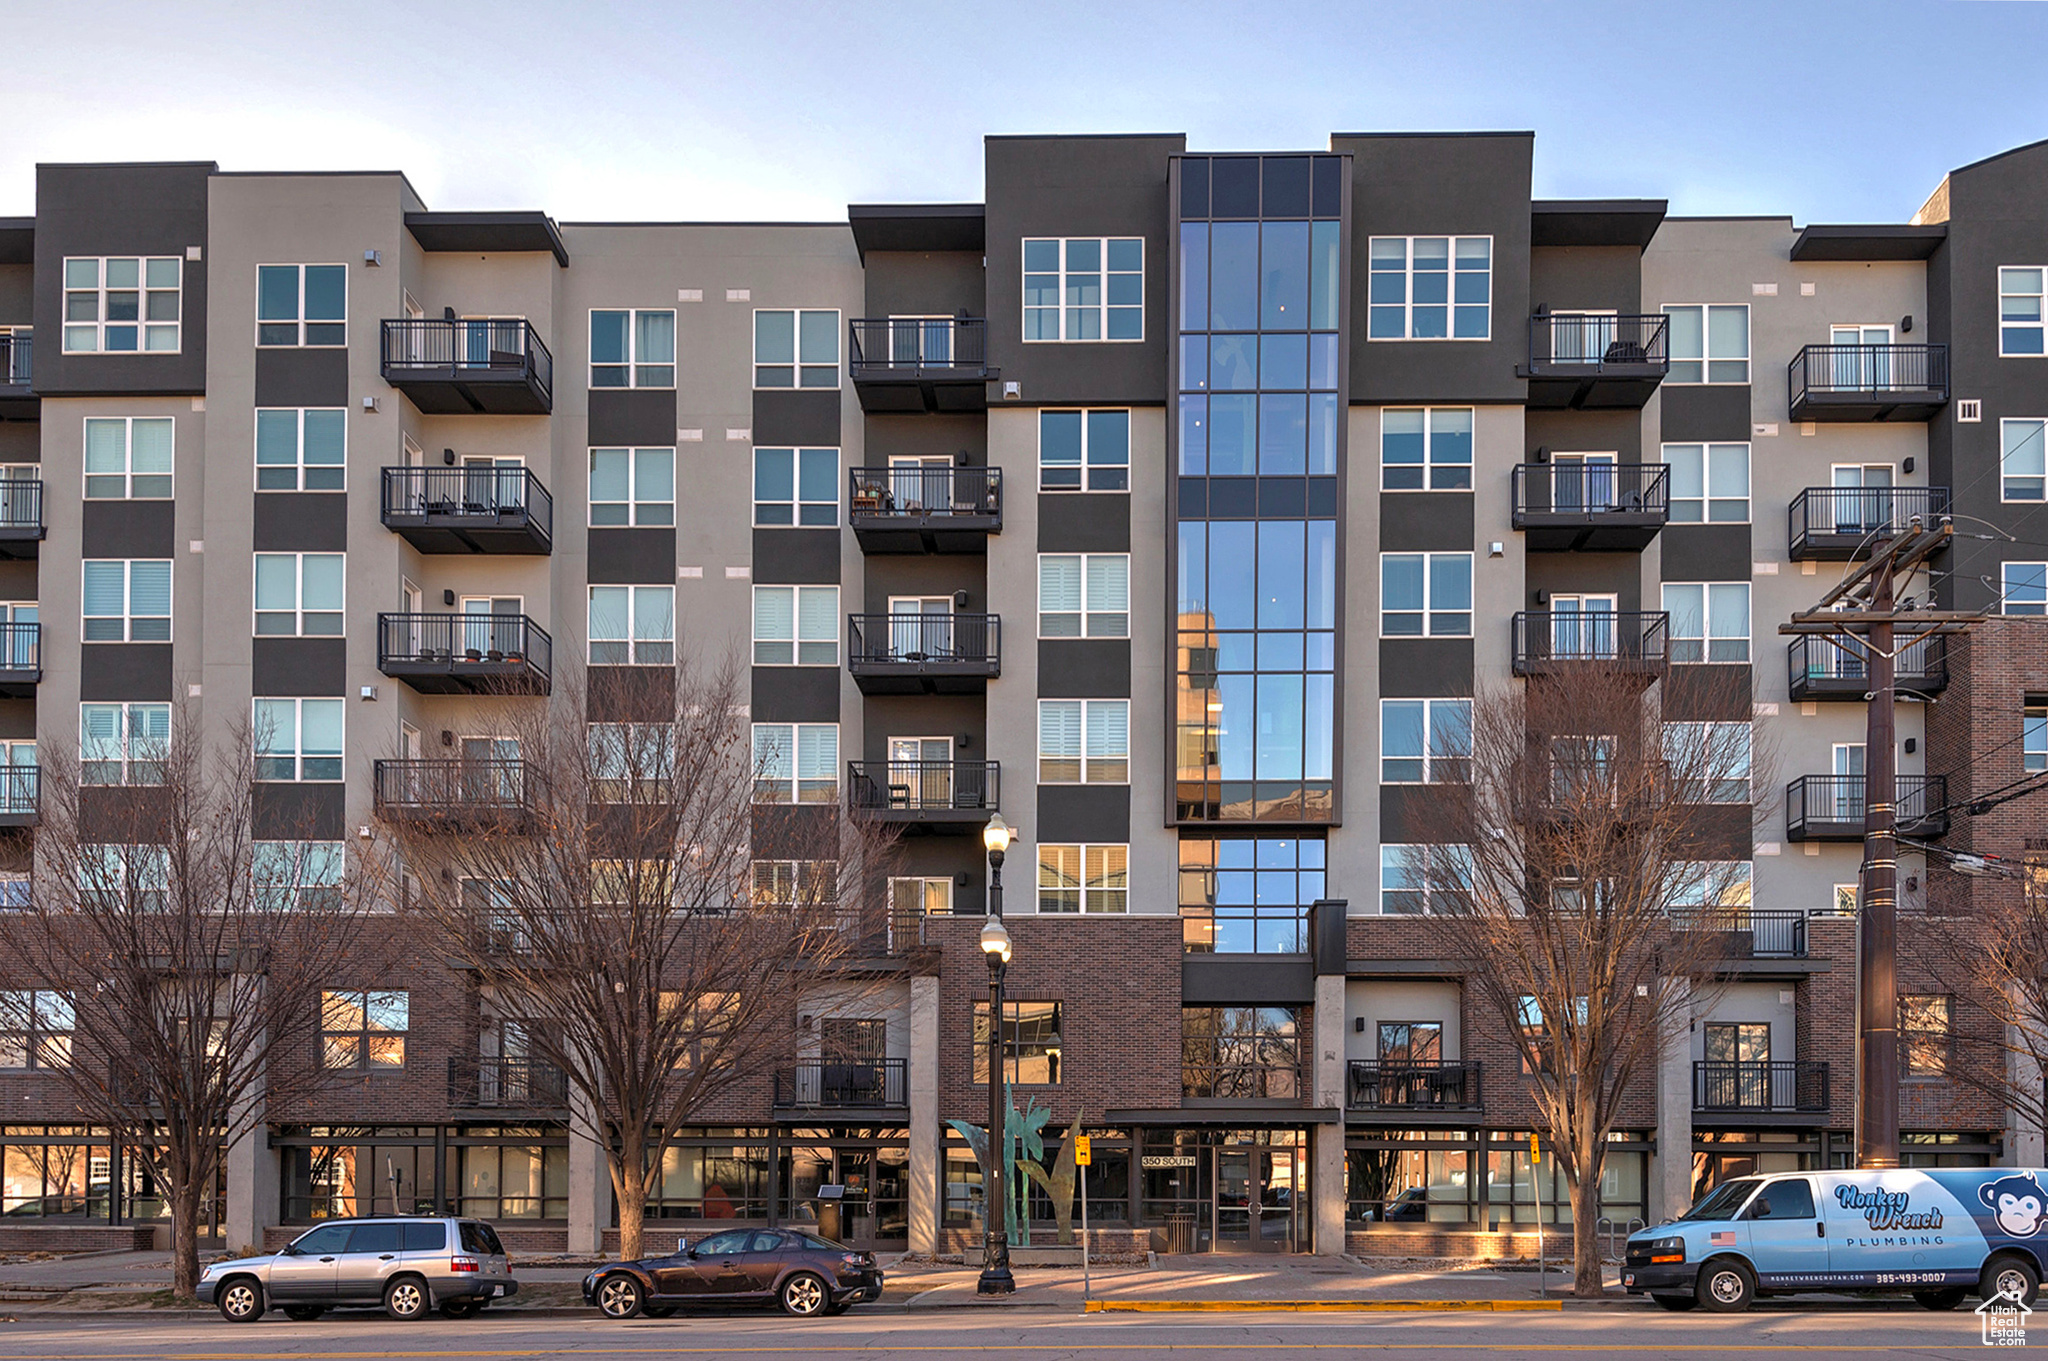
Active
$330,000
1
bds
|
1
ba
|
763
sqft
|
built
2008
350 S 200 E, Salt Lake City, UT 84111
$-988
Cash flow
-15.6%
Cash-on-Cash Return
2.7%
Cap rate
0.6%
Rent to Value Ratio
Active
$599,990
6
bds
|
3
ba
|
2,490
sqft
|
built
2000
1762 W Irie Ln, Salt Lake City, UT 84116
$-944
Cash flow
-8.2%
Cash-on-Cash Return
4.4%
Cap rate
0.6%
Rent to Value Ratio
Active
$319,000
1
bds
|
2
ba
|
755
sqft
|
built
2007
725 S 200 W, Salt Lake City, UT 84101
$-626
Cash flow
-10.2%
Cash-on-Cash Return
3.9%
Cap rate
0.6%
Rent to Value Ratio
Active
$345,000
2
bds
|
1
ba
|
686
sqft
|
built
1951
130 S 1300 E, Salt Lake City, UT 84102
$-1,353
Cash flow
-20.5%
Cash-on-Cash Return
1.6%
Cap rate
0.5%
Rent to Value Ratio
Active
$215,000
1
bds
|
1
ba
|
392
sqft
|
built
1951
130 S 1300 E, Salt Lake City, UT 84102
$-761
Cash flow
-18.5%
Cash-on-Cash Return
2.0%
Cap rate
0.5%
Rent to Value Ratio

Active
$465,000
3
bds
|
2
ba
|
1,680
sqft
|
built
1967
6357 W 3570 S, Salt Lake City, UT 84128
$-1,477
Cash flow
-16.6%
Cash-on-Cash Return
2.5%
Cap rate
0.4%
Rent to Value Ratio
Active
$529,000
5
bds
|
2
ba
|
2,306
sqft
|
built
1963
3664 W 3965 S, Salt Lake City, UT 84120
$-1,811
Cash flow
-17.9%
Cash-on-Cash Return
2.2%
Cap rate
0.3%
Rent to Value Ratio
Active
$1,430,000
8
bds
|
4
ba
|
4,642
sqft
|
built
1909
1027 E Emerson Ave, Salt Lake City, UT 84105
$-5,438
Cash flow
-19.8%
Cash-on-Cash Return
1.7%
Cap rate
0.3%
Rent to Value Ratio
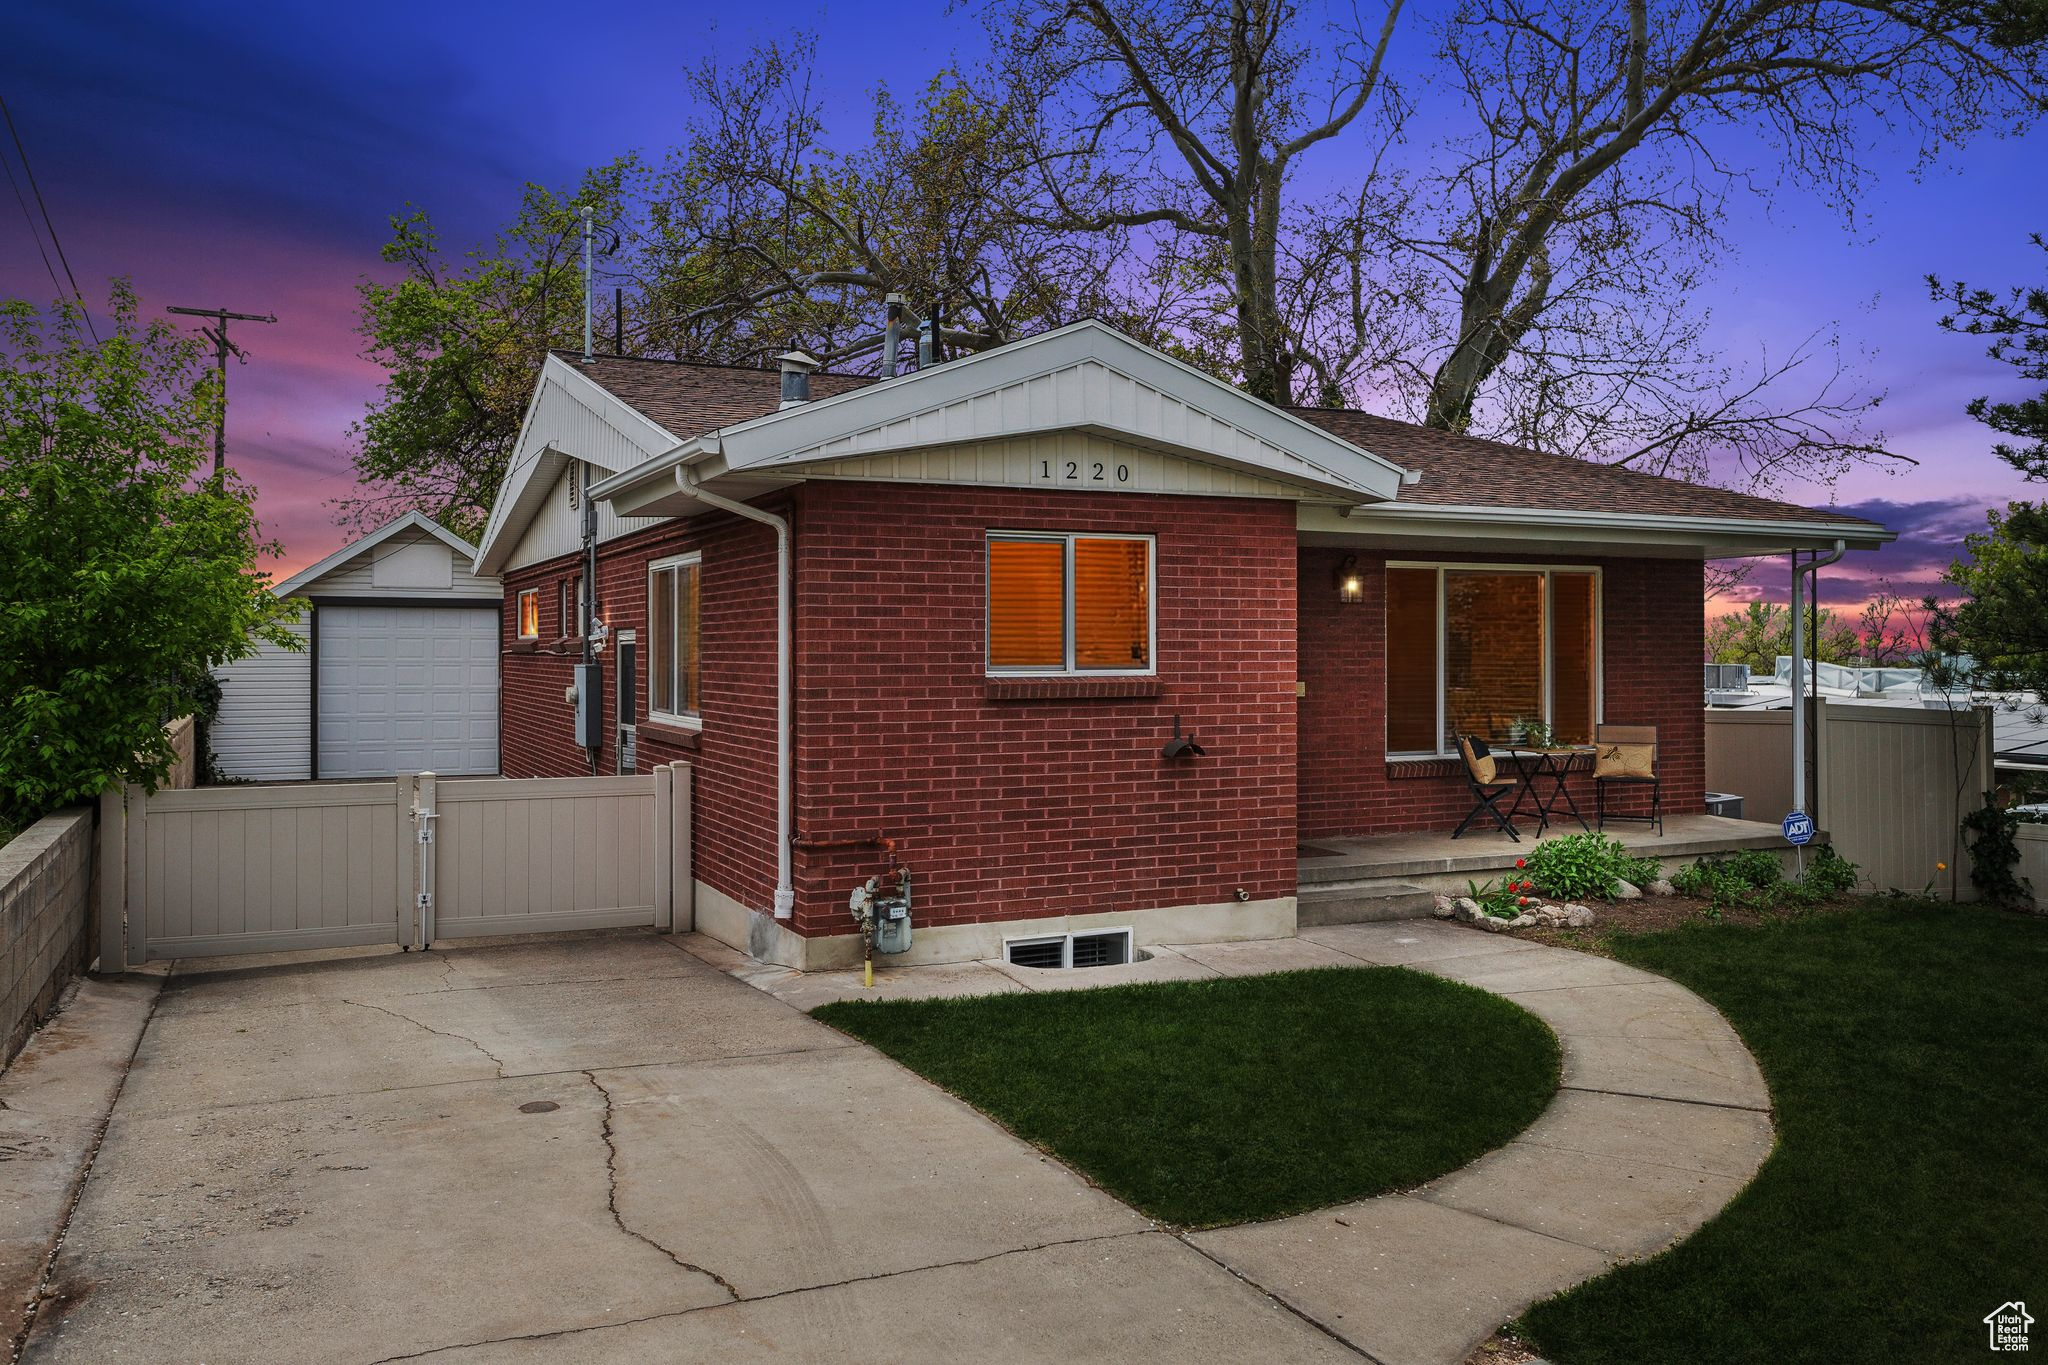
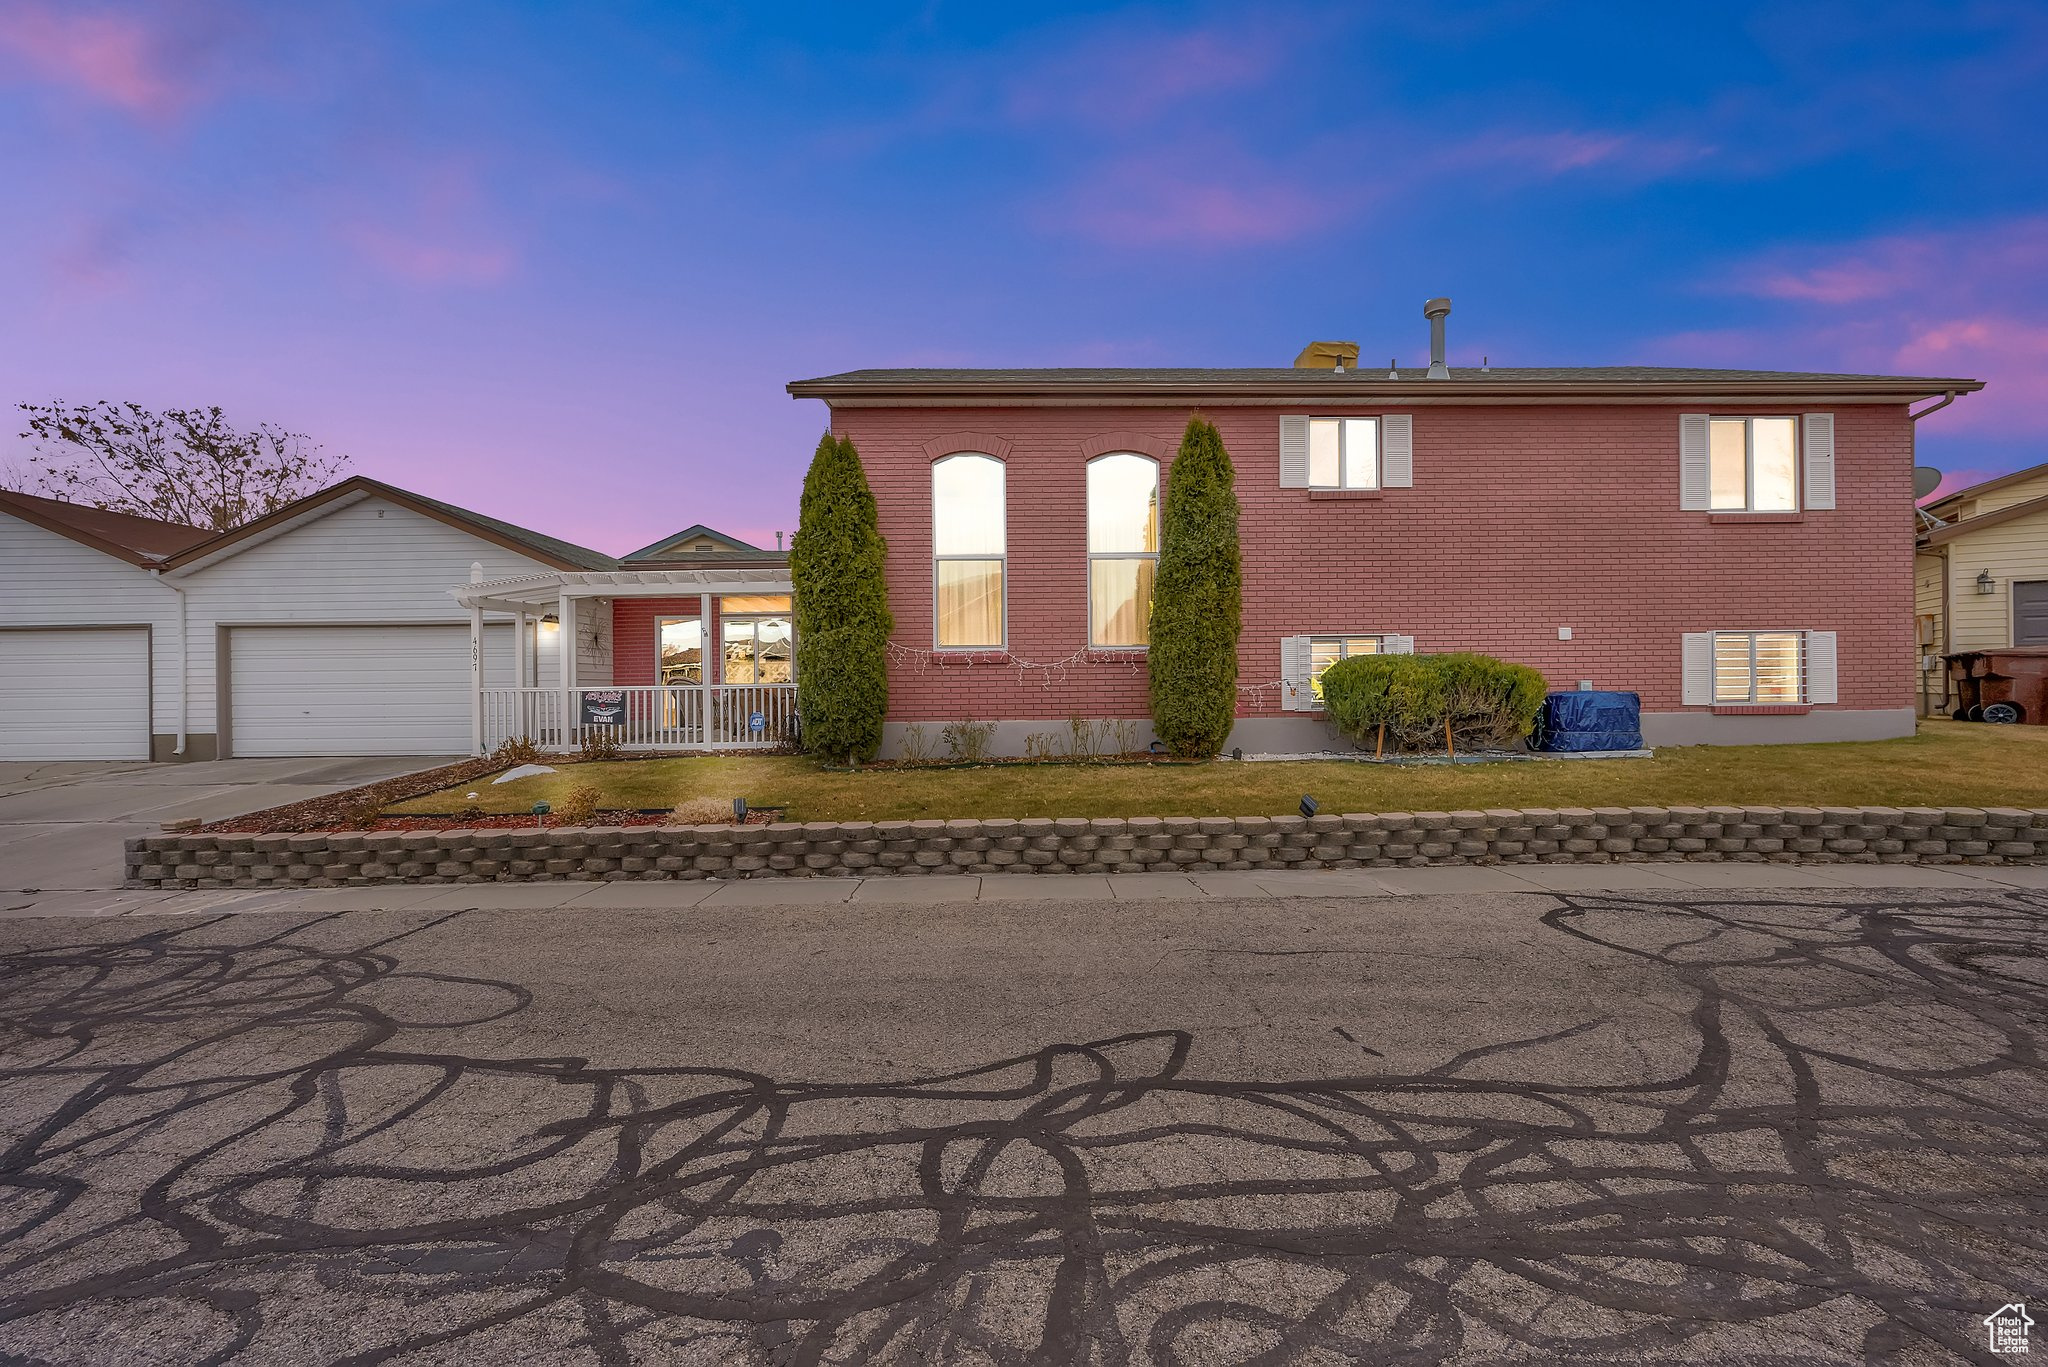
Active
$534,900
4
bds
|
2
ba
|
1,440
sqft
|
built
1960
1540 S 900 W, Salt Lake City, UT 84104
$-1,235
Cash flow
-12.0%
Cash-on-Cash Return
3.5%
Cap rate
0.5%
Rent to Value Ratio

Active
$579,999
5
bds
|
2
ba
|
2,184
sqft
|
built
1973
4129 S 3600 W, Salt Lake City, UT 84119
$-2,069
Cash flow
-18.6%
Cash-on-Cash Return
2.0%
Cap rate
0.3%
Rent to Value Ratio
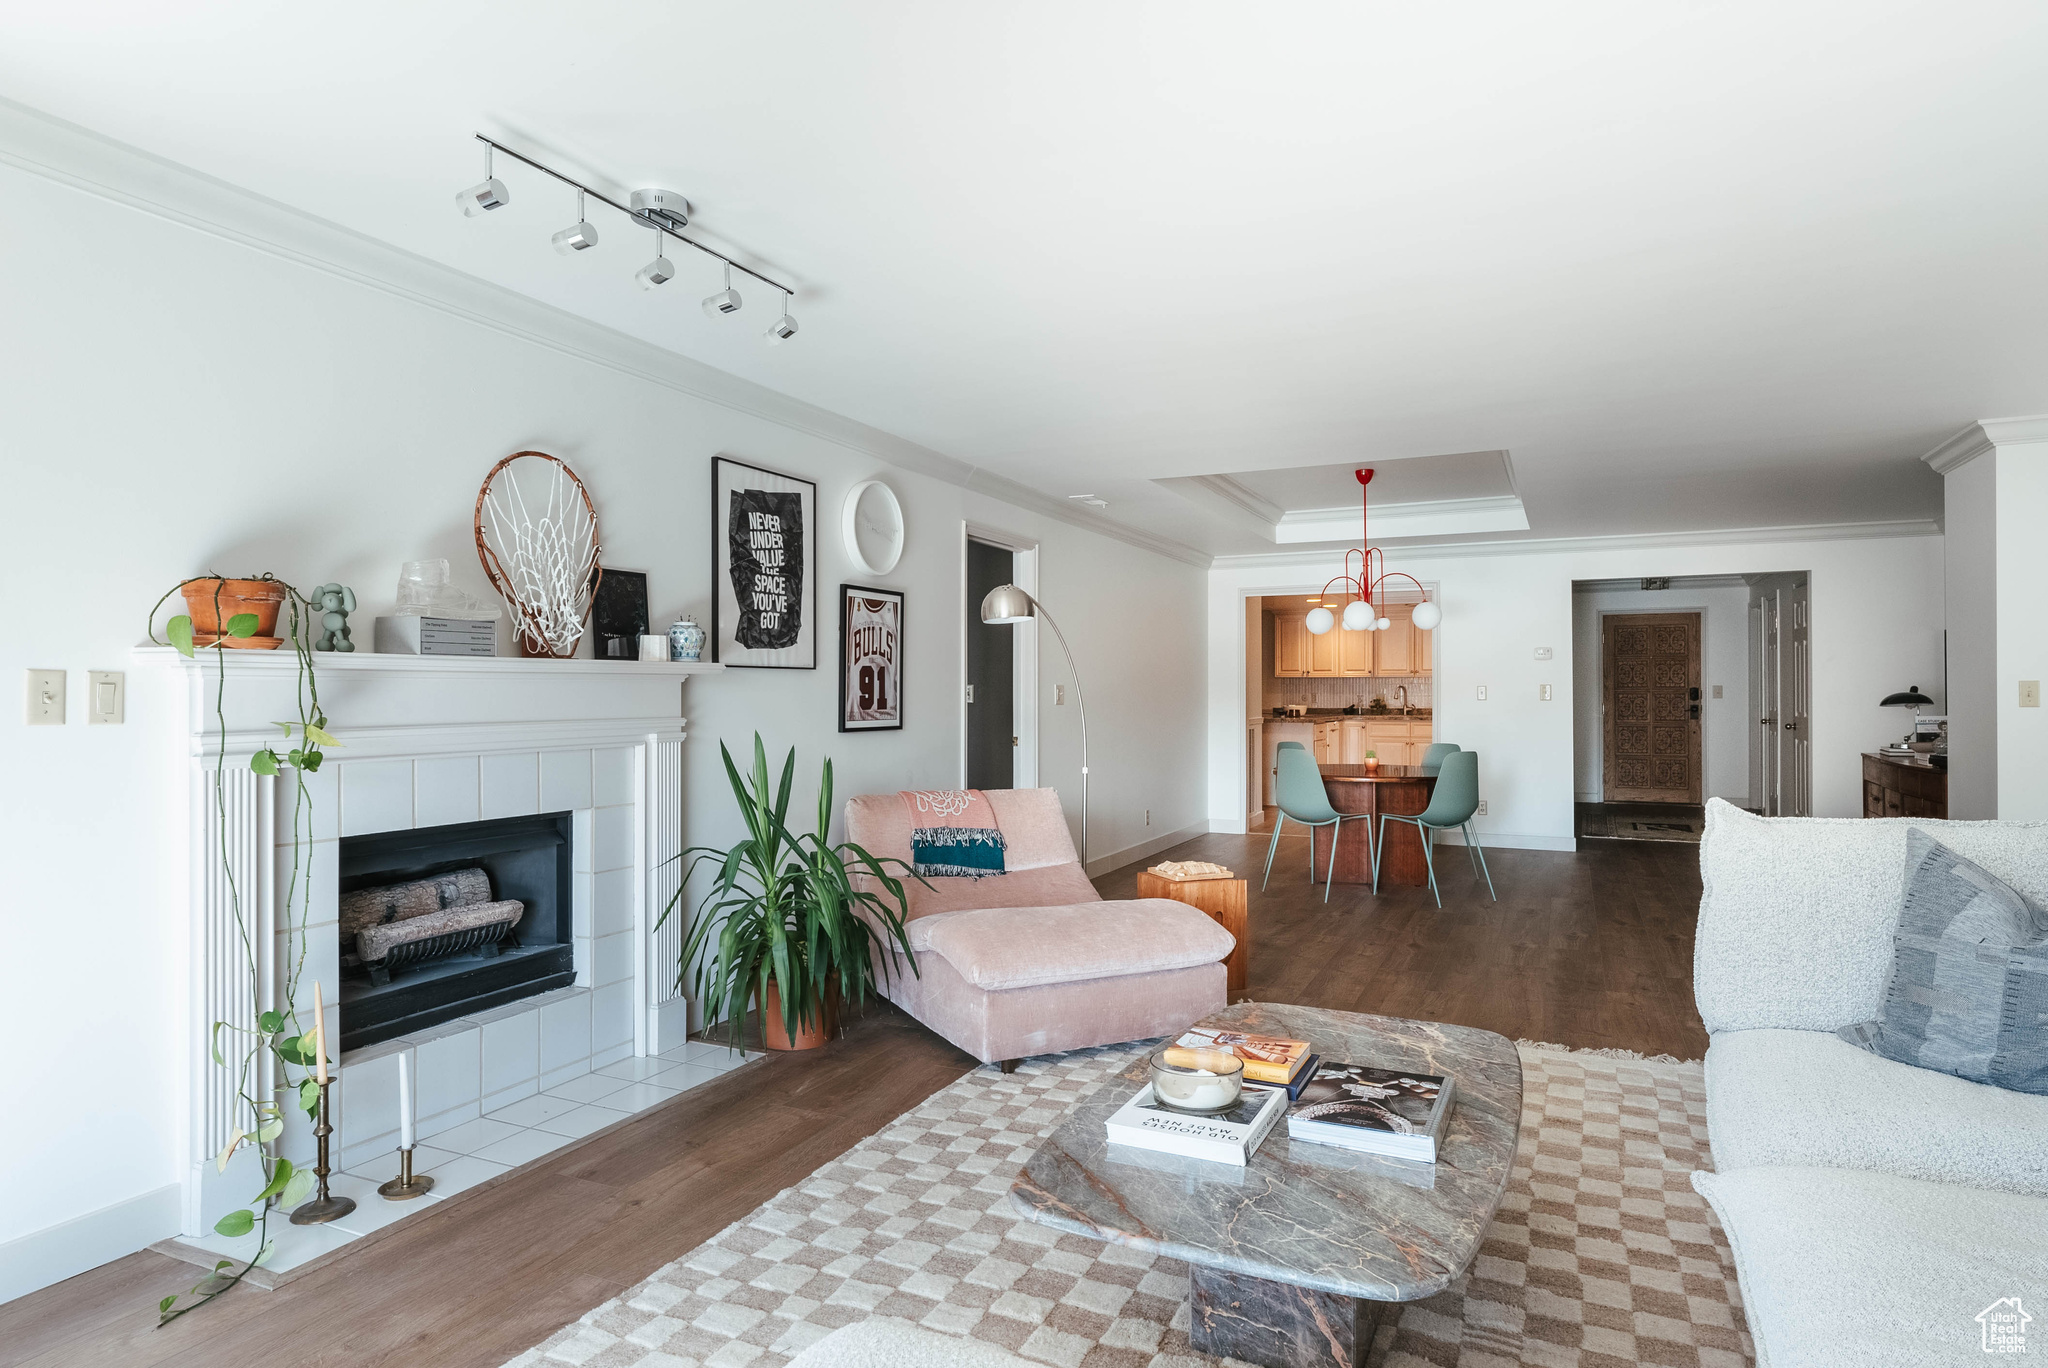
Active
$1,049,500
3
bds
|
3
ba
|
1,730
sqft
|
built
1923
1202 E Princeton Ave, Salt Lake City, UT 84105
$-3,112
Cash flow
-15.5%
Cash-on-Cash Return
2.7%
Cap rate
0.4%
Rent to Value Ratio
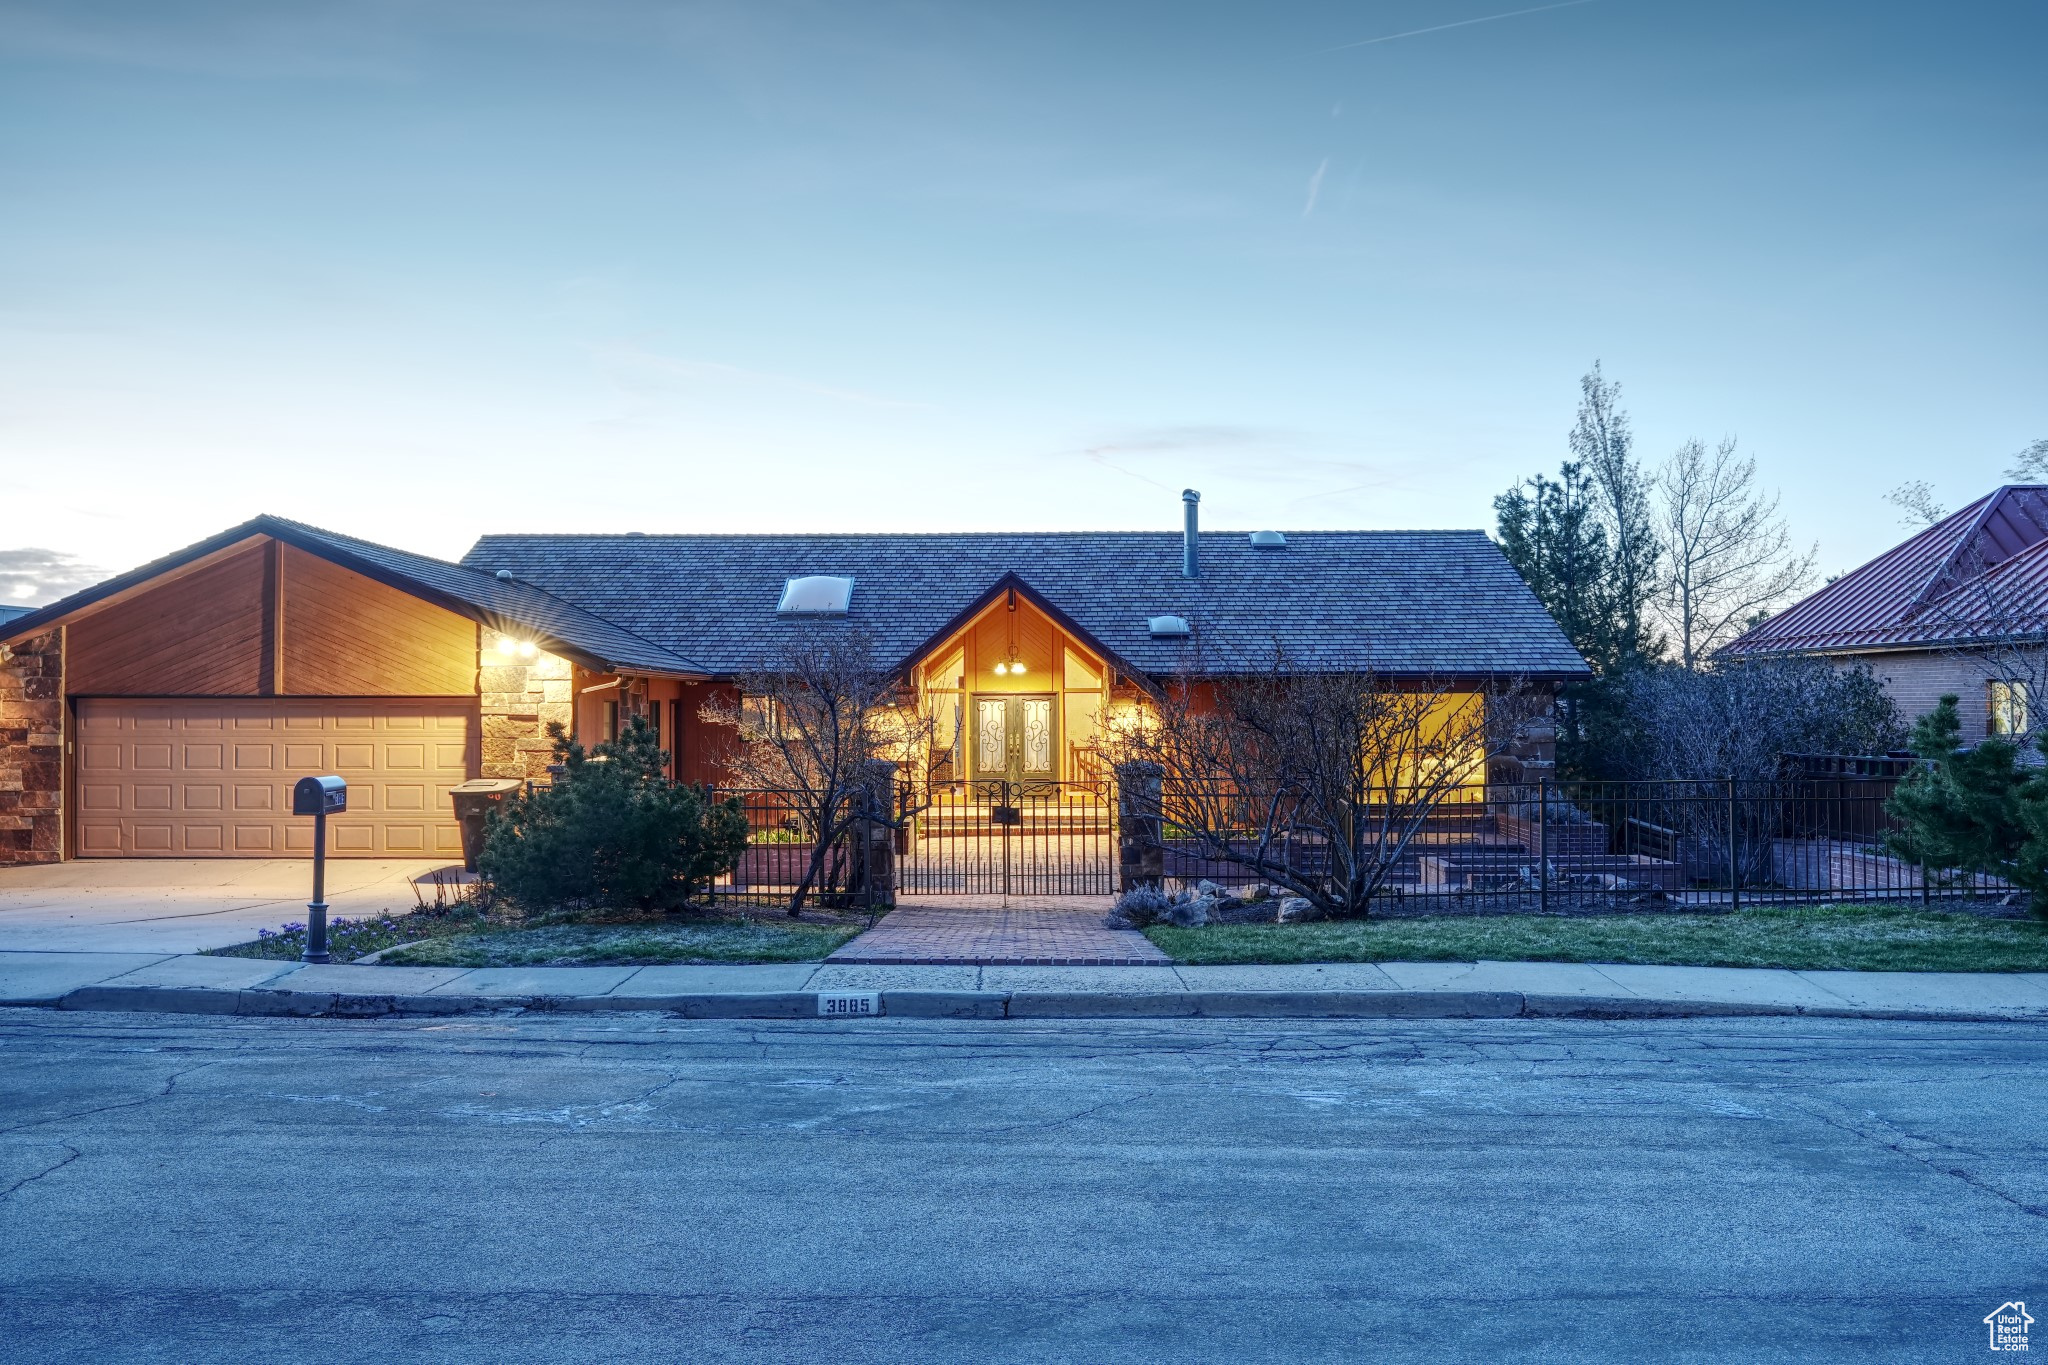
Active
$2,250,000
6
bds
|
6
ba
|
8,618
sqft
|
built
1979
3885 E Viewcrest Dr, Salt Lake City, UT 84124
$-10,035
Cash flow
-23.3%
Cash-on-Cash Return
0.9%
Cap rate
0.2%
Rent to Value Ratio
Active
$470,000
4
bds
|
2
ba
|
2,096
sqft
|
built
1968
4511 S Early Duke St, Salt Lake City, UT 84120
$-948
Cash flow
-10.5%
Cash-on-Cash Return
3.9%
Cap rate
0.5%
Rent to Value Ratio
Active
$3,388,000
7
bds
|
8
ba
|
10,918
sqft
|
built
2016
6153 E Last Monument Cir, Salt Lake City, UT 84108
$-16,168
Cash flow
-24.9%
Cash-on-Cash Return
0.6%
Cap rate
0.2%
Rent to Value Ratio
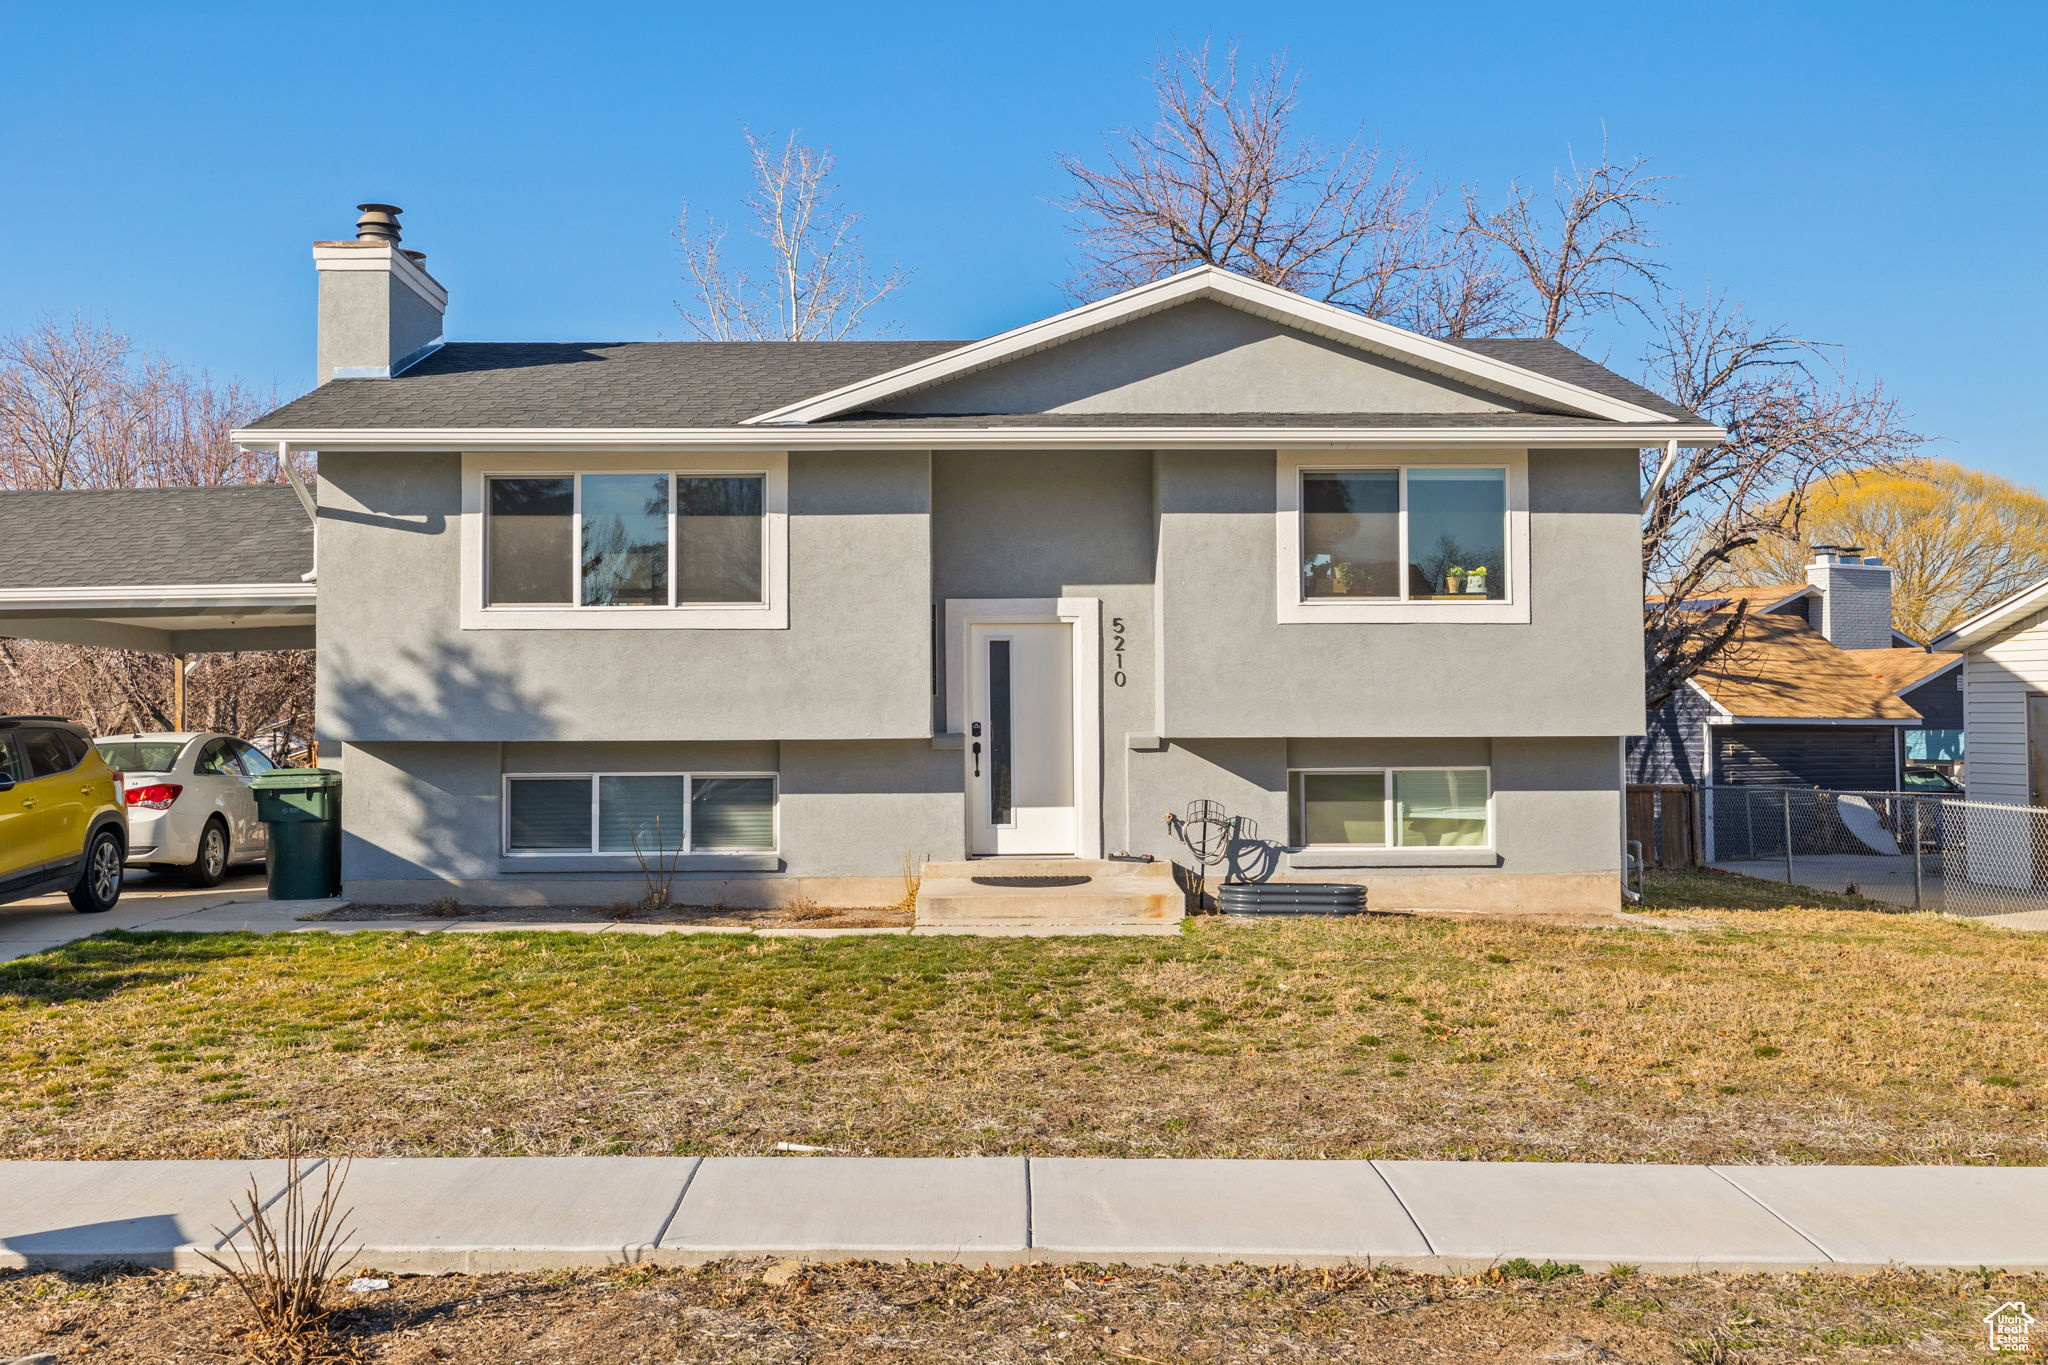
Active
$524,700
4
bds
|
2
ba
|
1,844
sqft
|
built
1977
5210 W Woodledge Ave, Salt Lake City, UT 84120
$-1,049
Cash flow
-10.4%
Cash-on-Cash Return
3.9%
Cap rate
0.5%
Rent to Value Ratio
Active
$499,000
4
bds
|
2
ba
|
1,998
sqft
|
built
1962
3981 S Kewanee Dr, Salt Lake City, UT 84120
$-1,104
Cash flow
-11.5%
Cash-on-Cash Return
3.6%
Cap rate
0.5%
Rent to Value Ratio
Active
$3,375,000
4
bds
|
5
ba
|
4,125
sqft
|
built
2022
2618 E Skyline Dr, Salt Lake City, UT 84108
$-14,808
Cash flow
-22.9%
Cash-on-Cash Return
1.0%
Cap rate
0.2%
Rent to Value Ratio
Active
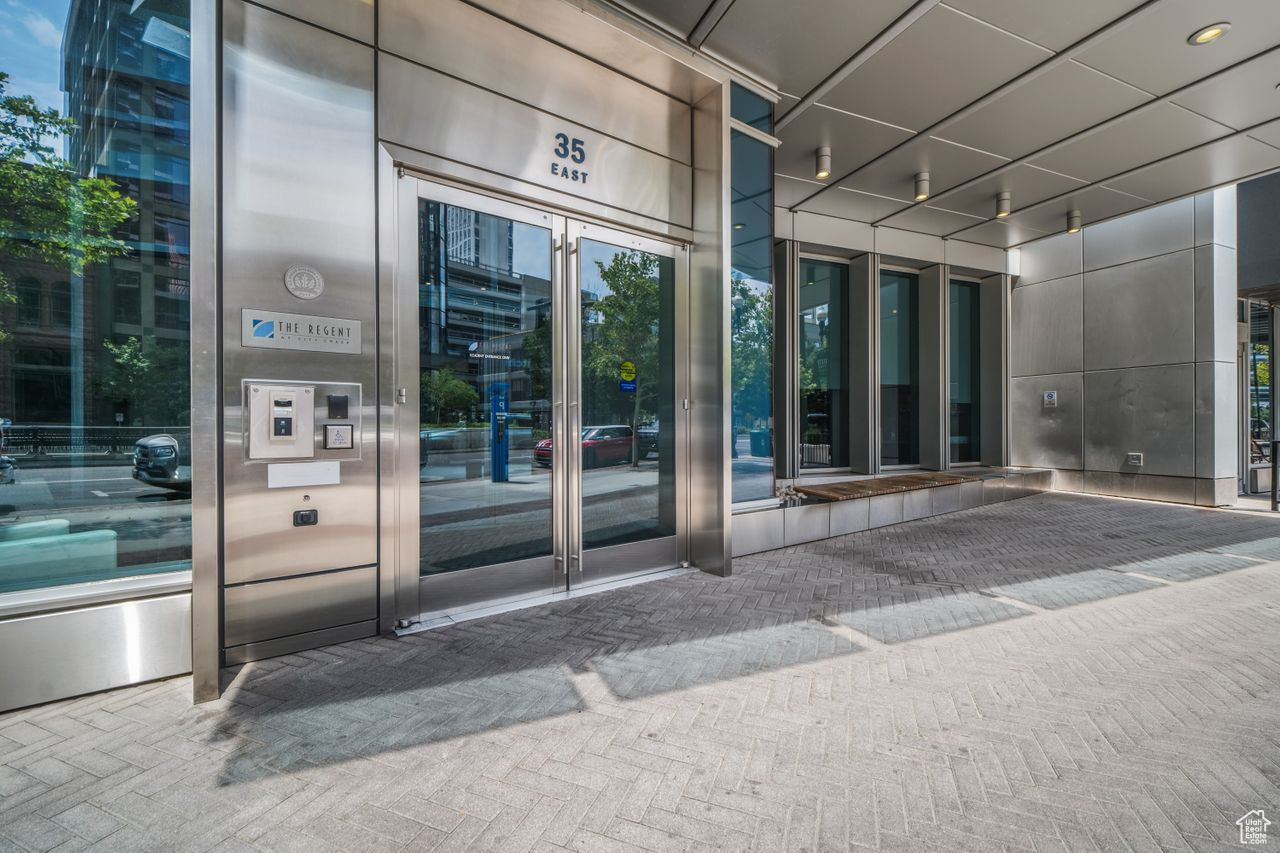
$559,900
1
bds
|
1
ba
|
854
sqft
|
built
2011
35 E 100 S, Salt Lake City, UT 84111
$-2,136
Cash flow
-19.9%
Cash-on-Cash Return
1.7%
Cap rate
0.4%
Rent to Value Ratio
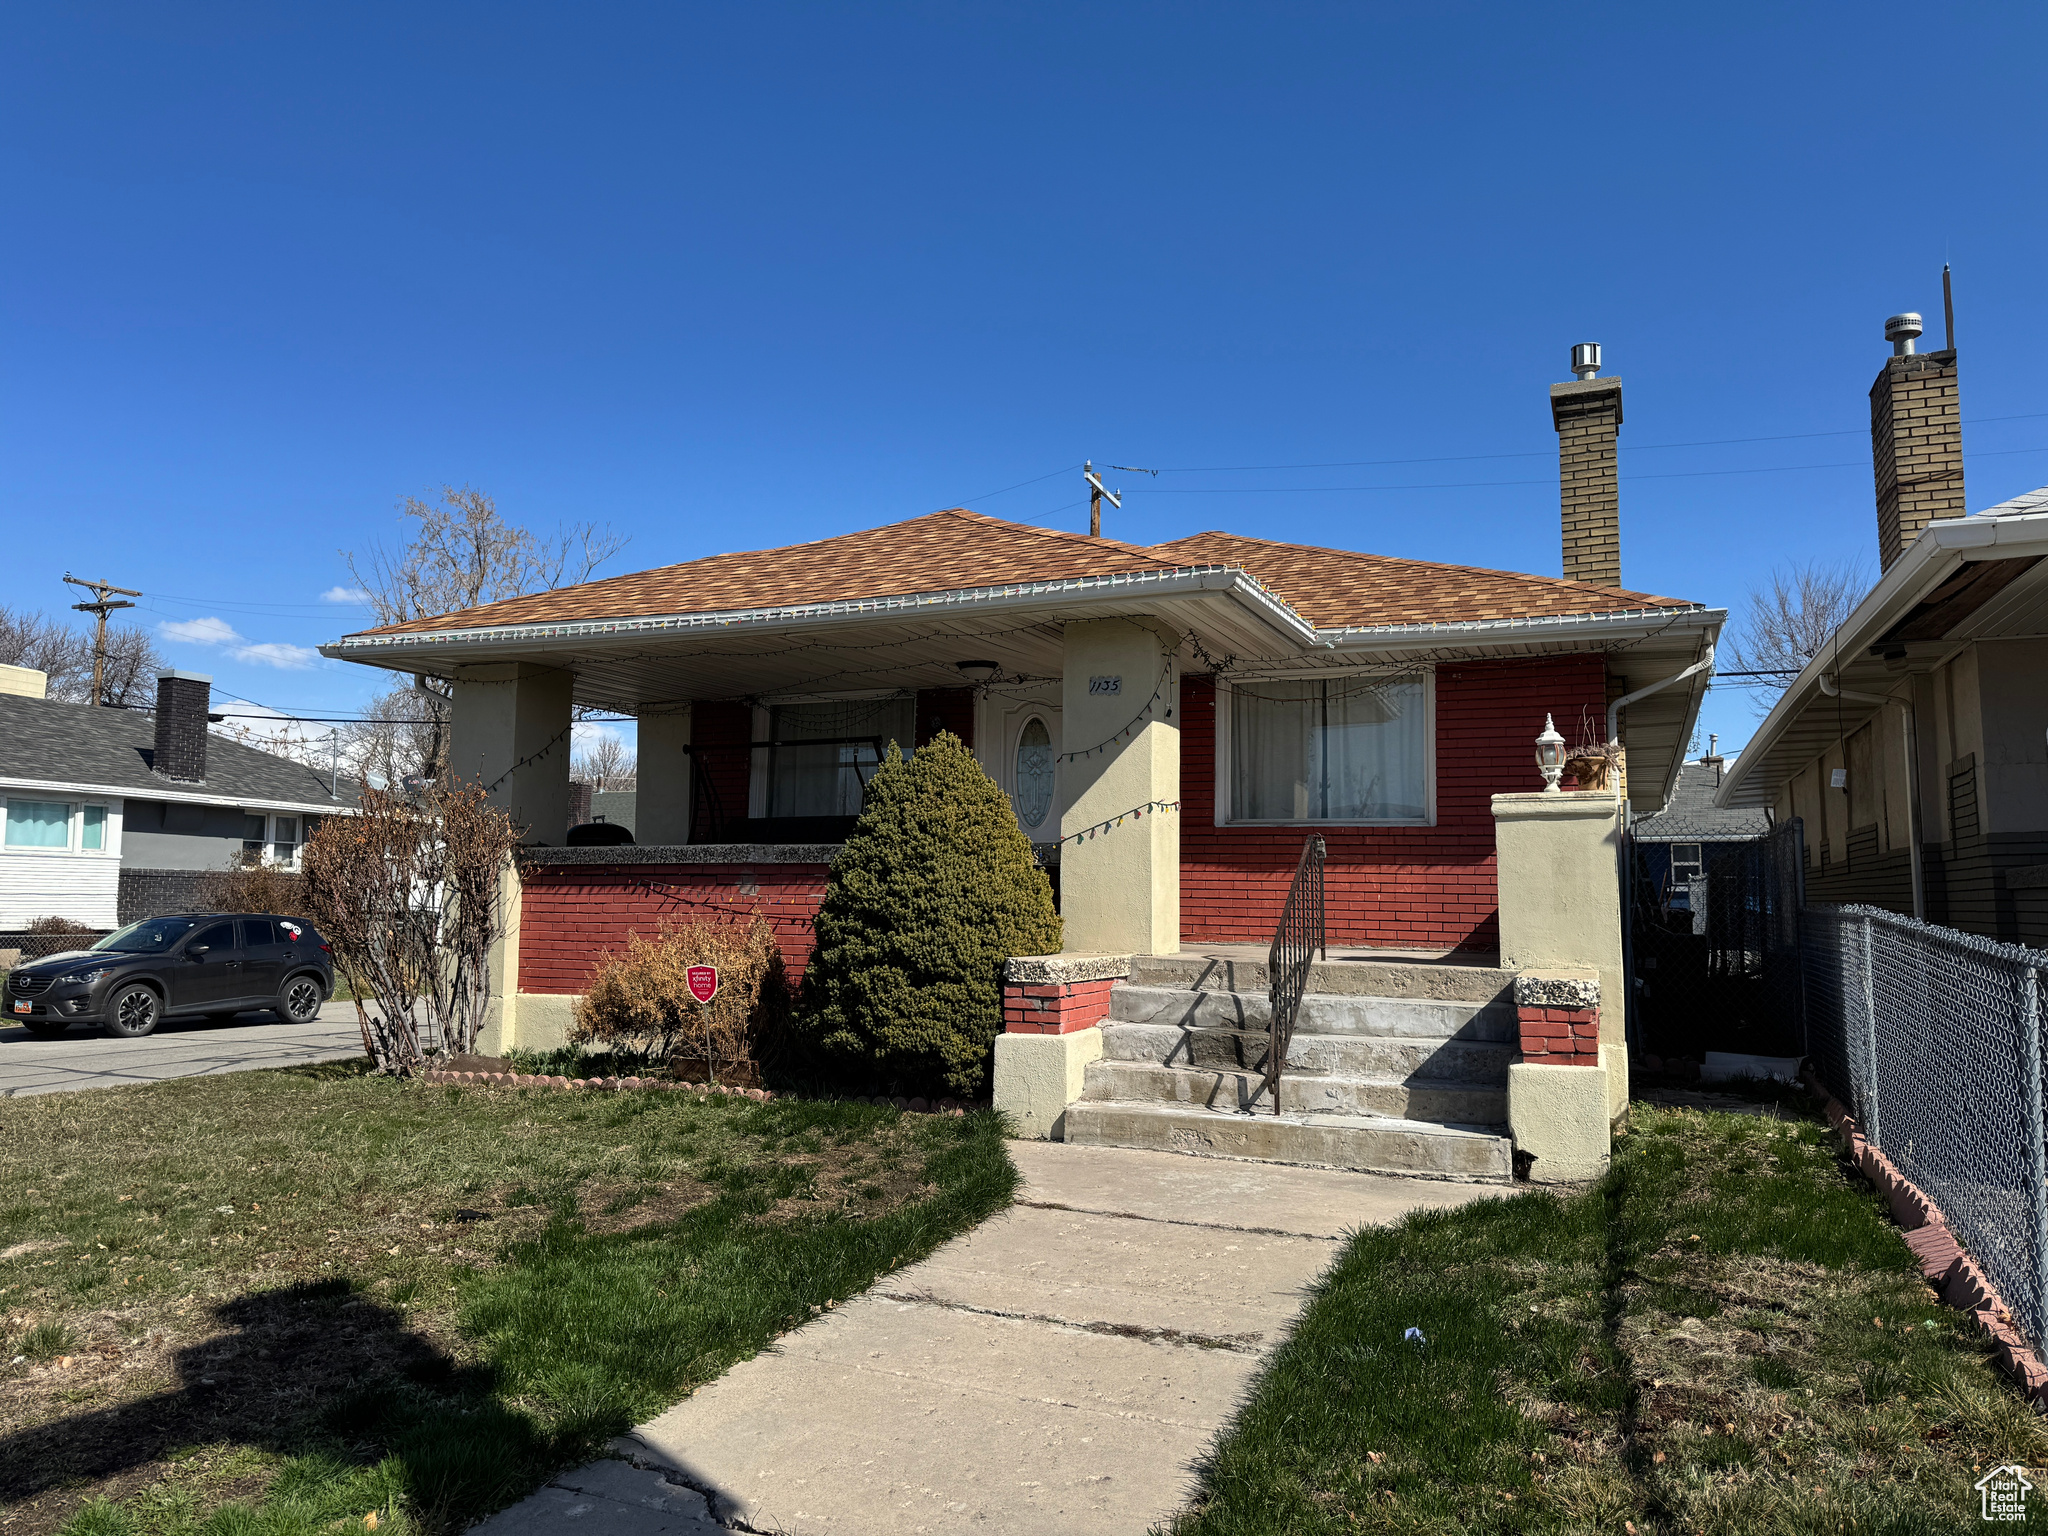
Active
$600,000
4
bds
|
2
ba
|
1,435
sqft
|
built
1922
1135 S State St, Salt Lake City, UT 84111
$-1,564
Cash flow
-13.6%
Cash-on-Cash Return
3.2%
Cap rate
0.4%
Rent to Value Ratio
Active
$550,000
5
bds
|
2
ba
|
2,591
sqft
|
built
1982
4697 W Woodcutter Ln, Salt Lake City, UT 84120
$-1,544
Cash flow
-14.6%
Cash-on-Cash Return
2.9%
Cap rate
0.4%
Rent to Value Ratio

Active
$289,900
2
bds
|
1
ba
|
848
sqft
|
built
1970
435 E Creekside Cir, Salt Lake City, UT 84107
$-705
Cash flow
-12.7%
Cash-on-Cash Return
3.4%
Cap rate
0.6%
Rent to Value Ratio
Active
$4,399,000
3
bds
|
4
ba
|
2,842
sqft
|
built
2011
99 W South Temple, Salt Lake City, UT 84101
$-23,479
Cash flow
-27.8%
Cash-on-Cash Return
-0.1%
Cap rate
0.1%
Rent to Value Ratio
Active
$450,000
2
bds
|
2
ba
|
1,254
sqft
|
built
1928
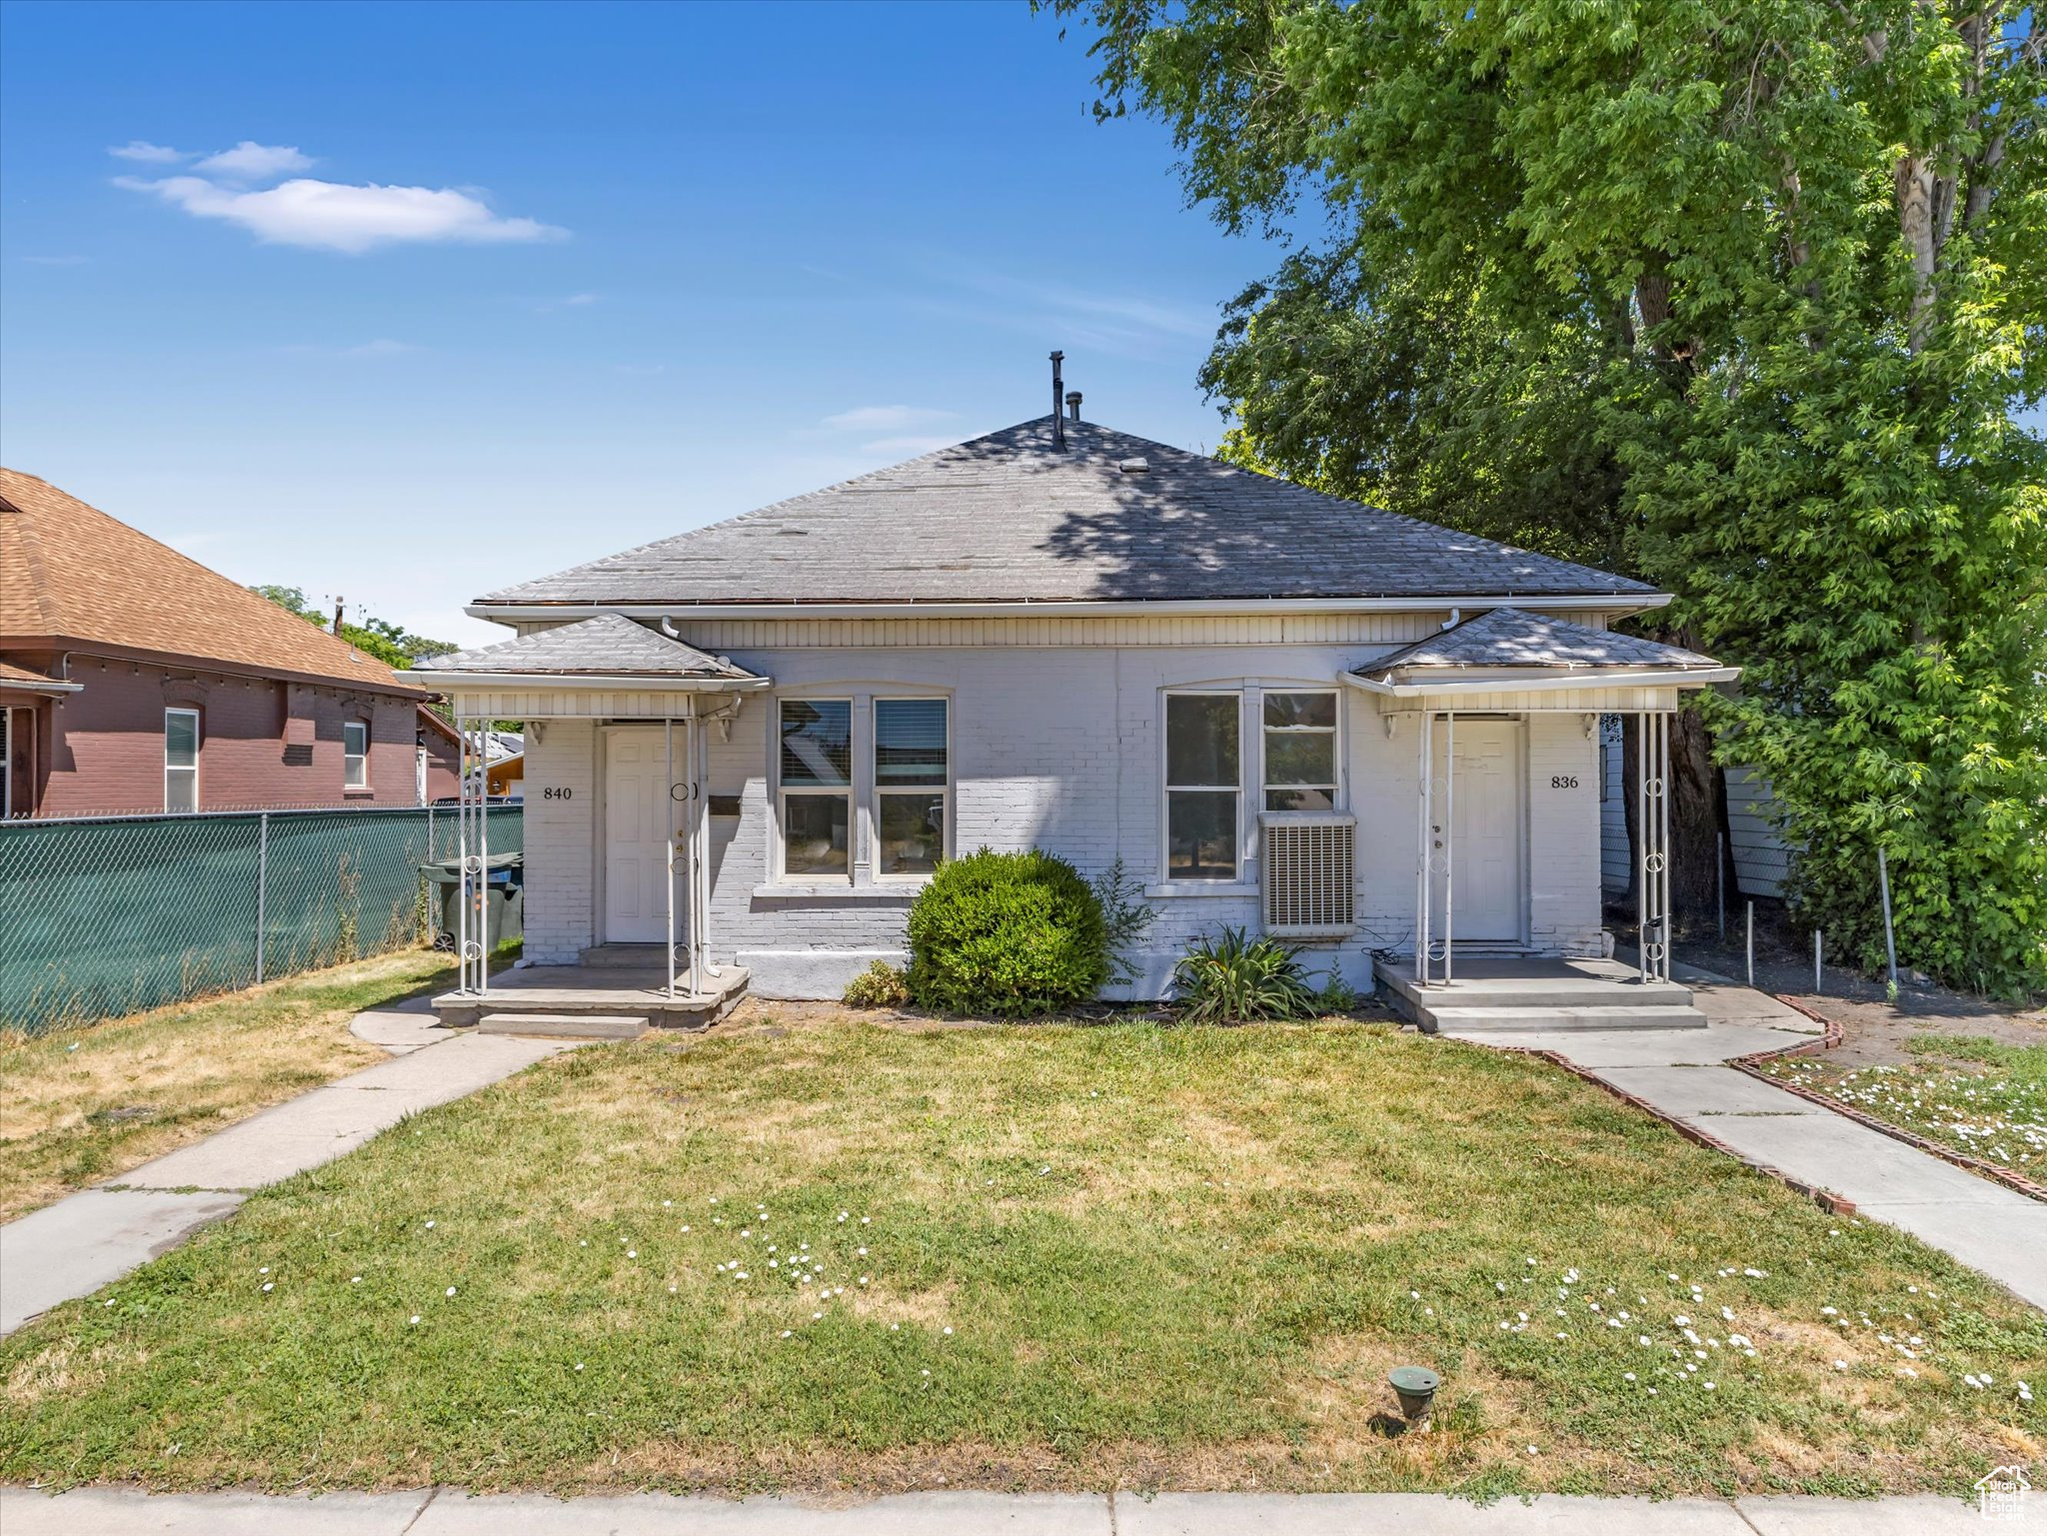
836 W 300 N, Salt Lake City, UT 84116
$-1,283
Cash flow
-14.9%
Cash-on-Cash Return
2.9%
Cap rate
0.4%
Rent to Value Ratio
Active
$759,000
2
bds
|
3
ba
|
2,195
sqft
|
built
1976
241 N Vine St, Salt Lake City, UT 84103
$-2,632
Cash flow
-18.1%
Cash-on-Cash Return
2.1%
Cap rate
0.5%
Rent to Value Ratio
Active
$650,000
4
bds
|
2
ba
|
1,642
sqft
|
built
1950
1138 E Hudson Ave, Salt Lake City, UT 84106
$-1,261
Cash flow
-10.1%
Cash-on-Cash Return
4.0%
Cap rate
0.5%
Rent to Value Ratio