San Antonio, TX Investment Properties for Sale
Browse homes for sale and investment properties in San Antonio, TX. Refine your search by price, property type, or more.
Best cash flowing properties in San Antonio, TX
Active
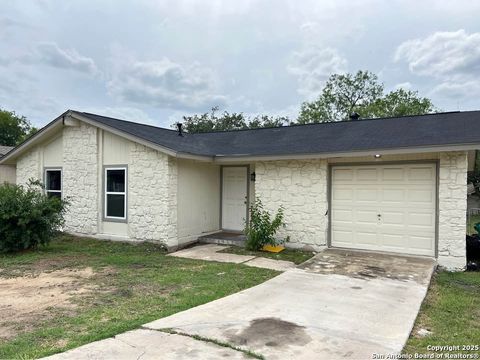
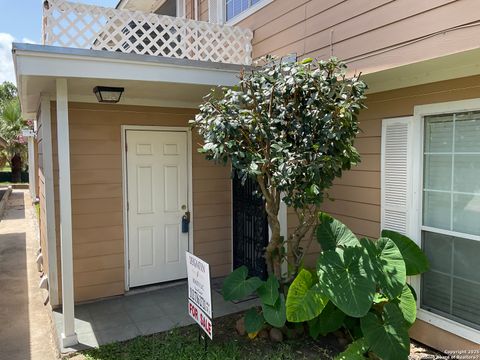
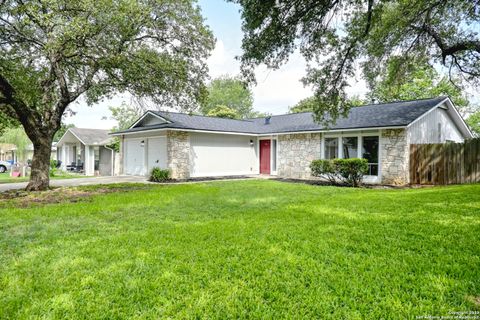
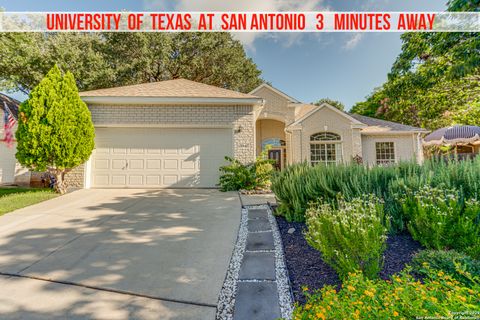
$199,900
4
bds
|
2
ba
|
1,049
sqft
|
built
1977
5111 Big Fawn St, San Antonio, TX 78242
$-266
Cash flow
-6.9%
Cash-on-Cash Return
4.7%
Cap rate
0.8%
Rent to Value Ratio
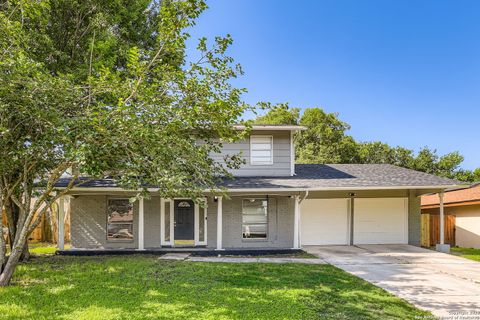
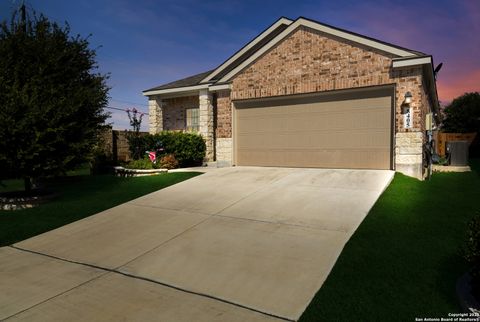
Active
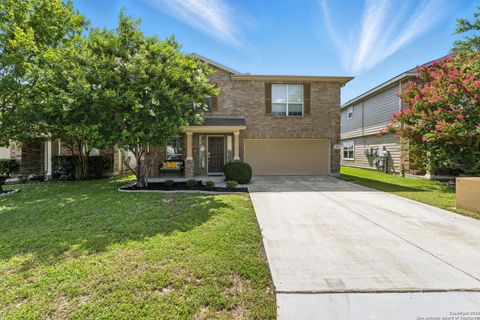
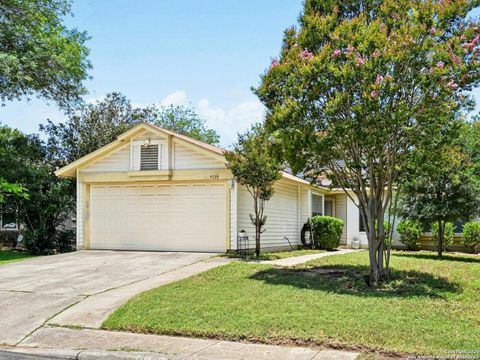
$245,000
4
bds
|
3
ba
|
1,842
sqft
|
built
1974
6718 Cypress Lake Dr, San Antonio, TX 78244
$-395
Cash flow
-8.4%
Cash-on-Cash Return
4.3%
Cap rate
0.7%
Rent to Value Ratio
6,116 out of 6,413 properties for sale in San Antonio, TX
Limited Results Shown
Create a free account, or log in to reveal all property listings and enjoy the complete experience.
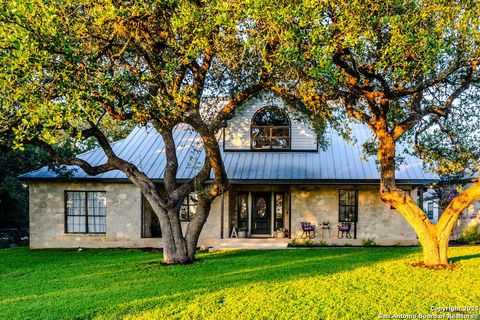
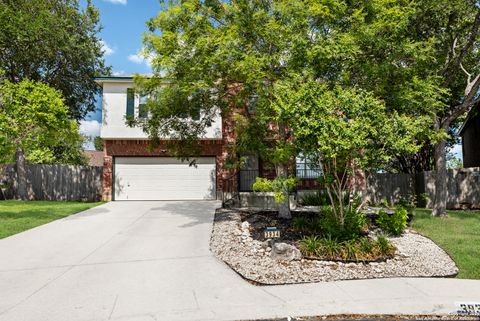
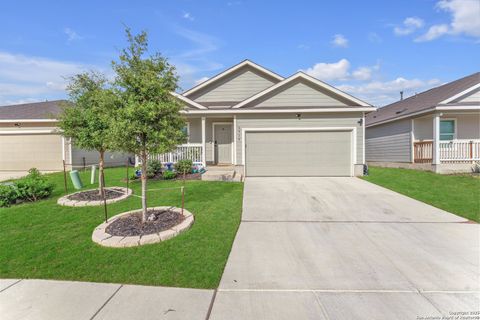
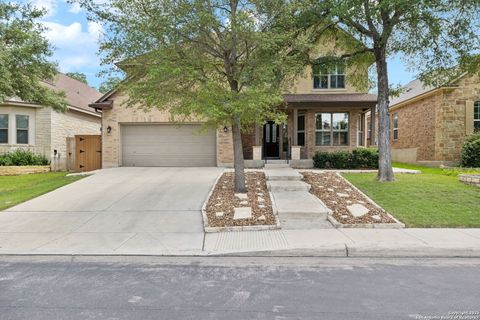
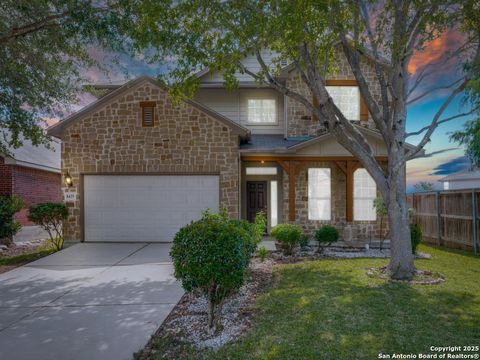
Active
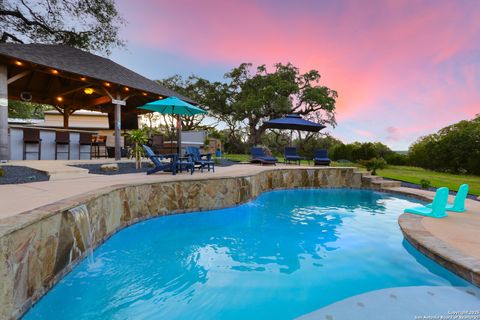
$695,000
3
bds
|
3
ba
|
2,831
sqft
|
built
1986
1007 Misty Water Ln, San Antonio, TX 78260
$-2,519
Cash flow
-18.9%
Cash-on-Cash Return
1.9%
Cap rate
0.4%
Rent to Value Ratio
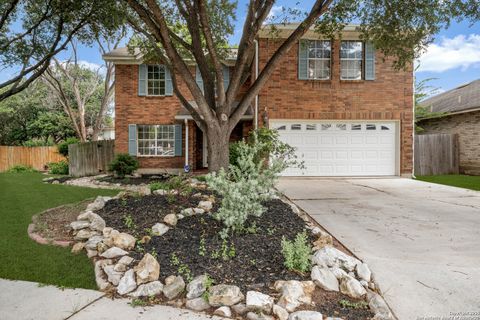
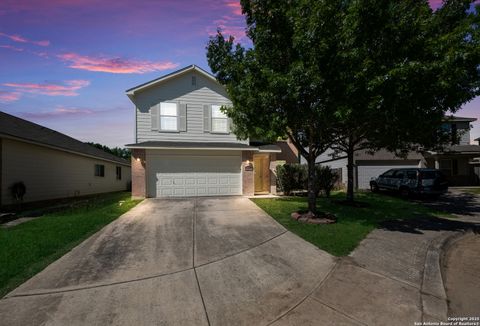
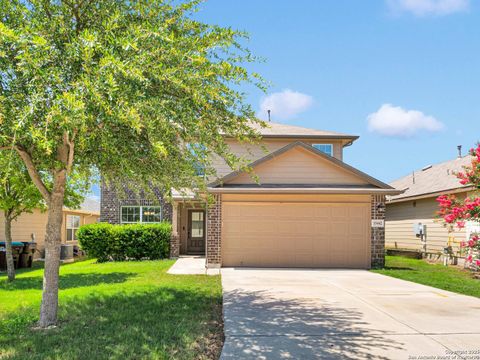
Active
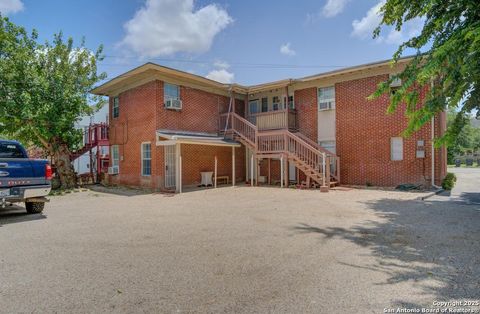
$310,000
3
bds
|
3
ba
|
1,975
sqft
|
built
1994
4707 Aspen Vw, San Antonio, TX 78217
$-743
Cash flow
-12.5%
Cash-on-Cash Return
3.4%
Cap rate
0.6%
Rent to Value Ratio
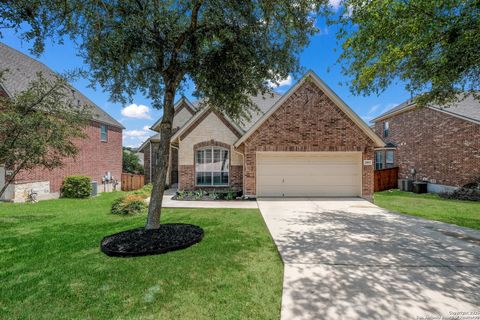
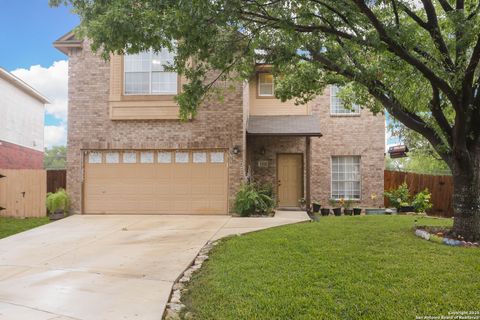
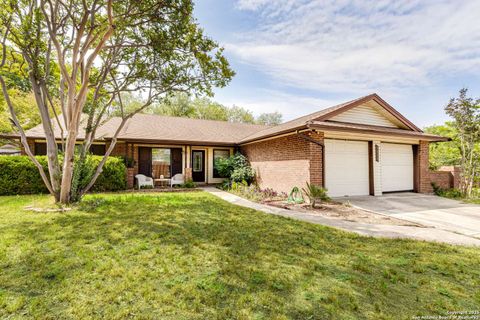
Active
$375,000
4
bds
|
3
ba
|
2,637
sqft
|
built
1999
3934 Knollhaven, San Antonio, TX 78247
$-1,080
Cash flow
-15.0%
Cash-on-Cash Return
2.8%
Cap rate
0.6%
Rent to Value Ratio
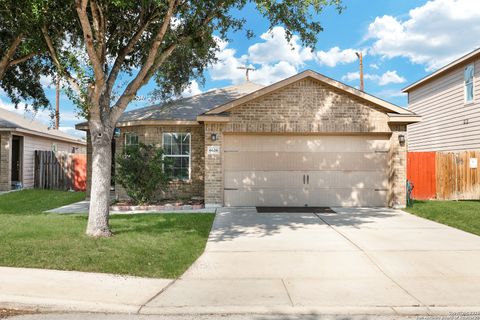
Active
$459,900
3
bds
|
0
ba
|
2,324
sqft
|
built
2007
24046 Waterhole Ln, San Antonio, TX 78261
$-1,642
Cash flow
-18.6%
Cash-on-Cash Return
2.0%
Cap rate
0.6%
Rent to Value Ratio
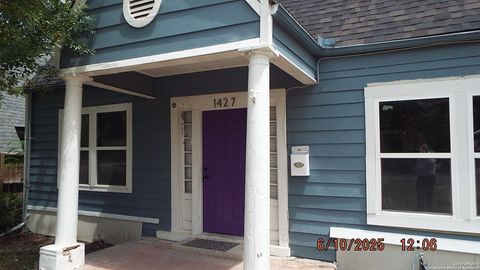
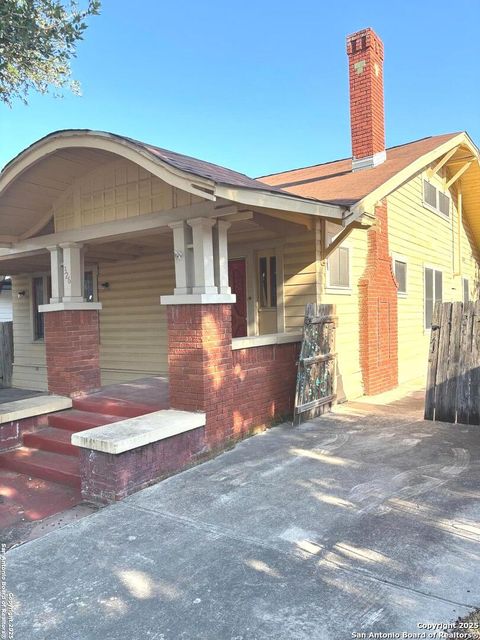
Active
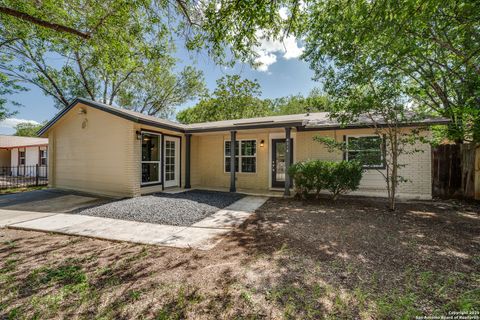
$275,000
3
bds
|
2
ba
|
1,357
sqft
|
built
1930
1427 Schley Ave, San Antonio, TX 78210
$-684
Cash flow
-13.0%
Cash-on-Cash Return
3.3%
Cap rate
0.6%
Rent to Value Ratio
Active
$245,000
4
bds
|
3
ba
|
1,842
sqft
|
built
1974
6718 Cypress Lake Dr, San Antonio, TX 78244
$-395
Cash flow
-8.4%
Cash-on-Cash Return
4.3%
Cap rate
0.7%
Rent to Value Ratio
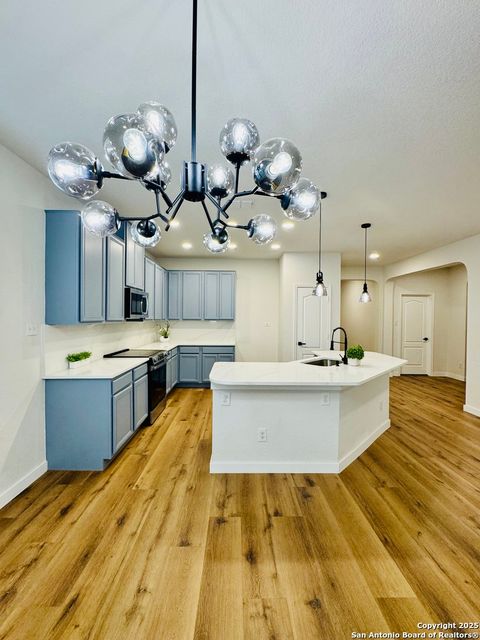
Active
$329,000
3
bds
|
3
ba
|
2,006
sqft
|
built
2010
13231 Frogs Leap, San Antonio, TX 78253
$-899
Cash flow
-14.3%
Cash-on-Cash Return
3.0%
Cap rate
0.6%
Rent to Value Ratio
Active
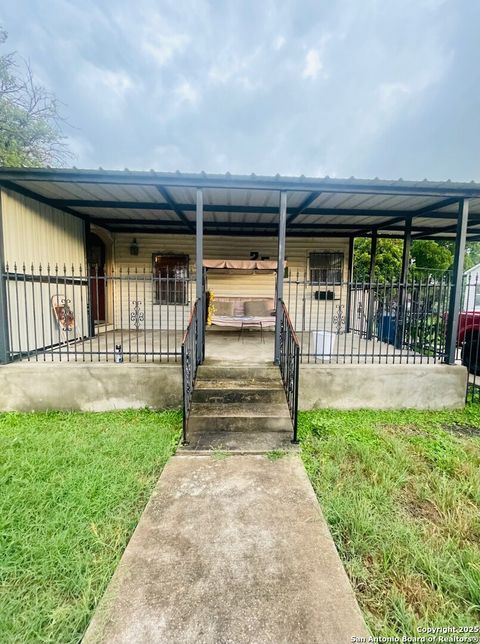
$239,750
3
bds
|
3
ba
|
1,338
sqft
|
built
1972
7322 Oak Manor Dr, San Antonio, TX 78229
$-1,102
Cash flow
-24.0%
Cash-on-Cash Return
0.8%
Cap rate
0.6%
Rent to Value Ratio
Active
$255,000
3
bds
|
2
ba
|
1,622
sqft
|
built
2019
8405 Lamus Wheel, San Antonio, TX 78254
$-570
Cash flow
-11.7%
Cash-on-Cash Return
3.6%
Cap rate
0.7%
Rent to Value Ratio
Active
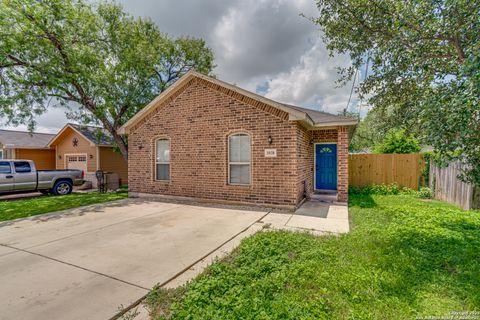
$199,900
4
bds
|
2
ba
|
1,049
sqft
|
built
1977
5111 Big Fawn St, San Antonio, TX 78242
$-266
Cash flow
-6.9%
Cash-on-Cash Return
4.7%
Cap rate
0.8%
Rent to Value Ratio
Active
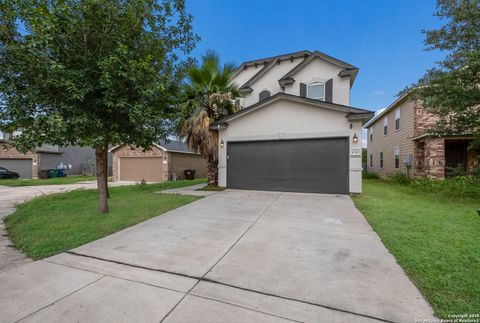
$255,000
4
bds
|
2
ba
|
1,577
sqft
|
built
2022
6919 Pail Pl, San Antonio, TX 78252
$-559
Cash flow
-11.4%
Cash-on-Cash Return
3.6%
Cap rate
0.7%
Rent to Value Ratio
Active
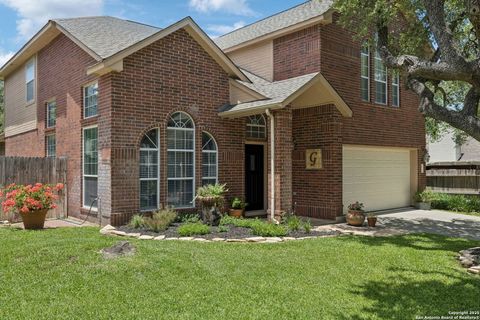
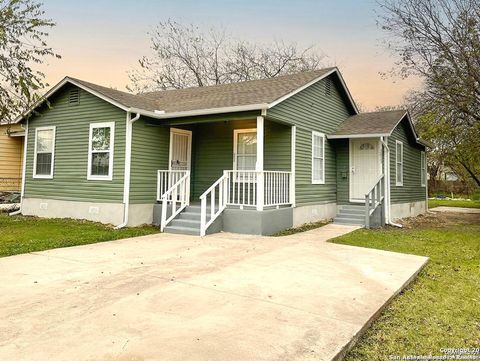
$274,900
3
bds
|
3
ba
|
2,196
sqft
|
built
2006
11922 Briarton Wls, San Antonio, TX 78254
$-561
Cash flow
-10.6%
Cash-on-Cash Return
3.8%
Cap rate
0.7%
Rent to Value Ratio
Active
$265,000
3
bds
|
3
ba
|
2,255
sqft
|
built
2009
811 Cormorant, San Antonio, TX 78245
$-679
Cash flow
-13.4%
Cash-on-Cash Return
3.2%
Cap rate
0.7%
Rent to Value Ratio
Active
$263,000
4
bds
|
2
ba
|
1,400
sqft
|
built
1979
8218 Meadow Swan St, San Antonio, TX 78251
$-843
Cash flow
-16.7%
Cash-on-Cash Return
2.4%
Cap rate
0.5%
Rent to Value Ratio
Active
$250,000
3
bds
|
1
ba
|
1,757
sqft
|
built
1945
2510 W Mulberry Ave, San Antonio, TX 78228
$-720
Cash flow
-15.0%
Cash-on-Cash Return
2.8%
Cap rate
0.6%
Rent to Value Ratio
Active
$410,000
3
bds
|
3
ba
|
2,452
sqft
|
built
1994
2723 Sierra Salinas, San Antonio, TX 78259
$-1,110
Cash flow
-14.1%
Cash-on-Cash Return
3.0%
Cap rate
0.6%
Rent to Value Ratio
Active
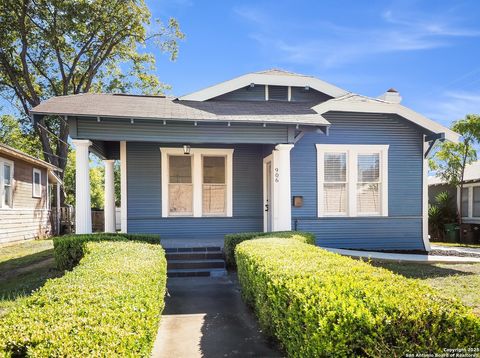
$299,999
3
bds
|
2
ba
|
1,235
sqft
|
built
1920
906 E Grayson St, San Antonio, TX 78208
$-772
Cash flow
-13.4%
Cash-on-Cash Return
3.2%
Cap rate
0.7%
Rent to Value Ratio
Active
$250,000
4
bds
|
3
ba
|
2,399
sqft
|
built
1994
823 S Ellison Dr, San Antonio, TX 78245
$-433
Cash flow
-9.0%
Cash-on-Cash Return
4.2%
Cap rate
0.8%
Rent to Value Ratio
Active
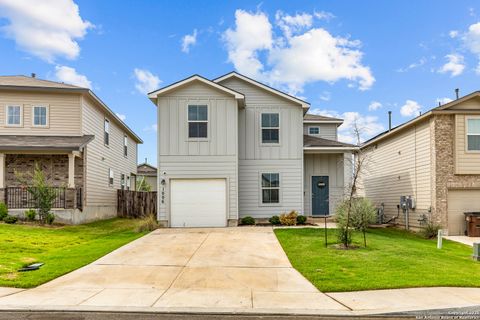
$300,000
4
bds
|
3
ba
|
1,900
sqft
|
built
2022
1006 Pacific Monarch, San Antonio, TX 78253
$-698
Cash flow
-12.1%
Cash-on-Cash Return
3.5%
Cap rate
0.6%
Rent to Value Ratio
Active
$264,000
3
bds
|
2
ba
|
1,636
sqft
|
built
1966
6010 Hillman Dr, San Antonio, TX 78218
$-607
Cash flow
-12.0%
Cash-on-Cash Return
3.5%
Cap rate
0.6%
Rent to Value Ratio
Active
$290,000
3
bds
|
2
ba
|
1,343
sqft
|
built
1978
12415 Cannonade St, San Antonio, TX 78233
$-969
Cash flow
-17.4%
Cash-on-Cash Return
2.3%
Cap rate
0.5%
Rent to Value Ratio
Active
$263,000
3
bds
|
2
ba
|
1,396
sqft
|
built
2013
1038 Marquette Dr, San Antonio, TX 78228
$-651
Cash flow
-12.9%
Cash-on-Cash Return
3.3%
Cap rate
0.7%
Rent to Value Ratio
Active
$275,000
3
bds
|
3
ba
|
1,810
sqft
|
built
2016
4543 Olympus Bay, San Antonio, TX 78245
$-645
Cash flow
-12.2%
Cash-on-Cash Return
3.5%
Cap rate
0.7%
Rent to Value Ratio
Active
$223,000
4
bds
|
1
ba
|
1,380
sqft
|
built
1948
2025 Texas Ave, San Antonio, TX 78228
$-700
Cash flow
-16.4%
Cash-on-Cash Return
2.5%
Cap rate
0.5%
Rent to Value Ratio
Active
$350,000
3
bds
|
3
ba
|
2,400
sqft
|
built
2007
3535 Arroyo Grande, San Antonio, TX 78253
$-1,066
Cash flow
-15.9%
Cash-on-Cash Return
2.6%
Cap rate
0.6%
Rent to Value Ratio
Active
$450,000
4
bds
|
3
ba
|
2,300
sqft
|
built
1998
12202 Towering Elm, San Antonio, TX 78247
$-1,408
Cash flow
-16.3%
Cash-on-Cash Return
2.5%
Cap rate
0.6%
Rent to Value Ratio
Active
$264,999
3
bds
|
3
ba
|
1,536
sqft
|
built
1995
13111 Burgundy Pt, San Antonio, TX 78217
$-589
Cash flow
-11.6%
Cash-on-Cash Return
3.6%
Cap rate
0.7%
Rent to Value Ratio
Active
$360,000
4
bds
|
2
ba
|
1,925
sqft
|
built
1925
326 E Craig Pl, San Antonio, TX 78212
$-1,284
Cash flow
-18.6%
Cash-on-Cash Return
2.0%
Cap rate
0.6%
Rent to Value Ratio
Active
$325,000
3
bds
|
3
ba
|
1,747
sqft
|
built
1996
4239 Knollpass, San Antonio, TX 78247
$-54,613
Cash flow
-876.7%
Cash-on-Cash Return
-195.4%
Cap rate
0.7%
Rent to Value Ratio
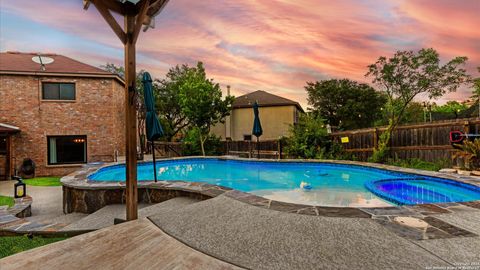
Active
$539,000
5
bds
|
3
ba
|
2,972
sqft
|
built
2016
25618 Nabby Cove Rd, San Antonio, TX 78255
$-1,600
Cash flow
-15.5%
Cash-on-Cash Return
2.7%
Cap rate
0.6%
Rent to Value Ratio
Active
$225,000
3
bds
|
2
ba
|
916
sqft
|
built
1935
615 Delmar St, San Antonio, TX 78210
$-731
Cash flow
-17.0%
Cash-on-Cash Return
2.4%
Cap rate
0.6%
Rent to Value Ratio
Active
$275,000
4
bds
|
2
ba
|
1,703
sqft
|
built
2018
13027 Maestro Spark, San Antonio, TX 78252
$-716
Cash flow
-13.6%
Cash-on-Cash Return
3.1%
Cap rate
0.7%
Rent to Value Ratio
Active
$445,000
4
bds
|
2
ba
|
2,150
sqft
|
built
1997
13947 Amber Crst, San Antonio, TX 78249
$-1,612
Cash flow
-18.9%
Cash-on-Cash Return
1.9%
Cap rate
0.5%
Rent to Value Ratio
Active
$235,000
3
bds
|
2
ba
|
1,443
sqft
|
built
1986
9139 Tree Vlg, San Antonio, TX 78250
$-600
Cash flow
-13.3%
Cash-on-Cash Return
3.2%
Cap rate
0.7%
Rent to Value Ratio
Active
$969,000
4
bds
|
4
ba
|
3,110
sqft
|
built
1999
27951 Wild Bloom, San Antonio, TX 78260
$-3,931
Cash flow
-21.2%
Cash-on-Cash Return
1.4%
Cap rate
0.4%
Rent to Value Ratio
Active
$389,000
5
bds
|
0
ba
|
3,610
sqft
|
built
1940
1511 W Woodlawn Ave, San Antonio, TX 78201
$-2,239
Cash flow
-30.0%
Cash-on-Cash Return
-0.6%
Cap rate
0.2%
Rent to Value Ratio
Active
$354,900
4
bds
|
3
ba
|
2,743
sqft
|
built
2007
8435 Autry Bnd, San Antonio, TX 78254
$-759
Cash flow
-11.2%
Cash-on-Cash Return
3.7%
Cap rate
0.7%
Rent to Value Ratio
Active
$319,000
5
bds
|
4
ba
|
2,687
sqft
|
built
2018
15442 Cooks Petrel, San Antonio, TX 78253
$-684
Cash flow
-11.2%
Cash-on-Cash Return
3.7%
Cap rate
0.7%
Rent to Value Ratio
Active
$305,000
3
bds
|
2
ba
|
1,697
sqft
|
built
1977
5914 Oak Country Way, San Antonio, TX 78247
$-823
Cash flow
-14.1%
Cash-on-Cash Return
3.0%
Cap rate
0.6%
Rent to Value Ratio
Active
$277,915
3
bds
|
2
ba
|
1,793
sqft
|
built
2012
6626 Luckey Tree, San Antonio, TX 78252
$-701
Cash flow
-13.2%
Cash-on-Cash Return
3.2%
Cap rate
0.6%
Rent to Value Ratio