San Antonio, TX Investment Properties for Sale
Browse homes for sale and investment properties in San Antonio, TX. Refine your search by price, property type, or more.
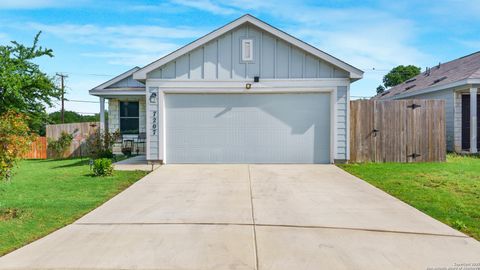
Best cash flowing properties in San Antonio, TX
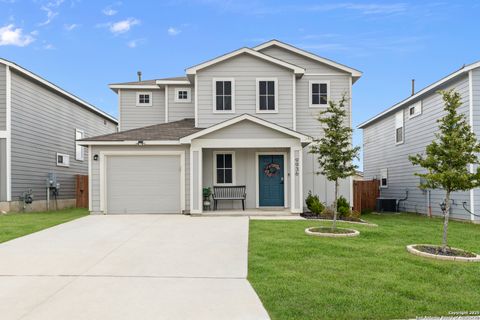
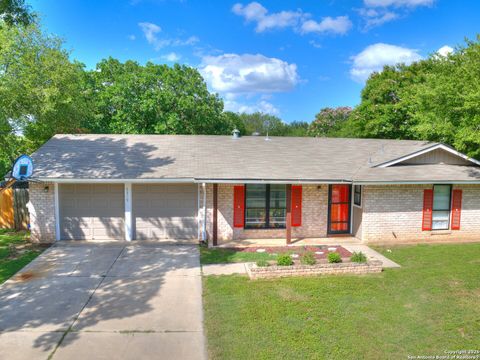
Active
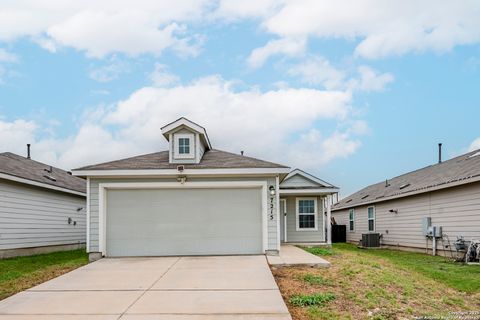
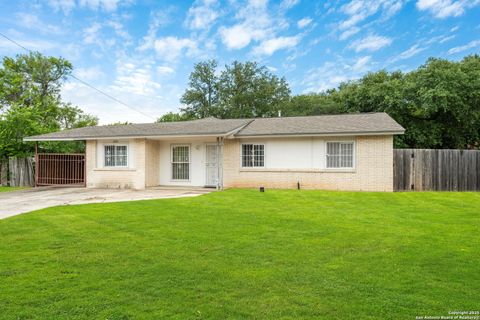
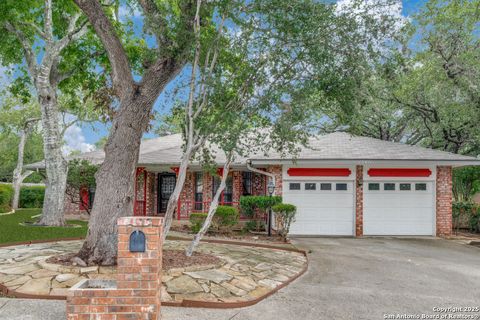
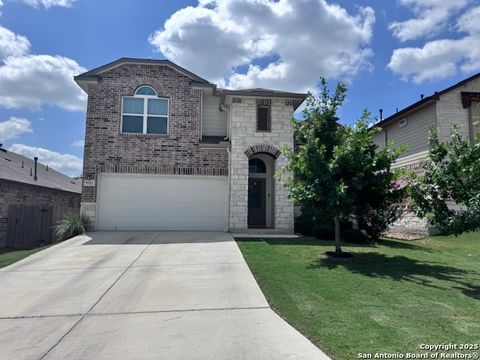
$229,900
3
bds
|
2
ba
|
1,450
sqft
|
built
2019
7215 Winding Cloud, San Antonio, TX 78244
$16
Cash flow
0.4%
Cash-on-Cash Return
6.3%
Cap rate
0.8%
Rent to Value Ratio
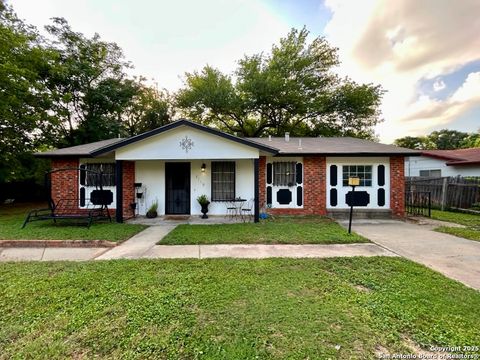
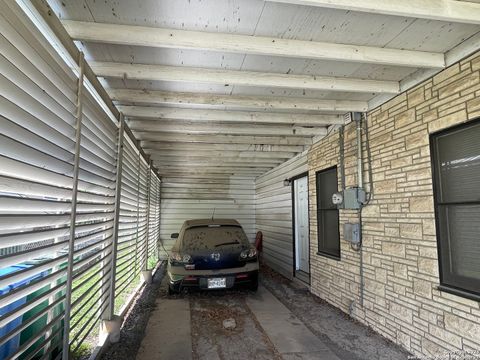
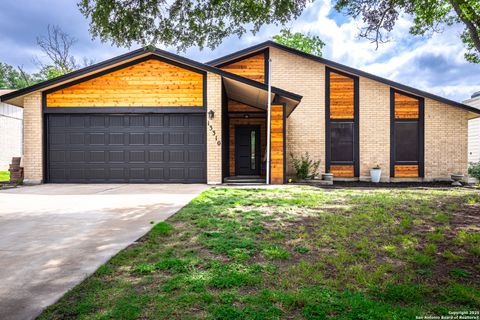
Active
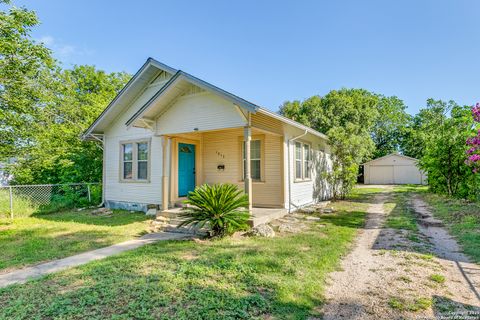
$149,900
3
bds
|
2
ba
|
918
sqft
|
built
1970
2119 Chesterhill Dr, San Antonio, TX 78228
$-82
Cash flow
-2.9%
Cash-on-Cash Return
5.0%
Cap rate
0.9%
Rent to Value Ratio
5,374 out of 5,638 properties for sale in San Antonio, TX
Limited Results Shown
Create a free account, or log in to reveal all property listings and enjoy the complete experience.
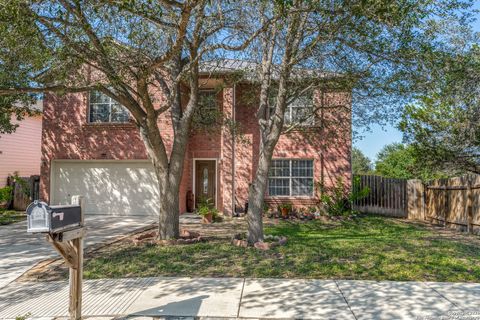
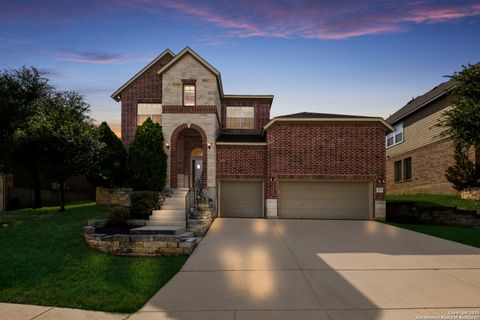
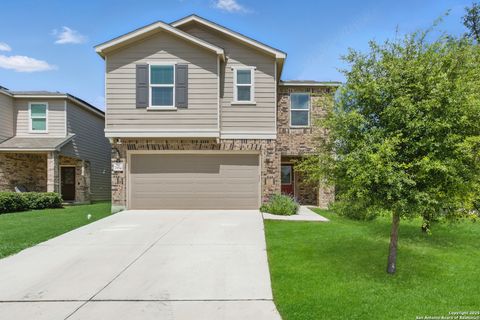
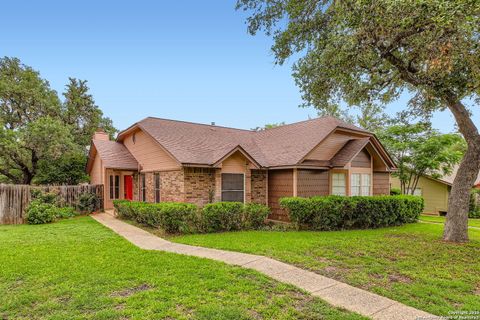
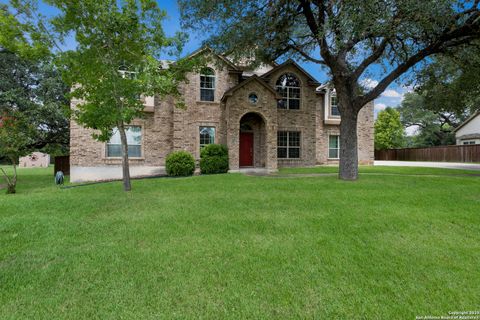
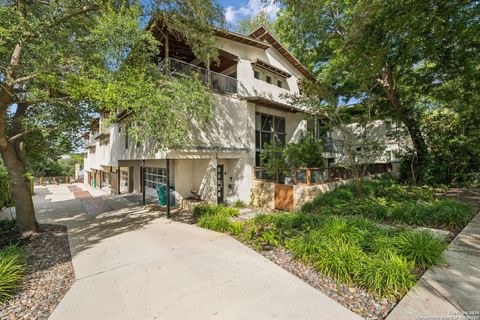
Active
$345,000
4
bds
|
3
ba
|
3,194
sqft
|
built
2005
17002 Cortland Rdg, San Antonio, TX 78247
$-828
Cash flow
-12.5%
Cash-on-Cash Return
3.4%
Cap rate
0.6%
Rent to Value Ratio
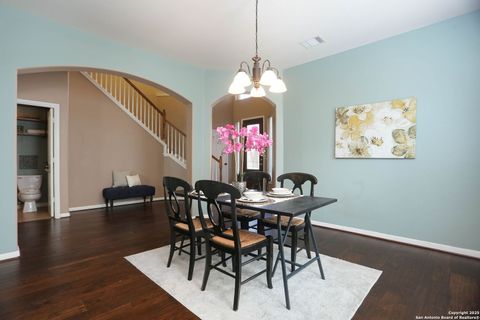
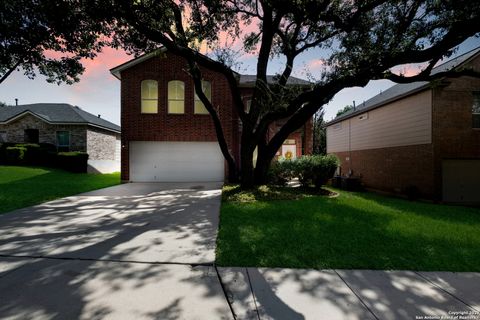
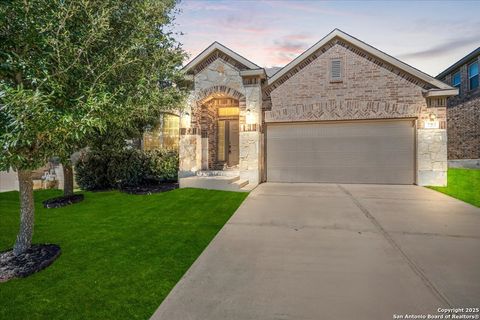
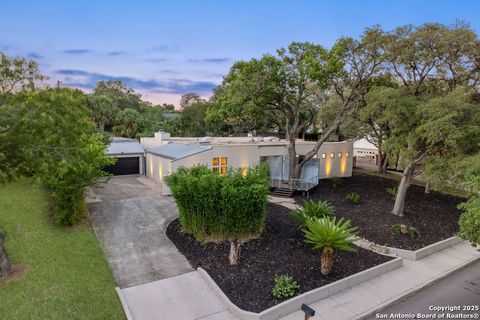
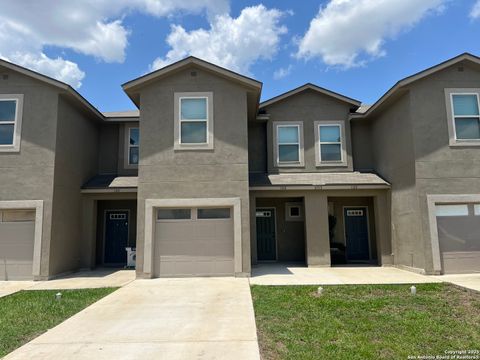
Active
$449,500
4
bds
|
3
ba
|
3,085
sqft
|
built
2001
9510 Loyal Vly, San Antonio, TX 78251
$-1,514
Cash flow
-17.6%
Cash-on-Cash Return
2.2%
Cap rate
0.6%
Rent to Value Ratio
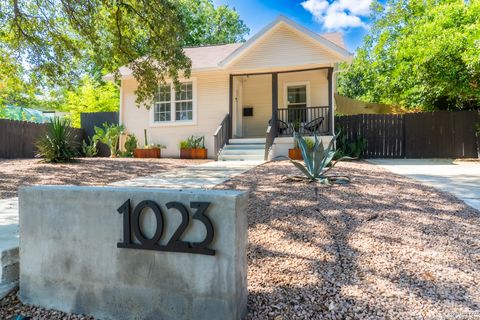
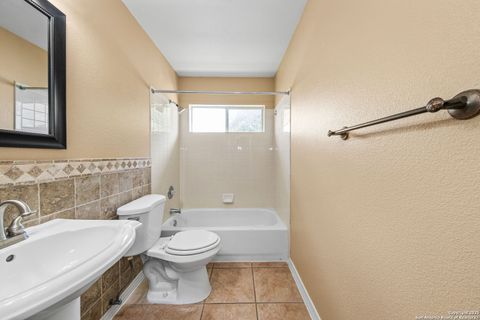
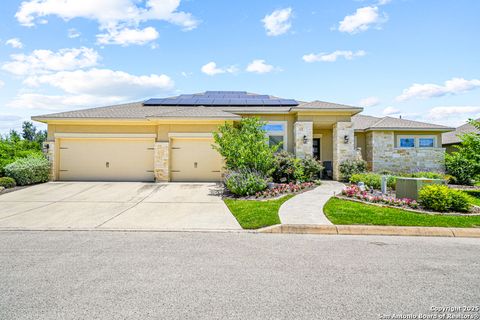
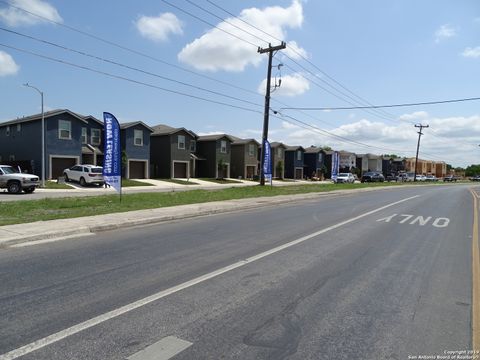
Active
$335,000
2
bds
|
2
ba
|
1,234
sqft
|
built
1940
1023 W Rosewood Ave, San Antonio, TX 78201
$-973
Cash flow
-15.2%
Cash-on-Cash Return
2.8%
Cap rate
0.6%
Rent to Value Ratio
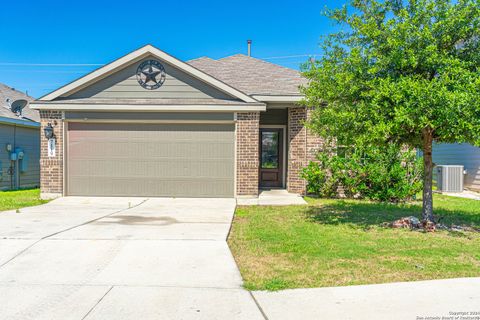
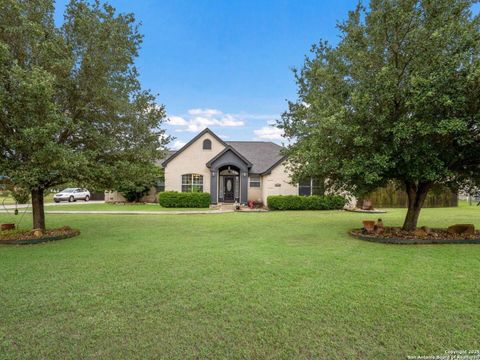
Active
$350,000
3
bds
|
3
ba
|
2,018
sqft
|
built
1999
22607 Madison Park, San Antonio, TX 78260
$-873
Cash flow
-13.0%
Cash-on-Cash Return
2.7%
Cap rate
0.6%
Rent to Value Ratio
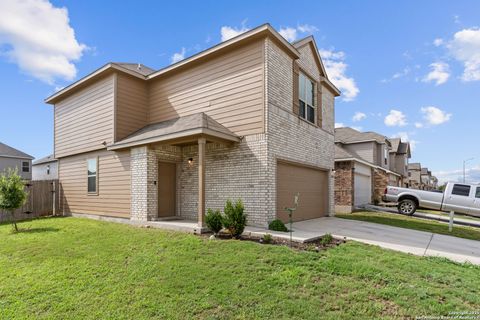
Active
$280,000
3
bds
|
2
ba
|
2,284
sqft
|
built
2018
7119 Magnolia Blf, San Antonio, TX 78218
$-458
Cash flow
-8.5%
Cash-on-Cash Return
4.3%
Cap rate
0.8%
Rent to Value Ratio
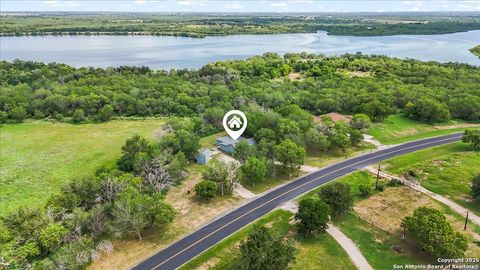
Active
$220,000
3
bds
|
3
ba
|
1,312
sqft
|
built
2021
10502 Green Rock Dr, San Antonio, TX 78223
$-379
Cash flow
-9.0%
Cash-on-Cash Return
4.2%
Cap rate
0.7%
Rent to Value Ratio
Active
$215,000
5
bds
|
3
ba
|
1,782
sqft
|
built
1971
6719 Lucerne, San Antonio, TX 78218
$-405
Cash flow
-9.8%
Cash-on-Cash Return
4.0%
Cap rate
0.7%
Rent to Value Ratio
Active
$187,000
3
bds
|
2
ba
|
1,260
sqft
|
built
1954
203 Galway Dr, San Antonio, TX 78223
$-288
Cash flow
-8.0%
Cash-on-Cash Return
4.4%
Cap rate
0.9%
Rent to Value Ratio
Active
$600,000
5
bds
|
4
ba
|
4,106
sqft
|
built
2011
3131 Howling Wolf, San Antonio, TX 78261
$-1,997
Cash flow
-17.4%
Cash-on-Cash Return
2.3%
Cap rate
0.5%
Rent to Value Ratio
Active
$325,000
3
bds
|
3
ba
|
2,175
sqft
|
built
2000
6523 Pecan Acres, San Antonio, TX 78240
$-930
Cash flow
-14.9%
Cash-on-Cash Return
2.8%
Cap rate
0.6%
Rent to Value Ratio
Active
$273,000
3
bds
|
3
ba
|
1,617
sqft
|
built
2021
9936 Western Sedge, San Antonio, TX 78254
$-526
Cash flow
-10.1%
Cash-on-Cash Return
3.4%
Cap rate
0.7%
Rent to Value Ratio
Active
$320,000
3
bds
|
3
ba
|
2,098
sqft
|
built
2019
7954 Hanging Br, San Antonio, TX 78253
$-639
Cash flow
-10.4%
Cash-on-Cash Return
3.3%
Cap rate
0.6%
Rent to Value Ratio
Active
$328,000
3
bds
|
2
ba
|
2,057
sqft
|
built
2016
723 Hard Tack Trl, San Antonio, TX 78245
$-737
Cash flow
-11.7%
Cash-on-Cash Return
3.5%
Cap rate
0.7%
Rent to Value Ratio
Active
$500,000
3
bds
|
2
ba
|
2,315
sqft
|
built
2016
4603 Camden Hts, San Antonio, TX 78261
$-1,857
Cash flow
-19.4%
Cash-on-Cash Return
1.2%
Cap rate
0.5%
Rent to Value Ratio
Active
$293,000
4
bds
|
2
ba
|
1,600
sqft
|
built
1974
6319 Stirrup Ln, San Antonio, TX 78240
$-802
Cash flow
-14.3%
Cash-on-Cash Return
3.0%
Cap rate
0.6%
Rent to Value Ratio
Active
$255,000
3
bds
|
2
ba
|
1,414
sqft
|
built
1982
13310 Larkbrook St, San Antonio, TX 78233
$-666
Cash flow
-13.6%
Cash-on-Cash Return
3.1%
Cap rate
0.5%
Rent to Value Ratio
Active
$215,000
2
bds
|
2
ba
|
1,090
sqft
|
built
1986
9547 Coolbrook, San Antonio, TX 78250
$-678
Cash flow
-16.5%
Cash-on-Cash Return
2.5%
Cap rate
0.7%
Rent to Value Ratio
Active
$595,000
3
bds
|
4
ba
|
4,953
sqft
|
built
2004
2703 Marlborough Dr, San Antonio, TX 78230
$-2,022
Cash flow
-17.7%
Cash-on-Cash Return
1.6%
Cap rate
0.6%
Rent to Value Ratio
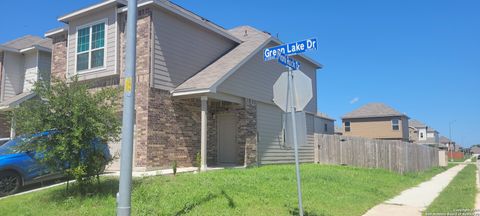
Active
$265,000
3
bds
|
3
ba
|
1,311
sqft
|
built
2021
10505 Green Lake Dr, San Antonio, TX 78223
$-675
Cash flow
-13.3%
Cash-on-Cash Return
3.2%
Cap rate
0.6%
Rent to Value Ratio
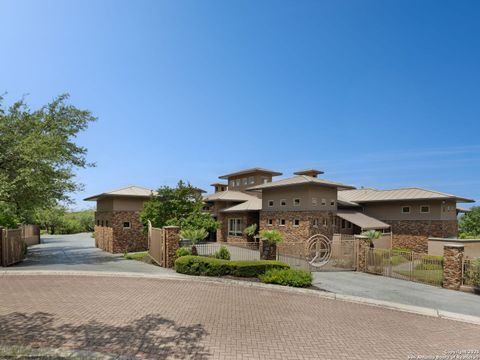
Active
$4,599,900
6
bds
|
8
ba
|
7,672
sqft
|
built
2008
11 Davenport Ln, San Antonio, TX 78257
$-24,888
Cash flow
-28.2%
Cash-on-Cash Return
-0.2%
Cap rate
0.1%
Rent to Value Ratio
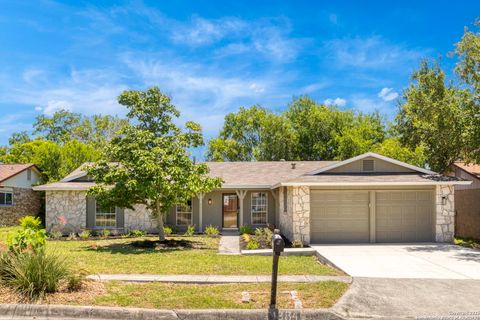
Active
$329,000
4
bds
|
2
ba
|
2,708
sqft
|
built
1980
13846 Crested Rise, San Antonio, TX 78217
$-790
Cash flow
-12.5%
Cash-on-Cash Return
3.4%
Cap rate
0.7%
Rent to Value Ratio
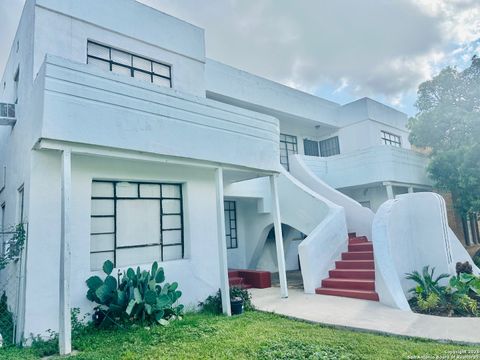
Active
$350,000
4
bds
|
0
ba
|
3,264
sqft
|
built
1950
1509 W Woodlawn Ave, San Antonio, TX 78201
$-1,441
Cash flow
-21.5%
Cash-on-Cash Return
1.3%
Cap rate
0.4%
Rent to Value Ratio
Active
$165,000
2
bds
|
1
ba
|
972
sqft
|
built
1930
1013 Sacramento, San Antonio, TX 78201
$-251
Cash flow
-7.9%
Cash-on-Cash Return
4.4%
Cap rate
0.8%
Rent to Value Ratio
Active
$283,000
3
bds
|
2
ba
|
2,107
sqft
|
built
1997
5711 Timberhurst, San Antonio, TX 78250
$-810
Cash flow
-14.9%
Cash-on-Cash Return
2.8%
Cap rate
0.6%
Rent to Value Ratio
Active
$600,000
3
bds
|
2
ba
|
1,948
sqft
|
built
1947
204 E Nottingham Dr, San Antonio, TX 78209
$-2,555
Cash flow
-22.2%
Cash-on-Cash Return
1.2%
Cap rate
0.5%
Rent to Value Ratio
Active
$175,000
3
bds
|
1
ba
|
1,593
sqft
|
built
1959
131 Hartford Ave, San Antonio, TX 78223
$-180
Cash flow
-5.4%
Cash-on-Cash Return
5.0%
Cap rate
1.0%
Rent to Value Ratio

Active
$510,000
5
bds
|
4
ba
|
3,406
sqft
|
built
2000
7722 Braun Bnd, San Antonio, TX 78250
$-1,401
Cash flow
-14.3%
Cash-on-Cash Return
3.0%
Cap rate
0.6%
Rent to Value Ratio
Active
$411,000
3
bds
|
2
ba
|
2,066
sqft
|
built
1978
15411 Circle Path St, San Antonio, TX 78232
$-1,455
Cash flow
-18.5%
Cash-on-Cash Return
2.0%
Cap rate
0.5%
Rent to Value Ratio
Active
$799,000
7
bds
|
4
ba
|
3,842
sqft
|
built
2010
28130 George Obrien, San Antonio, TX 78260
$-2,843
Cash flow
-18.6%
Cash-on-Cash Return
2.0%
Cap rate
0.5%
Rent to Value Ratio
Active
$785,000
12
bds
|
0
ba
|
5,448
sqft
|
built
2020
6515 Marcel Way, San Antonio, TX 78233
$-5,054
Cash flow
-33.6%
Cash-on-Cash Return
-1.5%
Cap rate
0.2%
Rent to Value Ratio
Active
$402,500
6
bds
|
0
ba
|
2,640
sqft
|
built
2019
6950 Lakeview Dr, San Antonio, TX 78244
$-3,122
Cash flow
-40.5%
Cash-on-Cash Return
-3.0%
Cap rate
0.4%
Rent to Value Ratio
Active
$1,195,000
4
bds
|
5
ba
|
3,126
sqft
|
built
2004
305 Joliet Ave, San Antonio, TX 78209
$-3,583
Cash flow
-15.6%
Cash-on-Cash Return
2.1%
Cap rate
0.5%
Rent to Value Ratio
Active
$505,000
3
bds
|
2
ba
|
2,201
sqft
|
built
2003
8612 Quail Rdg, San Antonio, TX 78263
$-1,837
Cash flow
-19.0%
Cash-on-Cash Return
1.9%
Cap rate
0.4%
Rent to Value Ratio

Active
$249,000
3
bds
|
2
ba
|
1,323
sqft
|
built
2013
12339 Craddick Cv, San Antonio, TX 78254
$-539
Cash flow
-11.3%
Cash-on-Cash Return
3.6%
Cap rate
0.7%
Rent to Value Ratio
Active
$335,000
3
bds
|
2
ba
|
1,838
sqft
|
built
1950
9665 Stuart Rd, San Antonio, TX 78263
$-637
Cash flow
-9.9%
Cash-on-Cash Return
4.0%
Cap rate
0.7%
Rent to Value Ratio
Active
$235,000
3
bds
|
2
ba
|
1,276
sqft
|
built
2021
7207 Rosada Way, San Antonio, TX 78218
$-417
Cash flow
-9.3%
Cash-on-Cash Return
4.1%
Cap rate
0.8%
Rent to Value Ratio
Active
$379,000
4
bds
|
3
ba
|
2,599
sqft
|
built
2021
9311 Bicknell Sedge, San Antonio, TX 78254
$-911
Cash flow
-12.5%
Cash-on-Cash Return
3.4%
Cap rate
0.7%
Rent to Value Ratio
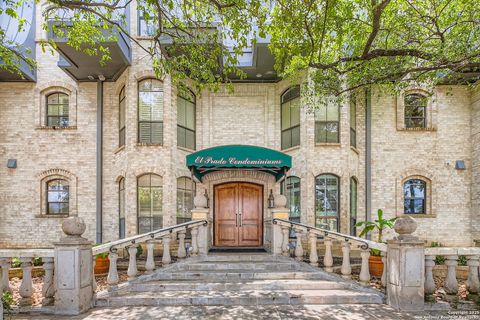
Active
$400,000
2
bds
|
2
ba
|
1,460
sqft
|
built
1984
100 W El Prado Dr, San Antonio, TX 78212
$-1,818
Cash flow
-23.7%
Cash-on-Cash Return
0.8%
Cap rate
0.5%
Rent to Value Ratio