San Antonio, TX Investment Properties for Sale
Browse homes for sale and investment properties in San Antonio, TX. Refine your search by price, property type, or more.
Best cash flowing properties in San Antonio, TX
Active
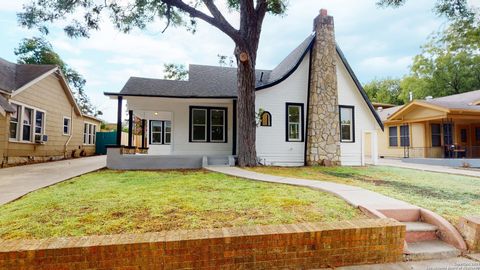
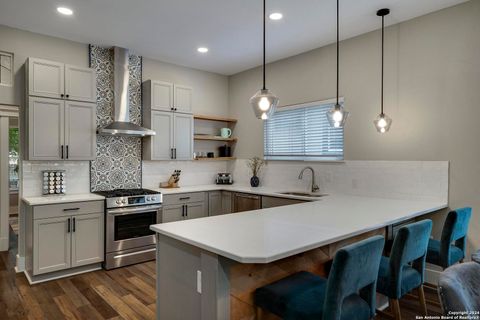
$204,900
3
bds
|
2
ba
|
1,354
sqft
|
built
2019
3111 Old Almonte Dr, San Antonio, TX 78224
$151
Cash flow
3.8%
Cash-on-Cash Return
7.2%
Cap rate
0.9%
Rent to Value Ratio

Active
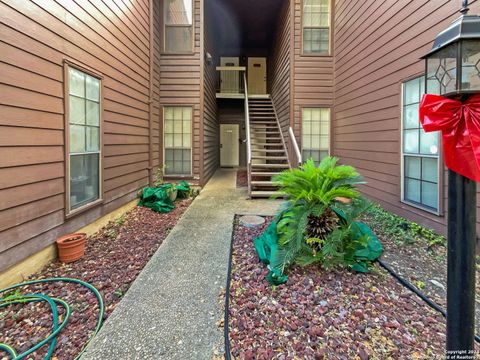
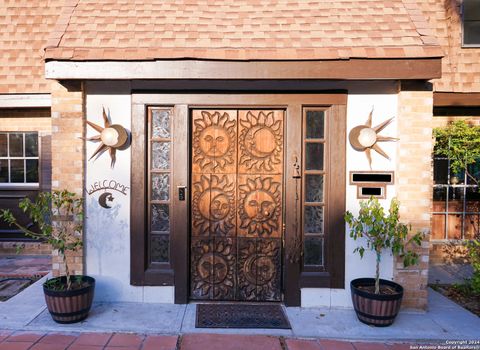
$175,000
3
bds
|
2
ba
|
1,176
sqft
|
built
1939
223 Astor St, San Antonio, TX 78210
$-37
Cash flow
-1.1%
Cash-on-Cash Return
6.0%
Cap rate
0.9%
Rent to Value Ratio
6,117 out of 6,413 properties for sale in San Antonio, TX
Limited Results Shown
Create a free account, or log in to reveal all property listings and enjoy the complete experience.
Active
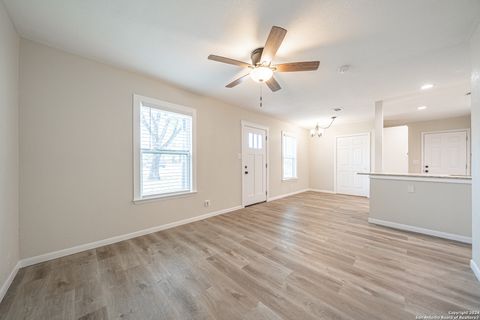
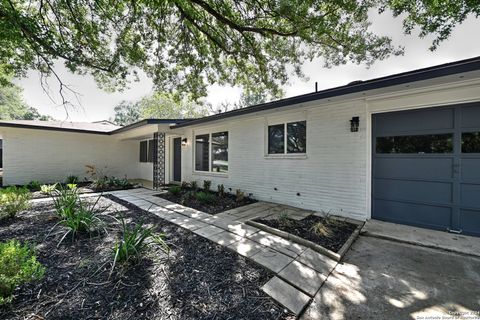
$475,000
3
bds
|
3
ba
|
1,925
sqft
|
built
2022
423 N Mesquite St, San Antonio, TX 78202
$-1,885
Cash flow
-20.7%
Cash-on-Cash Return
1.5%
Cap rate
0.5%
Rent to Value Ratio
Active
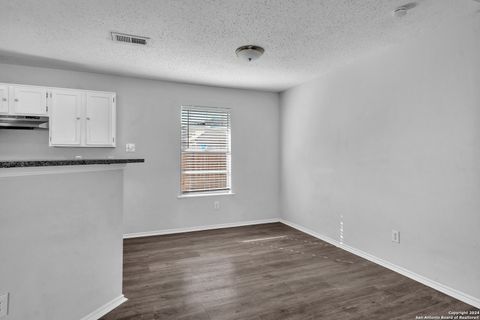
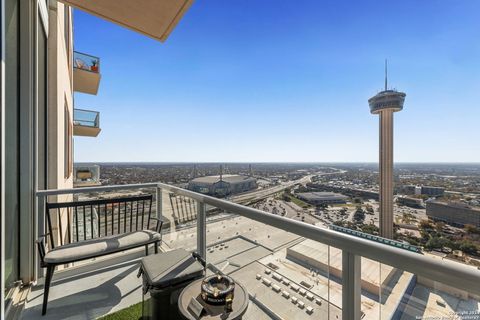
$169,900
3
bds
|
2
ba
|
996
sqft
|
built
1946
122 Goodrich, San Antonio, TX 78207
$-111
Cash flow
-3.4%
Cash-on-Cash Return
5.5%
Cap rate
0.9%
Rent to Value Ratio
Active
$2,395,000
4
bds
|
5
ba
|
4,887
sqft
|
built
1906
338 Madison, San Antonio, TX 78204
$-12,645
Cash flow
-27.5%
Cash-on-Cash Return
-0.1%
Cap rate
0.2%
Rent to Value Ratio
Active
$1,000,000
4
bds
|
4
ba
|
3,021
sqft
|
built
2023
7206 Bluff Run, San Antonio, TX 78257
$-3,038
Cash flow
-15.9%
Cash-on-Cash Return
2.6%
Cap rate
0.5%
Rent to Value Ratio
Active
$175,000
3
bds
|
2
ba
|
1,112
sqft
|
built
2005
2220 S Laredo St, San Antonio, TX 78207
$-275
Cash flow
-8.2%
Cash-on-Cash Return
4.4%
Cap rate
0.8%
Rent to Value Ratio
Active
$525,000
5
bds
|
4
ba
|
3,717
sqft
|
built
2018
12314 Bianca Mill Way, San Antonio, TX 78254
$-1,244
Cash flow
-12.4%
Cash-on-Cash Return
3.4%
Cap rate
0.7%
Rent to Value Ratio
Active
$279,000
3
bds
|
3
ba
|
1,883
sqft
|
built
2003
4106 Camfield, San Antonio, TX 78251
$-763
Cash flow
-14.3%
Cash-on-Cash Return
3.0%
Cap rate
0.6%
Rent to Value Ratio
Active
$550,000
4
bds
|
4
ba
|
3,417
sqft
|
built
2014
24727 Chianti Way, San Antonio, TX 78260
$-1,616
Cash flow
-15.3%
Cash-on-Cash Return
2.7%
Cap rate
0.6%
Rent to Value Ratio

Active
$629,000
4
bds
|
3
ba
|
3,022
sqft
|
built
2018
2031 Buckner Pass, San Antonio, TX 78253
$-2,266
Cash flow
-18.8%
Cash-on-Cash Return
1.9%
Cap rate
0.5%
Rent to Value Ratio
Active
$179,000
3
bds
|
1
ba
|
1,176
sqft
|
built
2000
9455 Cross Rdg, San Antonio, TX 78263
$-84
Cash flow
-2.4%
Cash-on-Cash Return
5.7%
Cap rate
0.9%
Rent to Value Ratio
Active
$204,900
3
bds
|
2
ba
|
1,354
sqft
|
built
2019
3111 Old Almonte Dr, San Antonio, TX 78224
$151
Cash flow
3.8%
Cash-on-Cash Return
7.2%
Cap rate
0.9%
Rent to Value Ratio
Active
$255,000
3
bds
|
2
ba
|
1,489
sqft
|
built
2020
7631 Toledo Bnd, San Antonio, TX 78252
$-599
Cash flow
-12.3%
Cash-on-Cash Return
3.4%
Cap rate
0.7%
Rent to Value Ratio
Active
$269,500
3
bds
|
2
ba
|
1,644
sqft
|
built
1982
4714 Bohill St, San Antonio, TX 78217
$-680
Cash flow
-13.2%
Cash-on-Cash Return
3.2%
Cap rate
0.7%
Rent to Value Ratio
Active
$275,000
3
bds
|
3
ba
|
1,846
sqft
|
built
2022
6026 Galena Rock, San Antonio, TX 78222
$-735
Cash flow
-13.9%
Cash-on-Cash Return
3.1%
Cap rate
0.7%
Rent to Value Ratio
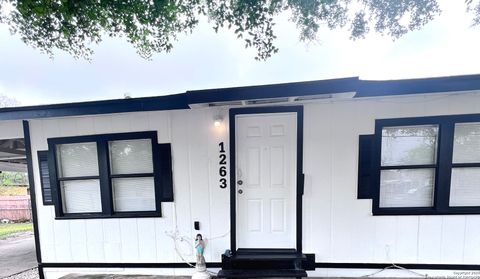
Active
$127,000
2
bds
|
1
ba
|
840
sqft
|
built
1956
1263 Brighton, San Antonio, TX 78211
$-157
Cash flow
-6.4%
Cash-on-Cash Return
4.8%
Cap rate
0.9%
Rent to Value Ratio
Active
$390,000
4
bds
|
0
ba
|
1,608
sqft
|
built
2021
2639 E Commerce St, San Antonio, TX 78203
$-1,568
Cash flow
-21.0%
Cash-on-Cash Return
1.4%
Cap rate
0.4%
Rent to Value Ratio
Active
$499,000
4
bds
|
0
ba
|
1,759
sqft
|
built
1948
2028 W Woodlawn Ave, San Antonio, TX 78201
$-2,016
Cash flow
-21.1%
Cash-on-Cash Return
1.4%
Cap rate
0.3%
Rent to Value Ratio
Active
$2,495,000
5
bds
|
7
ba
|
8,823
sqft
|
built
2005
45 Champions Run, San Antonio, TX 78258
$-12,331
Cash flow
-25.8%
Cash-on-Cash Return
0.3%
Cap rate
0.3%
Rent to Value Ratio
Active
$225,000
2
bds
|
3
ba
|
1,700
sqft
|
built
1976
3103 Eisenhauer Rd, San Antonio, TX 78209
$-812
Cash flow
-18.8%
Cash-on-Cash Return
1.9%
Cap rate
0.9%
Rent to Value Ratio
Active
$265,000
3
bds
|
2
ba
|
1,565
sqft
|
built
2020
7627 Toledo Bnd, San Antonio, TX 78252
$-631
Cash flow
-12.4%
Cash-on-Cash Return
3.4%
Cap rate
0.7%
Rent to Value Ratio
Active
$374,000
3
bds
|
3
ba
|
2,248
sqft
|
built
2021
5433 Agave Spine, San Antonio, TX 78261
$-873
Cash flow
-12.2%
Cash-on-Cash Return
3.5%
Cap rate
0.7%
Rent to Value Ratio
Active
$265,000
2
bds
|
2
ba
|
1,288
sqft
|
built
1928
734 Avant Ave, San Antonio, TX 78210
$-451
Cash flow
-8.9%
Cash-on-Cash Return
4.2%
Cap rate
0.8%
Rent to Value Ratio
Active
$138,000
2
bds
|
2
ba
|
1,090
sqft
|
built
1982
8633 Datapoint Dr, San Antonio, TX 78229
$-452
Cash flow
-17.1%
Cash-on-Cash Return
2.3%
Cap rate
1.0%
Rent to Value Ratio

Active
$3,200,000
6
bds
|
6
ba
|
4,351
sqft
|
built
1983
739 W Oak Estates Dr, San Antonio, TX 78260
$-13,401
Cash flow
-21.8%
Cash-on-Cash Return
1.2%
Cap rate
0.2%
Rent to Value Ratio
Active
$184,000
3
bds
|
1
ba
|
896
sqft
|
built
1971
8310 Running Horse St, San Antonio, TX 78242
$-62
Cash flow
-1.8%
Cash-on-Cash Return
5.9%
Cap rate
0.9%
Rent to Value Ratio
Active
$229,999
3
bds
|
2
ba
|
1,398
sqft
|
built
1984
11339 Jarbo Pass Dr, San Antonio, TX 78245
$-415
Cash flow
-9.4%
Cash-on-Cash Return
4.1%
Cap rate
0.7%
Rent to Value Ratio
Active
$635,000
4
bds
|
3
ba
|
1,878
sqft
|
built
1927
403 Queen Anne Ct, San Antonio, TX 78209
$-2,164
Cash flow
-17.8%
Cash-on-Cash Return
2.2%
Cap rate
0.5%
Rent to Value Ratio
Active
$445,000
3
bds
|
3
ba
|
2,554
sqft
|
built
1967
9210 Duchess St, San Antonio, TX 78216
$-711
Cash flow
-8.3%
Cash-on-Cash Return
4.3%
Cap rate
0.8%
Rent to Value Ratio
Active
$429,000
4
bds
|
2
ba
|
1,770
sqft
|
built
1962
1022 Grey Oak Dr, San Antonio, TX 78213
$-1,080
Cash flow
-13.1%
Cash-on-Cash Return
3.2%
Cap rate
0.6%
Rent to Value Ratio

Active
$360,000
4
bds
|
4
ba
|
3,327
sqft
|
built
2014
193 Tufted Crst, San Antonio, TX 78253
$-927
Cash flow
-13.4%
Cash-on-Cash Return
3.2%
Cap rate
0.6%
Rent to Value Ratio
Active
$444,900
1
bds
|
1
ba
|
738
sqft
|
built
2007
610 E Market St, San Antonio, TX 78205
$-2,203
Cash flow
-25.8%
Cash-on-Cash Return
0.3%
Cap rate
0.5%
Rent to Value Ratio
Active
$175,000
2
bds
|
3
ba
|
1,120
sqft
|
built
1972
7322 Oak Manor Dr, San Antonio, TX 78229
$-332
Cash flow
-9.9%
Cash-on-Cash Return
4.0%
Cap rate
1.0%
Rent to Value Ratio

Active
$295,000
6
bds
|
0
ba
|
2,773
sqft
|
built
1911
2810 Monterey St, San Antonio, TX 78207
$-842
Cash flow
-14.9%
Cash-on-Cash Return
2.8%
Cap rate
0.5%
Rent to Value Ratio
Active
$173,500
2
bds
|
2
ba
|
971
sqft
|
built
1981
13018 Heimer Rd, San Antonio, TX 78216
$-34,886
Cash flow
-1049.1%
Cash-on-Cash Return
-235.0%
Cap rate
0.8%
Rent to Value Ratio
Active
$215,000
2
bds
|
1
ba
|
1,133
sqft
|
built
1948
106 Kipling Ave, San Antonio, TX 78223
$-346
Cash flow
-8.4%
Cash-on-Cash Return
4.3%
Cap rate
0.7%
Rent to Value Ratio
Active
$175,000
3
bds
|
2
ba
|
1,176
sqft
|
built
1939
223 Astor St, San Antonio, TX 78210
$-37
Cash flow
-1.1%
Cash-on-Cash Return
6.0%
Cap rate
0.9%
Rent to Value Ratio
Active
$279,900
4
bds
|
3
ba
|
2,500
sqft
|
built
2005
6110 Pelican Coral, San Antonio, TX 78244
$-584
Cash flow
-10.9%
Cash-on-Cash Return
3.8%
Cap rate
0.7%
Rent to Value Ratio
Active
$458,500
4
bds
|
3
ba
|
2,906
sqft
|
built
1998
14 Dallari Ct, San Antonio, TX 78216
$-1,464
Cash flow
-16.7%
Cash-on-Cash Return
2.4%
Cap rate
0.6%
Rent to Value Ratio
Active
$470,000
3
bds
|
3
ba
|
2,960
sqft
|
built
2020
2019 Sladen Hls, San Antonio, TX 78253
$-1,358
Cash flow
-15.1%
Cash-on-Cash Return
2.8%
Cap rate
0.6%
Rent to Value Ratio
Active
$301,000
3
bds
|
2
ba
|
1,738
sqft
|
built
1967
4023 Goshen Pass St, San Antonio, TX 78230
$-861
Cash flow
-14.9%
Cash-on-Cash Return
2.8%
Cap rate
0.7%
Rent to Value Ratio