San Antonio, TX Investment Properties for Sale
Browse homes for sale and investment properties in San Antonio, TX. Refine your search by price, property type, or more.
Best cash flowing properties in San Antonio, TX
Active
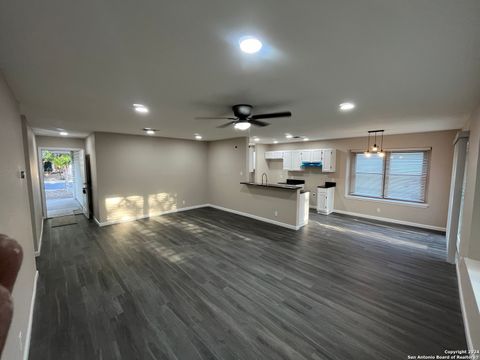
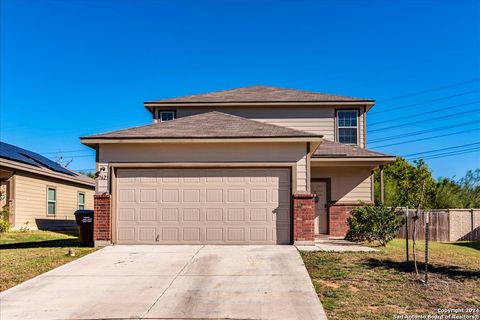
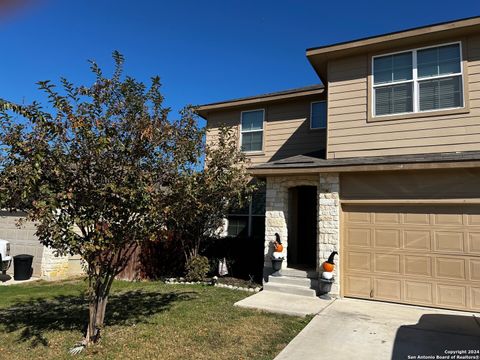
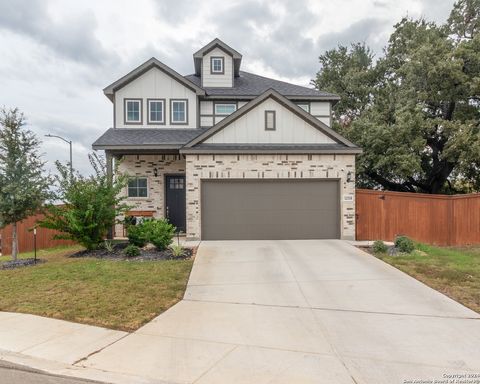
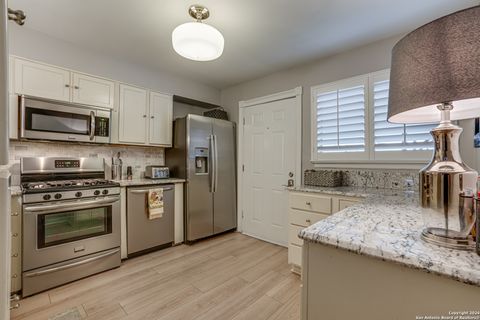
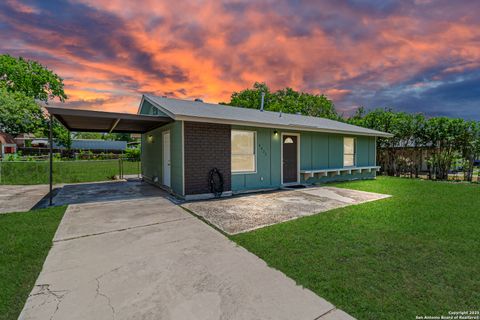
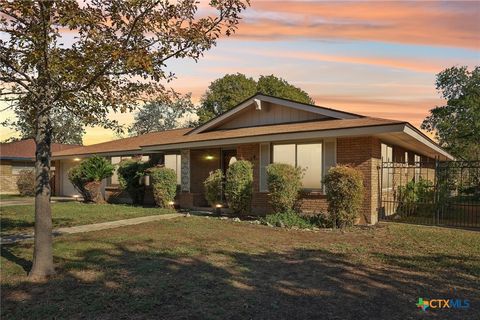
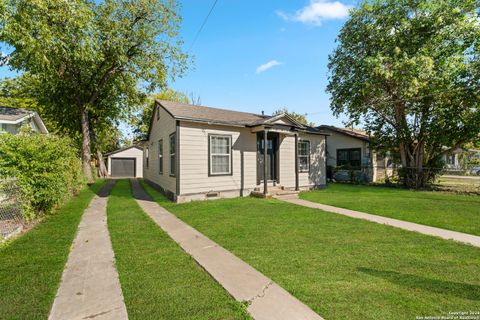
$210,000
4
bds
|
2
ba
|
1,302
sqft
|
built
1983
811 Thrasher Dr, San Antonio, TX 78245
$106
Cash flow
2.6%
Cash-on-Cash Return
6.9%
Cap rate
0.9%
Rent to Value Ratio
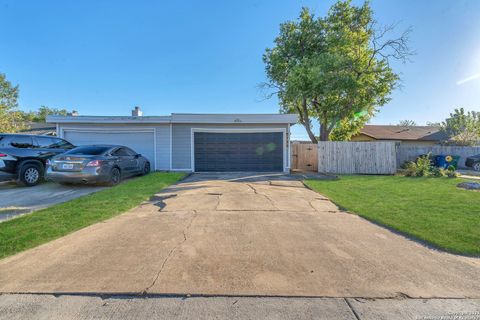
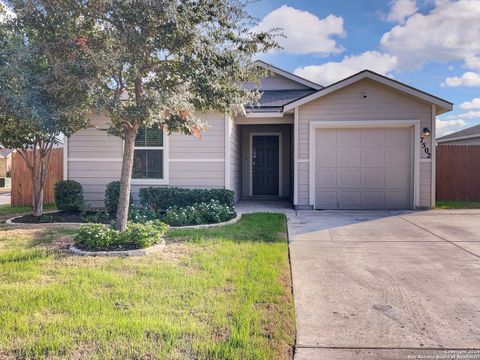
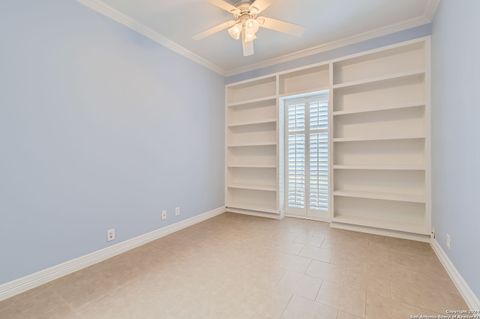
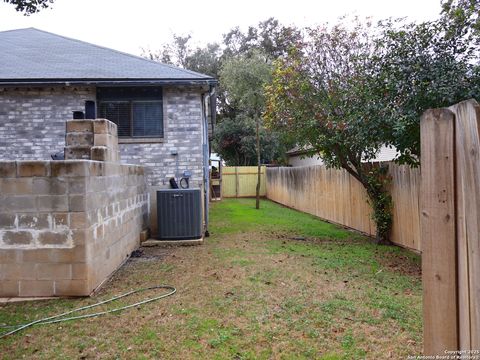
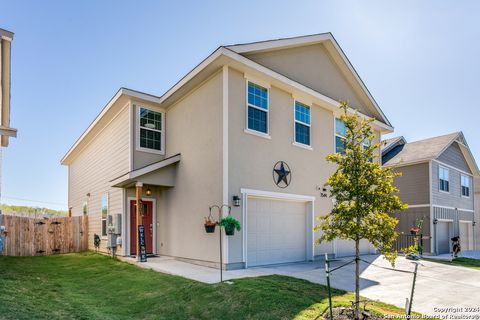
Active
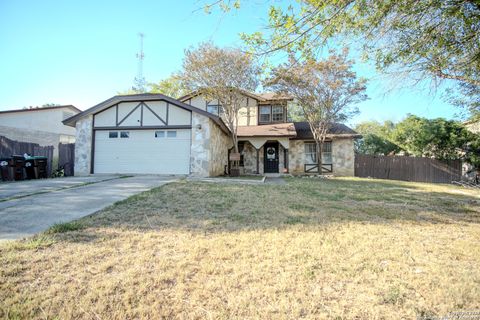
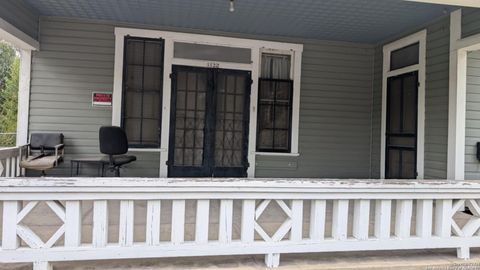
$174,900
3
bds
|
2
ba
|
1,104
sqft
|
built
1984
9730 Vale, San Antonio, TX 78245
$-113
Cash flow
-3.4%
Cash-on-Cash Return
5.5%
Cap rate
0.9%
Rent to Value Ratio
6,116 out of 6,413 properties for sale in San Antonio, TX
Limited Results Shown
Create a free account, or log in to reveal all property listings and enjoy the complete experience.
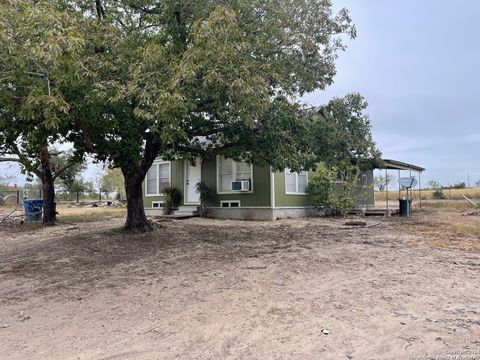
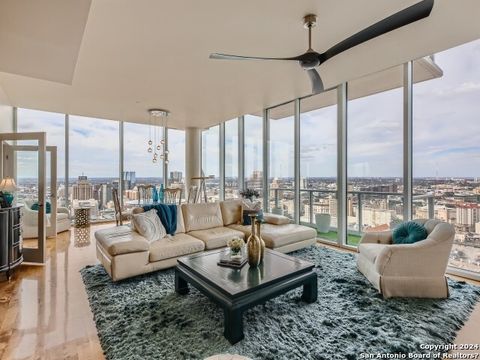
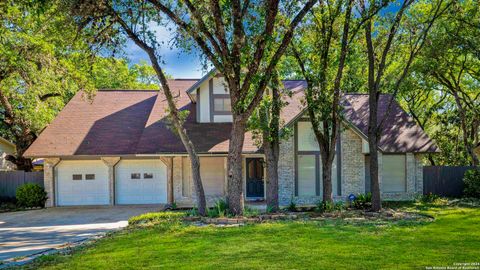
Active
$275,000
2
bds
|
1
ba
|
1,128
sqft
|
built
1948
4235 Mickey Rd, San Antonio, TX 78223
$-753
Cash flow
-14.3%
Cash-on-Cash Return
3.0%
Cap rate
0.5%
Rent to Value Ratio
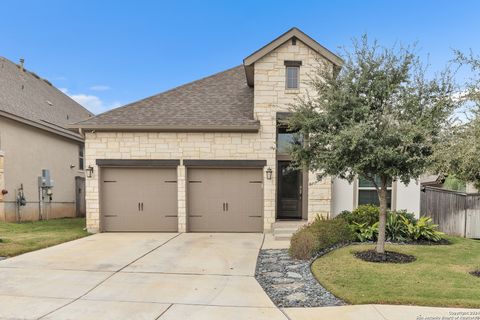
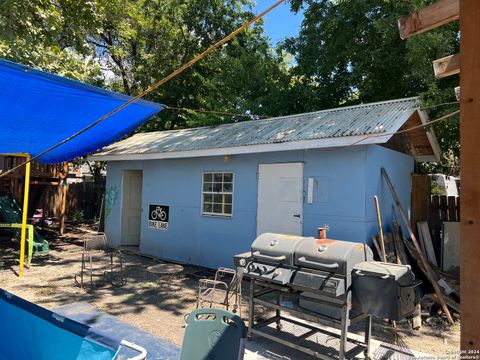
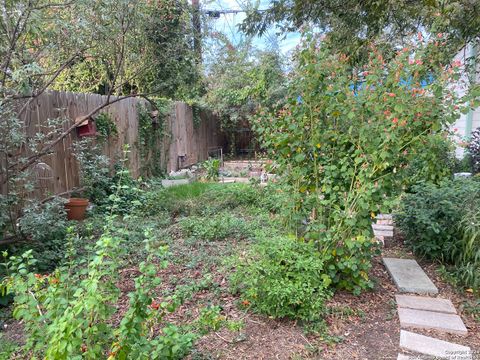
Active
$524,999
3
bds
|
2
ba
|
1,952
sqft
|
built
2019
28513 Shailene Dr, San Antonio, TX 78260
$-1,425
Cash flow
-14.2%
Cash-on-Cash Return
3.0%
Cap rate
0.6%
Rent to Value Ratio
Active
$239,000
3
bds
|
2
ba
|
1,290
sqft
|
built
1984
7322 Silent Hls, San Antonio, TX 78250
$-524
Cash flow
-11.4%
Cash-on-Cash Return
3.6%
Cap rate
0.7%
Rent to Value Ratio
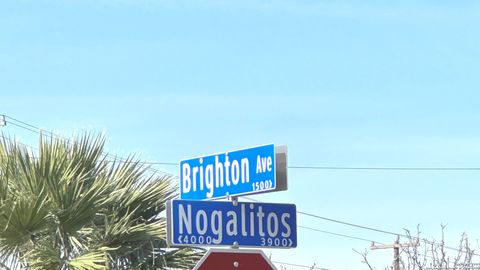
Active
$150,000
2
bds
|
0
ba
|
620
sqft
|
built
1949
1560 Brighton, San Antonio, TX 78211
$-542
Cash flow
-18.9%
Cash-on-Cash Return
1.9%
Cap rate
0.4%
Rent to Value Ratio

Active
$339,500
4
bds
|
3
ba
|
2,323
sqft
|
built
2021
14218 Minette Loop, San Antonio, TX 78253
$-1,003
Cash flow
-15.4%
Cash-on-Cash Return
2.7%
Cap rate
0.6%
Rent to Value Ratio
Active
$759,000
4
bds
|
5
ba
|
5,046
sqft
|
built
1984
206 Bluff Holw, San Antonio, TX 78216
$-1,754
Cash flow
-12.1%
Cash-on-Cash Return
3.5%
Cap rate
0.7%
Rent to Value Ratio
Active
$295,000
3
bds
|
3
ba
|
2,236
sqft
|
built
2020
939 Brown Thrasher, San Antonio, TX 78253
$-722
Cash flow
-12.8%
Cash-on-Cash Return
3.3%
Cap rate
0.7%
Rent to Value Ratio
Active
$260,000
4
bds
|
3
ba
|
1,706
sqft
|
built
2020
7623 Battle Grv, San Antonio, TX 78244
$-551
Cash flow
-11.1%
Cash-on-Cash Return
3.7%
Cap rate
0.7%
Rent to Value Ratio
Active
$275,000
4
bds
|
2
ba
|
2,251
sqft
|
built
2004
7442 Tamburo Trl, San Antonio, TX 78266
$-683
Cash flow
-13.0%
Cash-on-Cash Return
3.3%
Cap rate
0.7%
Rent to Value Ratio
Active
$223,000
4
bds
|
2
ba
|
2,130
sqft
|
built
1979
6723 Vineland, San Antonio, TX 78239
$-185
Cash flow
-4.3%
Cash-on-Cash Return
5.3%
Cap rate
0.9%
Rent to Value Ratio
Active
$115,000
1
bds
|
1
ba
|
473
sqft
|
built
1984
4803 Hamilton Wolfe Rd, San Antonio, TX 78229
$-457
Cash flow
-20.7%
Cash-on-Cash Return
1.5%
Cap rate
0.7%
Rent to Value Ratio
Active
$279,000
5
bds
|
3
ba
|
2,514
sqft
|
built
2016
7135 Pandora Way, San Antonio, TX 78252
$-740
Cash flow
-13.8%
Cash-on-Cash Return
3.1%
Cap rate
0.7%
Rent to Value Ratio
Active
$207,000
3
bds
|
2
ba
|
1,305
sqft
|
built
2020
7502 Hercules Pt, San Antonio, TX 78252
$-469
Cash flow
-11.8%
Cash-on-Cash Return
3.5%
Cap rate
0.8%
Rent to Value Ratio
Active
$855,000
2
bds
|
2
ba
|
1,572
sqft
|
built
2007
610 E Market St, San Antonio, TX 78205
$-4,692
Cash flow
-28.6%
Cash-on-Cash Return
-0.3%
Cap rate
0.4%
Rent to Value Ratio
Active
$145,000
3
bds
|
1
ba
|
904
sqft
|
built
1910
615 E Carolina St, San Antonio, TX 78210
$-137
Cash flow
-4.9%
Cash-on-Cash Return
5.1%
Cap rate
1.0%
Rent to Value Ratio
Active
$480,000
4
bds
|
3
ba
|
2,360
sqft
|
built
2021
12518 Yellowstone Pt, San Antonio, TX 78254
$-1,285
Cash flow
-14.0%
Cash-on-Cash Return
3.1%
Cap rate
0.6%
Rent to Value Ratio

Active
$1,099,000
10
bds
|
0
ba
|
5,488
sqft
|
built
1926
403 W Hollywood Ave, San Antonio, TX 78212
$-5,564
Cash flow
-26.4%
Cash-on-Cash Return
0.2%
Cap rate
0.2%
Rent to Value Ratio
Active
$300,000
3
bds
|
1
ba
|
1,938
sqft
|
built
1930
1122 Burnet St, San Antonio, TX 78202
$-1,117
Cash flow
-19.4%
Cash-on-Cash Return
1.8%
Cap rate
0.6%
Rent to Value Ratio
Active
$449,500
5
bds
|
4
ba
|
3,102
sqft
|
built
1968
5410 Plantation, San Antonio, TX 78230
$-1,131
Cash flow
-13.1%
Cash-on-Cash Return
3.2%
Cap rate
0.7%
Rent to Value Ratio
Active
$299,900
3
bds
|
2
ba
|
1,212
sqft
|
built
1930
1027 Hammond Ave, San Antonio, TX 78210
$-673
Cash flow
-11.7%
Cash-on-Cash Return
3.6%
Cap rate
0.6%
Rent to Value Ratio
Active
$150,000
2
bds
|
2
ba
|
1,027
sqft
|
built
1984
5322 Medical Dr, San Antonio, TX 78240
$-623
Cash flow
-21.7%
Cash-on-Cash Return
1.3%
Cap rate
0.7%
Rent to Value Ratio
Active
$360,000
4
bds
|
3
ba
|
2,270
sqft
|
built
2024
13226 Fantine Flds, San Antonio, TX 78253
$-885
Cash flow
-12.8%
Cash-on-Cash Return
3.3%
Cap rate
0.7%
Rent to Value Ratio
Active
$154,000
2
bds
|
2
ba
|
1,005
sqft
|
built
1984
4119 Medical Dr, San Antonio, TX 78229
$-587
Cash flow
-19.9%
Cash-on-Cash Return
1.7%
Cap rate
0.9%
Rent to Value Ratio
Active
$205,000
3
bds
|
2
ba
|
1,440
sqft
|
built
1920
928 Kayton Ave, San Antonio, TX 78210
$-265
Cash flow
-6.7%
Cash-on-Cash Return
4.7%
Cap rate
0.9%
Rent to Value Ratio
Active
$174,900
3
bds
|
2
ba
|
1,104
sqft
|
built
1984
9730 Vale, San Antonio, TX 78245
$-113
Cash flow
-3.4%
Cash-on-Cash Return
5.5%
Cap rate
0.9%
Rent to Value Ratio
Active
$225,000
2
bds
|
2
ba
|
1,060
sqft
|
built
1964
8058 Broadway, San Antonio, TX 78209
$-714
Cash flow
-16.6%
Cash-on-Cash Return
2.5%
Cap rate
0.8%
Rent to Value Ratio
Active
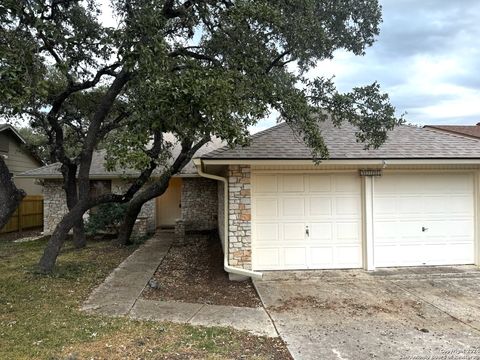
$210,000
4
bds
|
2
ba
|
1,302
sqft
|
built
1983
811 Thrasher Dr, San Antonio, TX 78245
$106
Cash flow
2.6%
Cash-on-Cash Return
6.9%
Cap rate
0.9%
Rent to Value Ratio
Active
$177,000
3
bds
|
1
ba
|
867
sqft
|
built
1970
4822 Castle Inn, San Antonio, TX 78218
$-176
Cash flow
-5.2%
Cash-on-Cash Return
5.1%
Cap rate
0.8%
Rent to Value Ratio

Active
$476,000
4
bds
|
3
ba
|
2,490
sqft
|
built
2016
21911 Caprock Cyn, San Antonio, TX 78258
$-1,515
Cash flow
-16.6%
Cash-on-Cash Return
2.4%
Cap rate
0.6%
Rent to Value Ratio
Active
$245,000
2
bds
|
2
ba
|
937
sqft
|
built
1966
7711 Broadway, San Antonio, TX 78209
$-1,113
Cash flow
-23.7%
Cash-on-Cash Return
0.8%
Cap rate
0.7%
Rent to Value Ratio
Active
$395,000
3
bds
|
2
ba
|
2,350
sqft
|
built
1994
15822 Lomita Springs Dr, San Antonio, TX 78247
$-624
Cash flow
-8.2%
Cash-on-Cash Return
4.4%
Cap rate
0.6%
Rent to Value Ratio
Active
$370,000
3
bds
|
2
ba
|
1,756
sqft
|
built
1968
10814 Mount Tipton, San Antonio, TX 78213
$-799
Cash flow
-11.3%
Cash-on-Cash Return
3.7%
Cap rate
0.7%
Rent to Value Ratio
Active
$1,220,000
5
bds
|
4
ba
|
4,171
sqft
|
built
2003
26006 Syrinx, San Antonio, TX 78260
$-3,827
Cash flow
-16.4%
Cash-on-Cash Return
2.5%
Cap rate
0.5%
Rent to Value Ratio
Active
$120,000
2
bds
|
2
ba
|
751
sqft
|
built
1948
234 Kashmuir Pl, San Antonio, TX 78223
$-167
Cash flow
-7.3%
Cash-on-Cash Return
4.6%
Cap rate
0.8%
Rent to Value Ratio
Active
$535,000
3
bds
|
3
ba
|
2,588
sqft
|
built
2004
19007 Pleasanton Rd, San Antonio, TX 78221
$-836
Cash flow
-8.2%
Cash-on-Cash Return
4.4%
Cap rate
0.7%
Rent to Value Ratio
Active
$467,000
3
bds
|
3
ba
|
2,413
sqft
|
built
2012
11934 Tokyo, San Antonio, TX 78230
$-1,638
Cash flow
-18.3%
Cash-on-Cash Return
2.1%
Cap rate
0.6%
Rent to Value Ratio
Active
$269,900
3
bds
|
2
ba
|
1,476
sqft
|
built
2022
5882 Castle Run, San Antonio, TX 78218
$-604
Cash flow
-11.7%
Cash-on-Cash Return
3.6%
Cap rate
0.7%
Rent to Value Ratio

Active
$485,000
4
bds
|
4
ba
|
3,123
sqft
|
built
2018
3706 Song Fiddler, San Antonio, TX 78253
$-1,344
Cash flow
-14.5%
Cash-on-Cash Return
2.9%
Cap rate
0.6%
Rent to Value Ratio
Active
$215,000
3
bds
|
2
ba
|
1,028
sqft
|
built
1943
611 Kirk Pl, San Antonio, TX 78225
$-190
Cash flow
-4.6%
Cash-on-Cash Return
5.2%
Cap rate
0.8%
Rent to Value Ratio
Active
$495,000
6
bds
|
0
ba
|
3,010
sqft
|
built
2023
7544 Magnolia Vlg, San Antonio, TX 78252
$-1,863
Cash flow
-19.6%
Cash-on-Cash Return
1.7%
Cap rate
0.4%
Rent to Value Ratio