San Antonio, TX Investment Properties for Sale
Browse homes for sale and investment properties in San Antonio, TX. Refine your search by price, property type, or more.
Best cash flowing properties in San Antonio, TX
Active
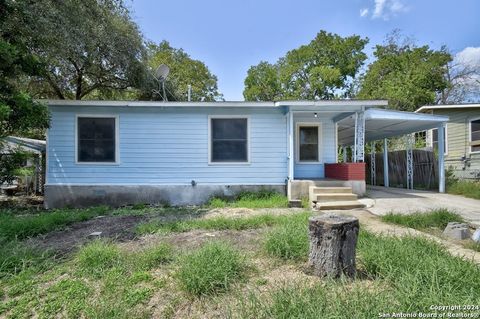
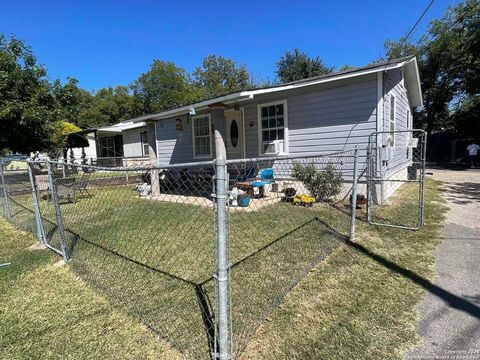
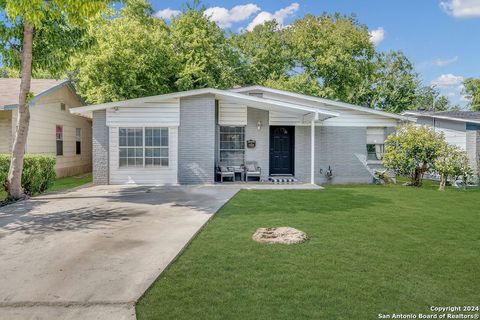
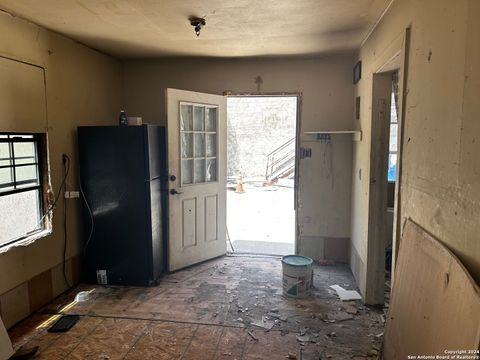
$109,900
2
bds
|
1
ba
|
832
sqft
|
built
1952
235 Loma Park Dr, San Antonio, TX 78228
$111
Cash flow
5.3%
Cash-on-Cash Return
7.5%
Cap rate
1.1%
Rent to Value Ratio

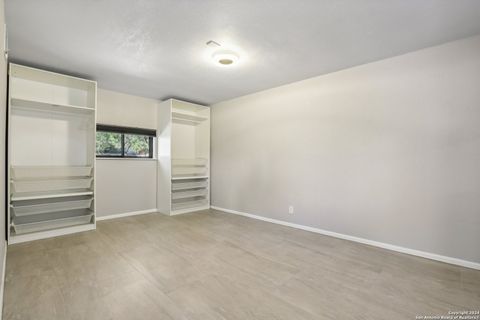
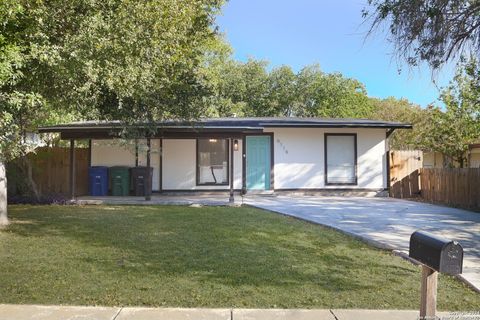
Active
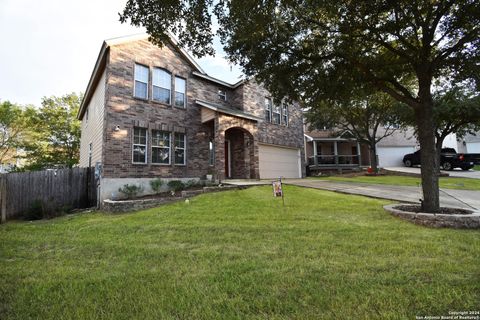
$164,000
3
bds
|
1
ba
|
1,074
sqft
|
built
1954
138 Antrim Dr, San Antonio, TX 78218
$50
Cash flow
1.6%
Cash-on-Cash Return
6.6%
Cap rate
1.0%
Rent to Value Ratio
6,150 out of 6,446 properties for sale in San Antonio, TX
Limited Results Shown
Create a free account, or log in to reveal all property listings and enjoy the complete experience.

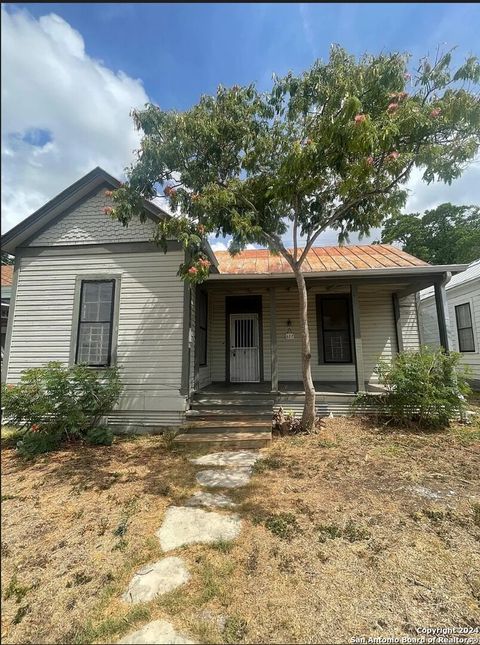
Active
$165,000
3
bds
|
2
ba
|
1,739
sqft
|
built
1900
1110 S Hackberry St, San Antonio, TX 78210
$-547
Cash flow
-17.3%
Cash-on-Cash Return
2.3%
Cap rate
0.8%
Rent to Value Ratio
Active
$164,000
3
bds
|
1
ba
|
1,074
sqft
|
built
1954
138 Antrim Dr, San Antonio, TX 78218
$50
Cash flow
1.6%
Cash-on-Cash Return
6.6%
Cap rate
1.0%
Rent to Value Ratio
Active
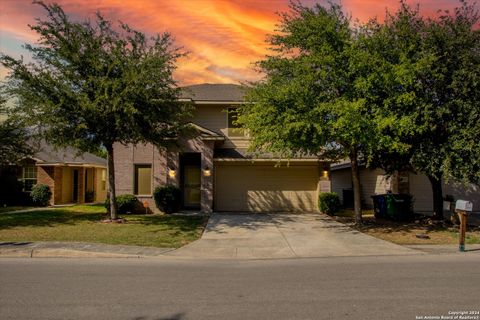
$400,000
4
bds
|
3
ba
|
2,115
sqft
|
built
1996
638 Spacious Sky, San Antonio, TX 78260
$-1,000
Cash flow
-13.0%
Cash-on-Cash Return
3.3%
Cap rate
0.6%
Rent to Value Ratio

Active
$192,500
2
bds
|
1
ba
|
1,144
sqft
|
built
1930
543 Kayton Ave, San Antonio, TX 78210
$-214
Cash flow
-5.8%
Cash-on-Cash Return
4.9%
Cap rate
0.8%
Rent to Value Ratio
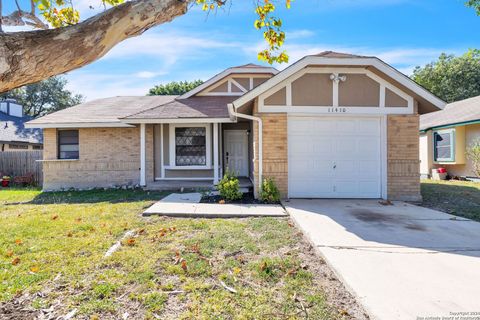
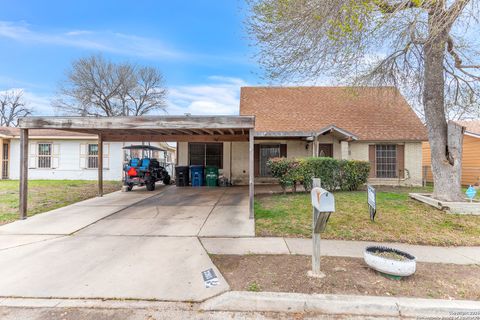
Active
$189,900
3
bds
|
2
ba
|
1,375
sqft
|
built
1984
11410 Hatchet Pass Dr, San Antonio, TX 78245
$-247
Cash flow
-6.8%
Cash-on-Cash Return
4.7%
Cap rate
0.8%
Rent to Value Ratio

Active
$220,000
3
bds
|
2
ba
|
1,456
sqft
|
built
2012
3554 York Crst, San Antonio, TX 78245
$-442
Cash flow
-10.5%
Cash-on-Cash Return
3.9%
Cap rate
0.7%
Rent to Value Ratio
Active
$255,000
4
bds
|
3
ba
|
1,899
sqft
|
built
2022
219 Gray St, San Antonio, TX 78208
$-415
Cash flow
-8.5%
Cash-on-Cash Return
4.3%
Cap rate
0.9%
Rent to Value Ratio
Active
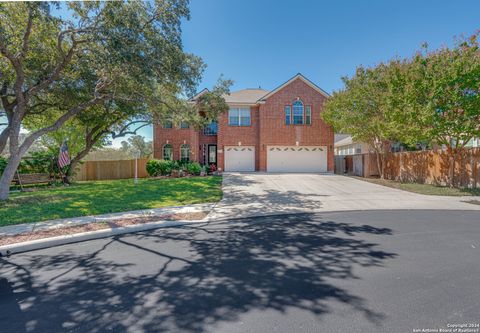
$499,900
4
bds
|
3
ba
|
3,269
sqft
|
built
2003
3303 Cambria Way, San Antonio, TX 78251
$-1,402
Cash flow
-14.6%
Cash-on-Cash Return
2.9%
Cap rate
0.6%
Rent to Value Ratio
Active
$219,900
3
bds
|
2
ba
|
2,341
sqft
|
built
2008
4311 Stetson Park, San Antonio, TX 78223
$-496
Cash flow
-11.8%
Cash-on-Cash Return
3.6%
Cap rate
0.7%
Rent to Value Ratio
Active
$215,000
1
bds
|
1
ba
|
650
sqft
|
built
1946
1331 S Flores St, San Antonio, TX 78204
$-764
Cash flow
-18.5%
Cash-on-Cash Return
2.0%
Cap rate
0.7%
Rent to Value Ratio
Active
$340,000
5
bds
|
3
ba
|
2,595
sqft
|
built
2006
5823 Barton Holw, San Antonio, TX 78249
$-843
Cash flow
-12.9%
Cash-on-Cash Return
3.3%
Cap rate
0.7%
Rent to Value Ratio

Active
$315,000
4
bds
|
0
ba
|
1,696
sqft
|
built
1908
418 Warren St, San Antonio, TX 78212
$-1,419
Cash flow
-23.5%
Cash-on-Cash Return
0.9%
Cap rate
0.3%
Rent to Value Ratio
Active
$249,900
3
bds
|
2
ba
|
1,232
sqft
|
built
1930
1824 Montana St, San Antonio, TX 78203
$-434
Cash flow
-9.1%
Cash-on-Cash Return
4.2%
Cap rate
0.6%
Rent to Value Ratio
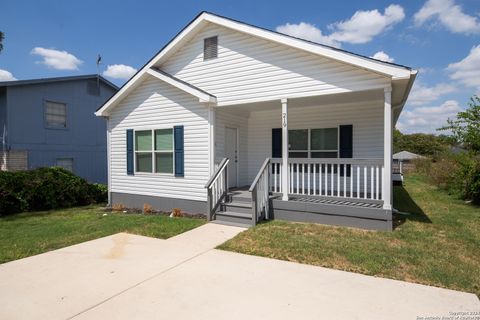
Active
$115,000
2
bds
|
1
ba
|
780
sqft
|
built
1958
424 N San Horacio Ave, San Antonio, TX 78228
$40
Cash flow
1.8%
Cash-on-Cash Return
6.7%
Cap rate
1.0%
Rent to Value Ratio

Active
$589,990
4
bds
|
4
ba
|
3,312
sqft
|
built
2021
4117 Monteverde Vw, San Antonio, TX 78261
$-1,983
Cash flow
-17.5%
Cash-on-Cash Return
2.2%
Cap rate
0.6%
Rent to Value Ratio

Active
$25,000
1
bds
|
1
ba
|
688
sqft
|
built
1988
1 Towers Park Ln, San Antonio, TX 78209
$-1,227
Cash flow
-57.2%
Cash-on-Cash Return
-58.9%
Cap rate
5.6%
Rent to Value Ratio
Active
$109,900
2
bds
|
1
ba
|
832
sqft
|
built
1952
235 Loma Park Dr, San Antonio, TX 78228
$111
Cash flow
5.3%
Cash-on-Cash Return
7.5%
Cap rate
1.1%
Rent to Value Ratio
Active
$154,000
3
bds
|
1
ba
|
992
sqft
|
built
1971
6119 Deep Valley Dr, San Antonio, TX 78242
$-44
Cash flow
-1.5%
Cash-on-Cash Return
5.9%
Cap rate
1.0%
Rent to Value Ratio
Active
$169,000
2
bds
|
2
ba
|
1,005
sqft
|
built
1982
11520 Huebner Rd, San Antonio, TX 78230
$-691
Cash flow
-21.3%
Cash-on-Cash Return
1.4%
Cap rate
0.7%
Rent to Value Ratio
Active
$275,000
4
bds
|
2
ba
|
1,795
sqft
|
built
1948
415 North Dr, San Antonio, TX 78201
$-953
Cash flow
-18.1%
Cash-on-Cash Return
2.1%
Cap rate
0.6%
Rent to Value Ratio
Active
$355,000
2
bds
|
2
ba
|
1,790
sqft
|
built
2010
12551 Rapids Pass, San Antonio, TX 78253
$-1,231
Cash flow
-18.1%
Cash-on-Cash Return
2.1%
Cap rate
0.6%
Rent to Value Ratio
Active
$124,500
3
bds
|
2
ba
|
1,344
sqft
|
built
1947
398 Fairview Ave, San Antonio, TX 78223
$-82
Cash flow
-3.4%
Cash-on-Cash Return
5.5%
Cap rate
1.1%
Rent to Value Ratio

Active
$230,000
2
bds
|
1
ba
|
1,167
sqft
|
built
1920
335 Elmhurst Ave, San Antonio, TX 78209
$-908
Cash flow
-20.6%
Cash-on-Cash Return
1.5%
Cap rate
0.6%
Rent to Value Ratio

Active
$499,900
5
bds
|
4
ba
|
2,839
sqft
|
built
1953
101 Linda Dr, San Antonio, TX 78216
$-1,461
Cash flow
-15.2%
Cash-on-Cash Return
2.8%
Cap rate
0.6%
Rent to Value Ratio
Active
$195,000
3
bds
|
2
ba
|
1,548
sqft
|
built
1954
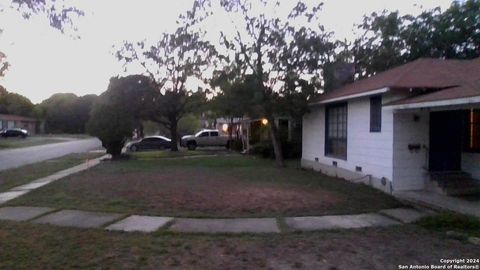
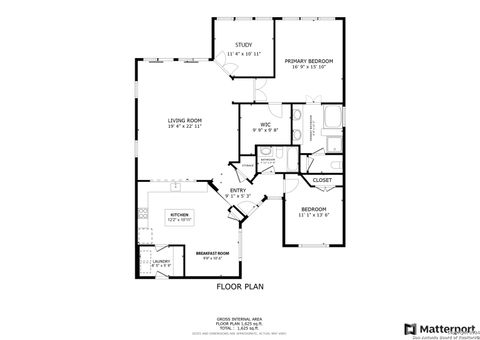
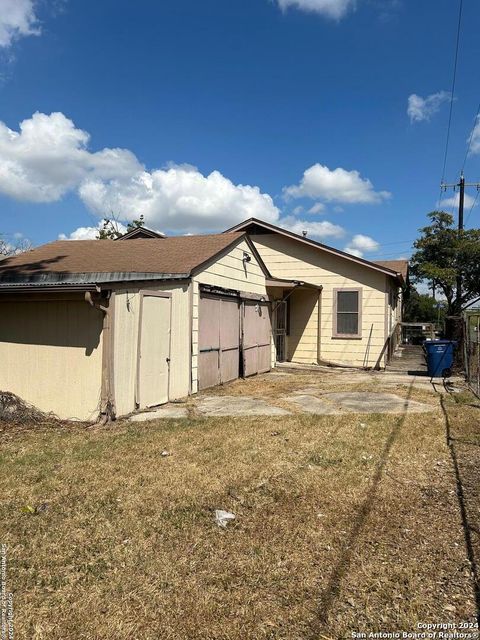
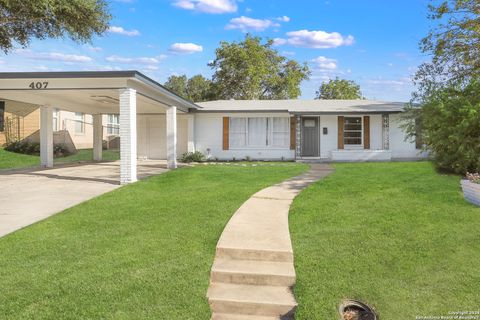
407 Mc Neel Rd, San Antonio, TX 78228
$-293
Cash flow
-7.8%
Cash-on-Cash Return
4.5%
Cap rate
0.9%
Rent to Value Ratio
Active
$205,000
4
bds
|
1
ba
|
1,288
sqft
|
built
1960
2223 Ramona, San Antonio, TX 78201
$-381
Cash flow
-9.7%
Cash-on-Cash Return
4.0%
Cap rate
0.8%
Rent to Value Ratio
Active
$274,900
6
bds
|
0
ba
|
2,526
sqft
|
built
2021
108 Spruce St, San Antonio, TX 78203
$-469
Cash flow
-8.9%
Cash-on-Cash Return
4.2%
Cap rate
0.5%
Rent to Value Ratio
Active
$255,000
4
bds
|
2
ba
|
1,567
sqft
|
built
1983
7111 Bart Holw, San Antonio, TX 78250
$-633
Cash flow
-13.0%
Cash-on-Cash Return
3.3%
Cap rate
0.7%
Rent to Value Ratio
Active
$369,900
4
bds
|
3
ba
|
2,740
sqft
|
built
2005
8810 Mainland Rdg, San Antonio, TX 78250
$-61,476
Cash flow
-867.1%
Cash-on-Cash Return
-193.2%
Cap rate
0.6%
Rent to Value Ratio
Active
$147,500
4
bds
|
4
ba
|
2,002
sqft
|
built
1929
348 Pendleton Ave, San Antonio, TX 78204
$-555
Cash flow
-19.6%
Cash-on-Cash Return
1.7%
Cap rate
0.9%
Rent to Value Ratio
Active
$270,000
4
bds
|
3
ba
|
2,468
sqft
|
built
2007
9171 Everton, San Antonio, TX 78245
$-616
Cash flow
-11.9%
Cash-on-Cash Return
3.5%
Cap rate
0.7%
Rent to Value Ratio
Active
$198,000
2
bds
|
2
ba
|
1,402
sqft
|
built
1905
617 Montana St, San Antonio, TX 78203
$-435
Cash flow
-11.5%
Cash-on-Cash Return
3.6%
Cap rate
0.8%
Rent to Value Ratio

Active
$549,500
3
bds
|
3
ba
|
2,260
sqft
|
built
2022
28310 Charlotte Cv, San Antonio, TX 78260
$-920
Cash flow
-8.7%
Cash-on-Cash Return
4.3%
Cap rate
0.6%
Rent to Value Ratio
Active
$207,000
4
bds
|
3
ba
|
2,134
sqft
|
built
1970
3203 Coconino Dr, San Antonio, TX 78211
$-287
Cash flow
-7.2%
Cash-on-Cash Return
4.6%
Cap rate
0.9%
Rent to Value Ratio

Active
$1,150,000
4
bds
|
4
ba
|
4,736
sqft
|
built
1997
12439 Winding Br, San Antonio, TX 78230
$-3,933
Cash flow
-17.8%
Cash-on-Cash Return
2.2%
Cap rate
0.5%
Rent to Value Ratio

Active
$437,500
2
bds
|
2
ba
|
1,528
sqft
|
built
2015
1401 S Flores St, San Antonio, TX 78204
$-2,181
Cash flow
-26.0%
Cash-on-Cash Return
0.3%
Cap rate
0.6%
Rent to Value Ratio
Active
$339,500
3
bds
|
2
ba
|
2,421
sqft
|
built
1972
12743 El Sonteo St, San Antonio, TX 78233
$-866
Cash flow
-13.3%
Cash-on-Cash Return
3.2%
Cap rate
0.7%
Rent to Value Ratio
Active
$335,000
4
bds
|
3
ba
|
2,606
sqft
|
built
2023
10623 Mexia Ave, San Antonio, TX 78252
$-772
Cash flow
-12.0%
Cash-on-Cash Return
3.5%
Cap rate
0.7%
Rent to Value Ratio
Active
$482,000
3
bds
|
4
ba
|
2,678
sqft
|
built
2011
12606 Lost Maples, San Antonio, TX 78253
$-1,567
Cash flow
-17.0%
Cash-on-Cash Return
2.4%
Cap rate
0.6%
Rent to Value Ratio

Active
$540,000
5
bds
|
4
ba
|
3,195
sqft
|
built
2003
306 Persimmon Trl, San Antonio, TX 78256
$-1,487
Cash flow
-14.4%
Cash-on-Cash Return
3.0%
Cap rate
0.6%
Rent to Value Ratio