San Antonio, TX Investment Properties for Sale
Browse homes for sale and investment properties in San Antonio, TX. Refine your search by price, property type, or more.
Best cash flowing properties in San Antonio, TX
Active
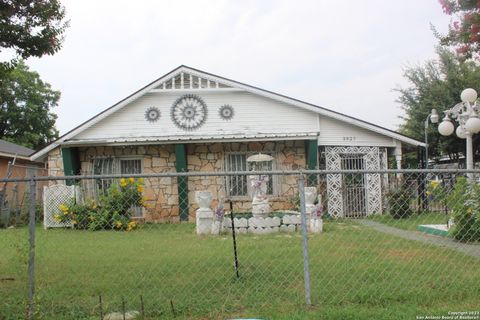
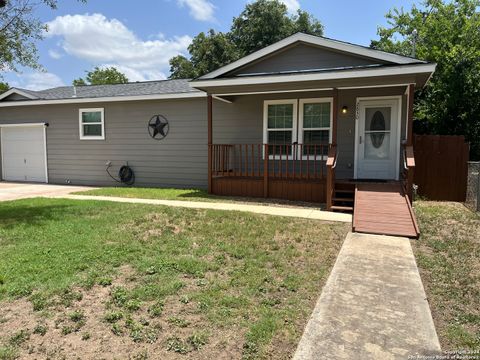
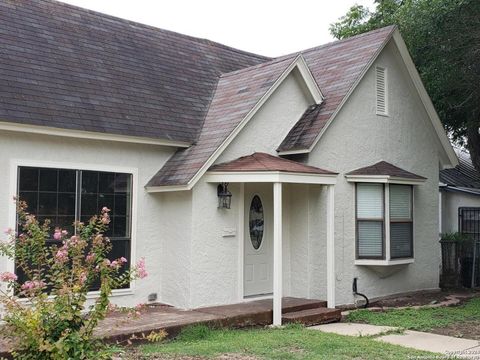
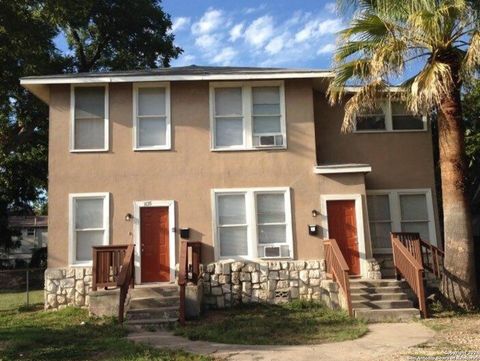
$135,000
3
bds
|
2
ba
|
1,632
sqft
|
built
1945
3927 W Travis St, San Antonio, TX 78207
$-10
Cash flow
-0.4%
Cash-on-Cash Return
6.2%
Cap rate
1.2%
Rent to Value Ratio
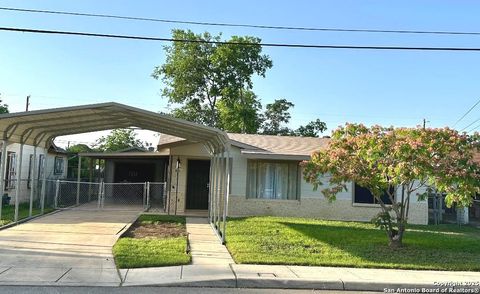
Active
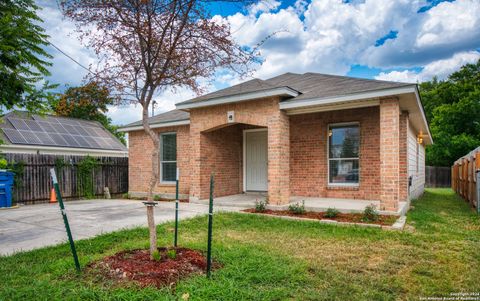
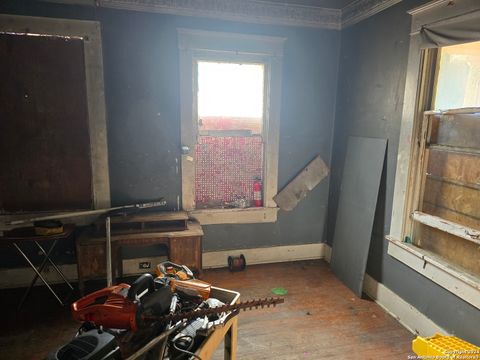
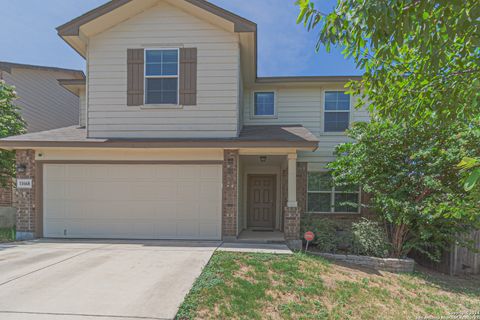
$205,000
3
bds
|
2
ba
|
1,224
sqft
|
built
2003
430 S Acme Rd, San Antonio, TX 78237
$-208
Cash flow
-5.3%
Cash-on-Cash Return
5.0%
Cap rate
0.8%
Rent to Value Ratio
6,106 out of 6,402 properties for sale in San Antonio, TX
Limited Results Shown
Create a free account, or log in to reveal all property listings and enjoy the complete experience.

Active
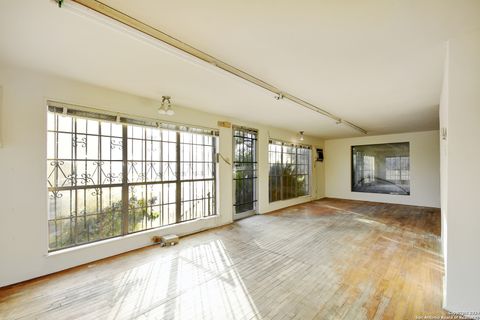
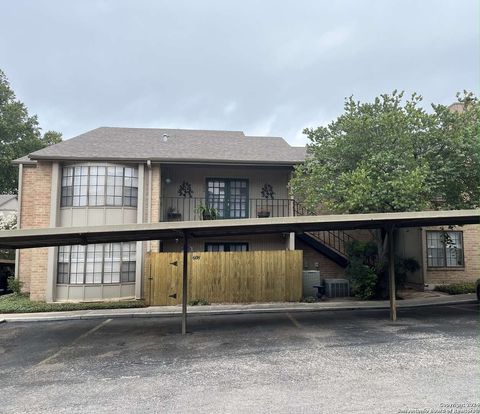
$358,999
3
bds
|
2
ba
|
1,462
sqft
|
built
1930
823 N Palmetto, San Antonio, TX 78202
$-975
Cash flow
-14.2%
Cash-on-Cash Return
3.0%
Cap rate
0.6%
Rent to Value Ratio
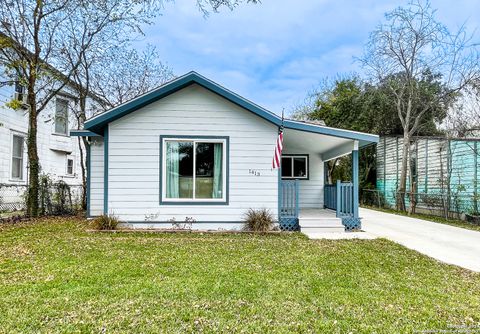
Active
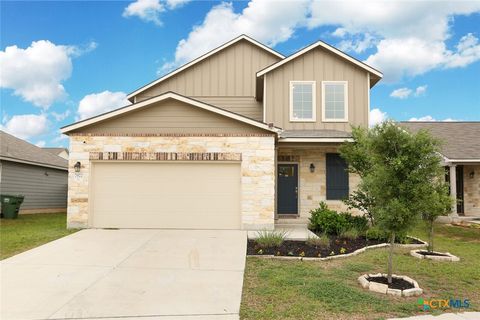
$269,000
4
bds
|
3
ba
|
1,232
sqft
|
built
1941
1413 Santa Monica St, San Antonio, TX 78201
$-709
Cash flow
-13.8%
Cash-on-Cash Return
3.1%
Cap rate
0.7%
Rent to Value Ratio
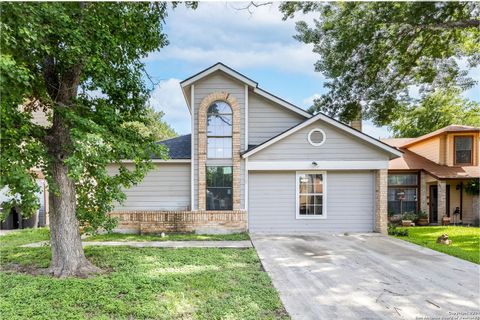
Active
$228,000
4
bds
|
2
ba
|
1,554
sqft
|
built
1986
9330 Village Lance, San Antonio, TX 78250
$-485
Cash flow
-11.1%
Cash-on-Cash Return
3.7%
Cap rate
0.7%
Rent to Value Ratio
Active
$280,000
3
bds
|
2
ba
|
1,672
sqft
|
built
2007
5811 Valparaiso Way, San Antonio, TX 78249
$-629
Cash flow
-11.7%
Cash-on-Cash Return
3.6%
Cap rate
0.7%
Rent to Value Ratio
Active
$261,500
4
bds
|
3
ba
|
2,085
sqft
|
built
2013
3915 Southern Sky, San Antonio, TX 78222
$-650
Cash flow
-13.0%
Cash-on-Cash Return
3.3%
Cap rate
0.7%
Rent to Value Ratio
Active
$267,000
3
bds
|
2
ba
|
1,474
sqft
|
built
2024
6236 Grange Vly, San Antonio, TX 78252
$-537
Cash flow
-10.5%
Cash-on-Cash Return
3.9%
Cap rate
0.6%
Rent to Value Ratio

Active
$323,500
4
bds
|
3
ba
|
1,918
sqft
|
built
2022
4554 Martin Way, San Antonio, TX 78222
$-823
Cash flow
-13.3%
Cash-on-Cash Return
3.2%
Cap rate
0.6%
Rent to Value Ratio
Active
$143,000
2
bds
|
2
ba
|
1,200
sqft
|
built
1982
5359 Fredericksburg Rd, San Antonio, TX 78229
$-336
Cash flow
-12.3%
Cash-on-Cash Return
3.4%
Cap rate
1.0%
Rent to Value Ratio
Active
$325,000
3
bds
|
2
ba
|
1,530
sqft
|
built
1962
11119 Auldine Dr, San Antonio, TX 78230
$-869
Cash flow
-14.0%
Cash-on-Cash Return
3.1%
Cap rate
0.6%
Rent to Value Ratio
Active
$414,000
3
bds
|
3
ba
|
2,145
sqft
|
built
2008
8250 Cruiseship Bay, San Antonio, TX 78255
$-1,476
Cash flow
-18.6%
Cash-on-Cash Return
2.0%
Cap rate
0.7%
Rent to Value Ratio
Active
$264,999
3
bds
|
2
ba
|
1,160
sqft
|
built
2022
6607 Baroque Ter, San Antonio, TX 78252
$-715
Cash flow
-14.1%
Cash-on-Cash Return
3.0%
Cap rate
0.6%
Rent to Value Ratio
Active
$284,000
2
bds
|
2
ba
|
1,372
sqft
|
built
1919
134 E High Ave, San Antonio, TX 78210
$-773
Cash flow
-14.2%
Cash-on-Cash Return
3.0%
Cap rate
0.6%
Rent to Value Ratio
Active
$200,000
3
bds
|
2
ba
|
1,029
sqft
|
built
1984
8760 Port Of Call Dr, San Antonio, TX 78242
$-309
Cash flow
-8.1%
Cash-on-Cash Return
4.4%
Cap rate
0.8%
Rent to Value Ratio
Active
$1,150,000
7
bds
|
4
ba
|
3,421
sqft
|
built
1910
223 E Craig Pl, San Antonio, TX 78212
$-5,286
Cash flow
-24.0%
Cash-on-Cash Return
0.7%
Cap rate
0.3%
Rent to Value Ratio
Active
$579,500
5
bds
|
4
ba
|
4,590
sqft
|
built
2006
20514 Cliff Park, San Antonio, TX 78258
$-1,929
Cash flow
-17.4%
Cash-on-Cash Return
2.3%
Cap rate
0.6%
Rent to Value Ratio
Active
$135,000
3
bds
|
3
ba
|
1,092
sqft
|
built
1919
1640 Center St, San Antonio, TX 78202
$-218
Cash flow
-8.4%
Cash-on-Cash Return
4.3%
Cap rate
1.0%
Rent to Value Ratio

Active
$7,000,000
4
bds
|
5
ba
|
5,649
sqft
|
built
2007
24608 Clearwater Run, San Antonio, TX 78255
$-34,657
Cash flow
-25.8%
Cash-on-Cash Return
0.3%
Cap rate
0.1%
Rent to Value Ratio
Active
$290,000
3
bds
|
2
ba
|
1,690
sqft
|
built
1970
2830 Christian Dr, San Antonio, TX 78222
$-734
Cash flow
-13.2%
Cash-on-Cash Return
3.2%
Cap rate
0.6%
Rent to Value Ratio
Active
$133,500
2
bds
|
1
ba
|
1,144
sqft
|
built
1918
1139 W Mulberry Ave, San Antonio, TX 78201
$-291
Cash flow
-11.4%
Cash-on-Cash Return
3.6%
Cap rate
0.9%
Rent to Value Ratio
Active
$385,000
3
bds
|
2
ba
|
3,456
sqft
|
built
1949
539 E Pyron Ave, San Antonio, TX 78214
$-1,732
Cash flow
-23.5%
Cash-on-Cash Return
0.9%
Cap rate
0.3%
Rent to Value Ratio
Active
$314,899
3
bds
|
3
ba
|
2,388
sqft
|
built
2018
7922 Bearcat Fld, San Antonio, TX 78253
$-264
Cash flow
-4.4%
Cash-on-Cash Return
5.3%
Cap rate
0.6%
Rent to Value Ratio

Active
$310,000
3
bds
|
3
ba
|
2,241
sqft
|
built
2019
12134 Jimmer Cv, San Antonio, TX 78221
$-731
Cash flow
-12.3%
Cash-on-Cash Return
3.4%
Cap rate
0.7%
Rent to Value Ratio
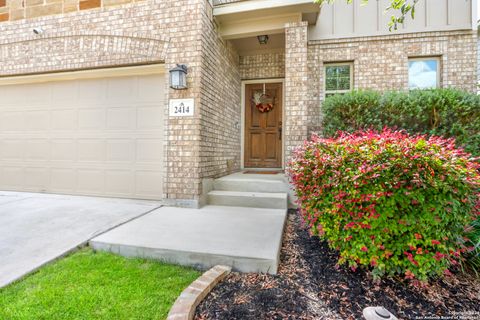
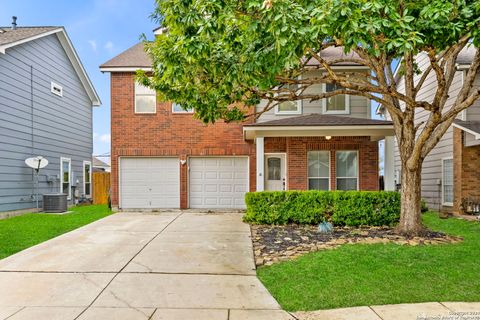
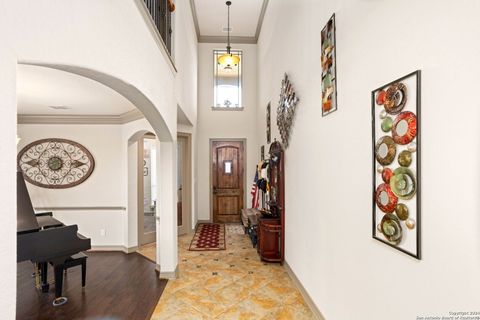
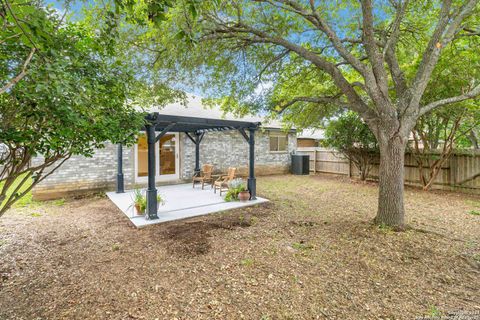
Active
$355,000
4
bds
|
3
ba
|
2,551
sqft
|
built
2018
2414 Valencia Crst, San Antonio, TX 78245
$-1,214
Cash flow
-17.8%
Cash-on-Cash Return
2.2%
Cap rate
0.7%
Rent to Value Ratio

Active
$284,000
2
bds
|
2
ba
|
974
sqft
|
built
1966
7711 Broadway, San Antonio, TX 78209
$-1,098
Cash flow
-20.2%
Cash-on-Cash Return
1.6%
Cap rate
0.7%
Rent to Value Ratio
Active
$310,800
3
bds
|
3
ba
|
2,219
sqft
|
built
1999
13851 Griffin Ridge Dr, San Antonio, TX 78247
$-798
Cash flow
-13.4%
Cash-on-Cash Return
3.2%
Cap rate
0.7%
Rent to Value Ratio

Active
$235,000
2
bds
|
2
ba
|
1,080
sqft
|
built
1920
222 Douglas Way St, San Antonio, TX 78210
$-590
Cash flow
-13.1%
Cash-on-Cash Return
3.3%
Cap rate
0.7%
Rent to Value Ratio
Active
$674,624
5
bds
|
4
ba
|
3,728
sqft
|
built
2010
1007 Boulder Cyn, San Antonio, TX 78260
$-2,071
Cash flow
-16.0%
Cash-on-Cash Return
2.6%
Cap rate
0.5%
Rent to Value Ratio
Active
$205,000
3
bds
|
2
ba
|
1,224
sqft
|
built
2003
430 S Acme Rd, San Antonio, TX 78237
$-208
Cash flow
-5.3%
Cash-on-Cash Return
5.0%
Cap rate
0.8%
Rent to Value Ratio

Active
$245,000
3
bds
|
3
ba
|
1,884
sqft
|
built
2003
710 Pinafore St, San Antonio, TX 78253
$-494
Cash flow
-10.5%
Cash-on-Cash Return
3.8%
Cap rate
0.7%
Rent to Value Ratio
Active
$327,000
3
bds
|
2
ba
|
2,176
sqft
|
built
1995
13115 Regency Bnd, San Antonio, TX 78249
$-809
Cash flow
-12.9%
Cash-on-Cash Return
3.3%
Cap rate
0.7%
Rent to Value Ratio
Active
$225,000
3
bds
|
1
ba
|
1,377
sqft
|
built
1928
1406 Hicks Ave, San Antonio, TX 78210
$-487
Cash flow
-11.3%
Cash-on-Cash Return
3.7%
Cap rate
0.7%
Rent to Value Ratio

Active
$399,000
3
bds
|
4
ba
|
1,767
sqft
|
built
2021
131 Cloudhaven Dr, San Antonio, TX 78209
$-1,205
Cash flow
-15.8%
Cash-on-Cash Return
2.6%
Cap rate
0.6%
Rent to Value Ratio
Active
$135,000
3
bds
|
2
ba
|
1,632
sqft
|
built
1945
3927 W Travis St, San Antonio, TX 78207
$-10
Cash flow
-0.4%
Cash-on-Cash Return
6.2%
Cap rate
1.2%
Rent to Value Ratio
Active
$159,000
3
bds
|
2
ba
|
786
sqft
|
built
1947
1830 Gorman, San Antonio, TX 78202
$-214
Cash flow
-7.0%
Cash-on-Cash Return
4.6%
Cap rate
0.9%
Rent to Value Ratio

Active
$273,000
3
bds
|
2
ba
|
2,011
sqft
|
built
1993
9634 Alisa Brooke, San Antonio, TX 78254
$-603
Cash flow
-11.5%
Cash-on-Cash Return
3.6%
Cap rate
0.7%
Rent to Value Ratio
Active
$320,000
5
bds
|
3
ba
|
2,544
sqft
|
built
2015
11668 Hidden Ter, San Antonio, TX 78245
$-685
Cash flow
-11.2%
Cash-on-Cash Return
3.7%
Cap rate
0.7%
Rent to Value Ratio
Active
$235,000
3
bds
|
2
ba
|
2,014
sqft
|
built
1974
7711 Callaghan Rd, San Antonio, TX 78229
$-815
Cash flow
-18.1%
Cash-on-Cash Return
2.1%
Cap rate
0.9%
Rent to Value Ratio

Active
$399,000
3
bds
|
3
ba
|
2,299
sqft
|
built
1976
4001 N New Braunfels Ave, San Antonio, TX 78209
$-3,195
Cash flow
-41.8%
Cash-on-Cash Return
-3.3%
Cap rate
0.9%
Rent to Value Ratio
Active
$399,000
6
bds
|
0
ba
|
2,172
sqft
|
built
1935
1633 W Woodlawn Ave, San Antonio, TX 78201
$-1,652
Cash flow
-21.6%
Cash-on-Cash Return
1.3%
Cap rate
0.3%
Rent to Value Ratio
Active
$225,000
3
bds
|
1
ba
|
1,168
sqft
|
built
1952
411 W Hart Ave, San Antonio, TX 78214
$-405
Cash flow
-9.4%
Cash-on-Cash Return
4.1%
Cap rate
0.7%
Rent to Value Ratio