San Antonio, TX Investment Properties for Sale
Browse homes for sale and investment properties in San Antonio, TX. Refine your search by price, property type, or more.
Best cash flowing properties in San Antonio, TX

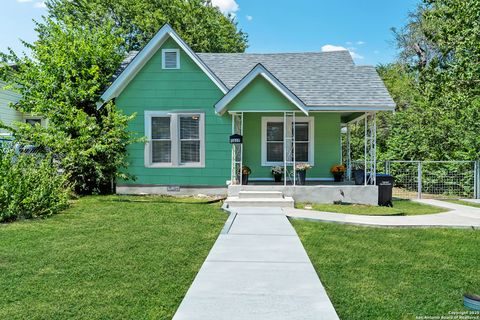
Active
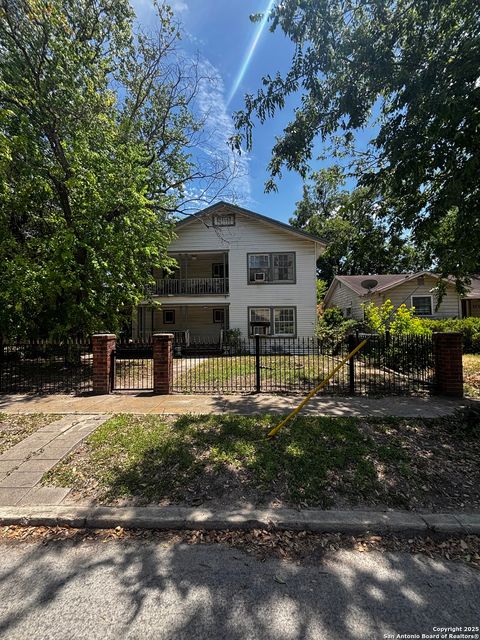
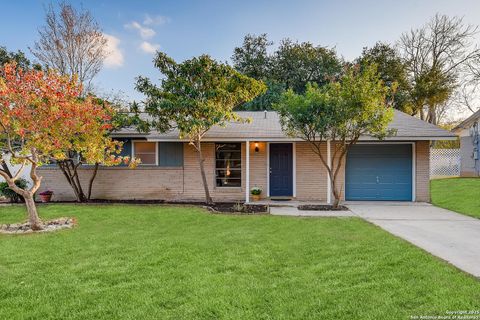
$96,000
3
bds
|
2
ba
|
1,506
sqft
|
built
1963
910 Green St, San Antonio, TX 78225
$407
Cash flow
22.1%
Cash-on-Cash Return
10.8%
Cap rate
1.6%
Rent to Value Ratio
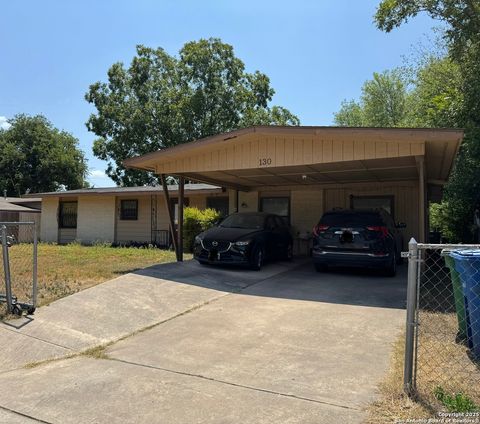
Active
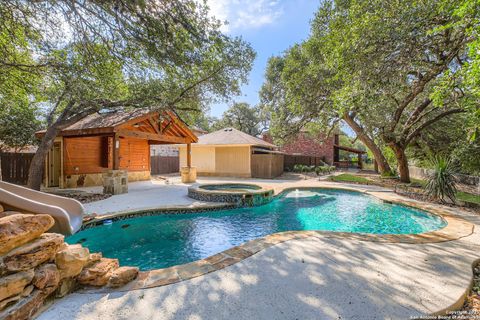
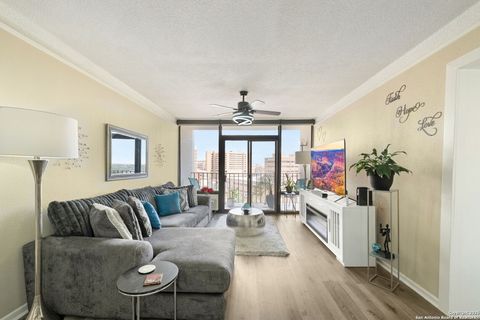
$135,000
4
bds
|
2
ba
|
1,261
sqft
|
built
1961
130 Kontiki Pl, San Antonio, TX 78242
$5
Cash flow
0.2%
Cash-on-Cash Return
5.7%
Cap rate
1.0%
Rent to Value Ratio
3,306 out of 3,623 properties for sale in San Antonio, TX
Limited Results Shown
Create a free account, or log in to reveal all property listings and enjoy the complete experience.

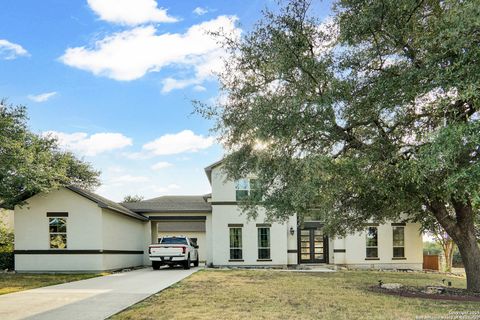
Active
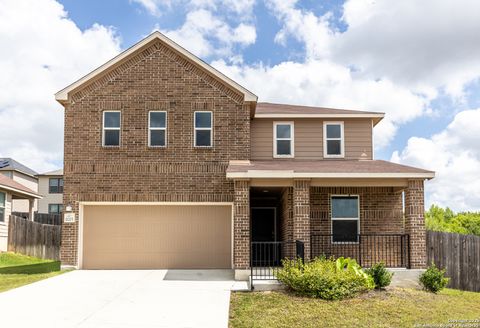
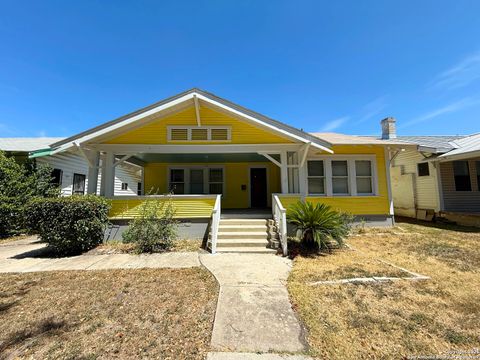
$995,000
2
bds
|
3
ba
|
1,765
sqft
|
built
2020
123 Lexington Ave, San Antonio, TX 78205
$-5,191
Cash flow
-27.2%
Cash-on-Cash Return
-0.6%
Cap rate
0.5%
Rent to Value Ratio
Active
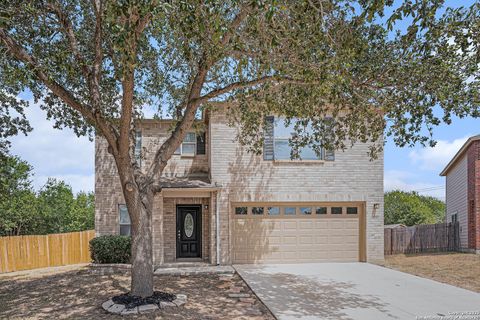
$175,000
2
bds
|
1
ba
|
954
sqft
|
built
1926
1619 W Ridgewood Ct, San Antonio, TX 78201
$-323
Cash flow
-9.6%
Cash-on-Cash Return
3.5%
Cap rate
0.7%
Rent to Value Ratio
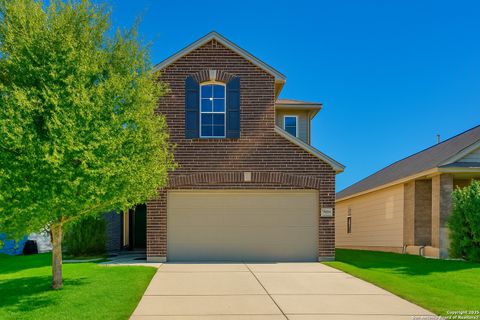
Active
$259,000
3
bds
|
2
ba
|
1,404
sqft
|
built
2013
6507 Luckey Sq, San Antonio, TX 78252
$-550
Cash flow
-11.1%
Cash-on-Cash Return
3.1%
Cap rate
0.6%
Rent to Value Ratio
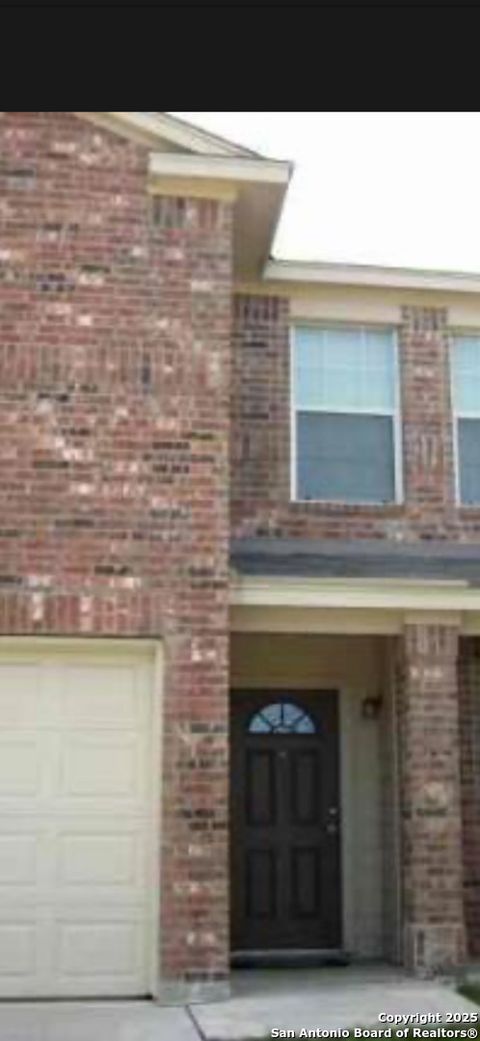
Active
$219,500
3
bds
|
2
ba
|
1,296
sqft
|
built
1983
504 Saddlebrook Dr, San Antonio, TX 78245
$-339
Cash flow
-8.1%
Cash-on-Cash Return
3.8%
Cap rate
0.7%
Rent to Value Ratio
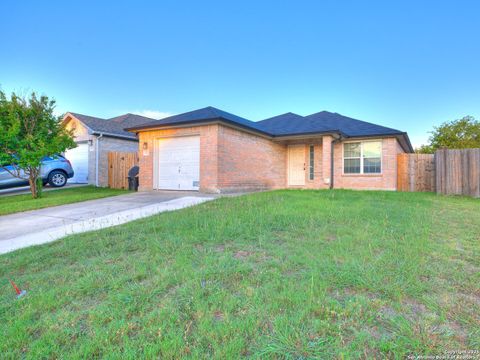
Active
$489,900
4
bds
|
4
ba
|
2,136
sqft
|
built
1920
1104 W Mistletoe Ave, San Antonio, TX 78201
$-1,541
Cash flow
-16.4%
Cash-on-Cash Return
1.9%
Cap rate
0.5%
Rent to Value Ratio
Active
$350,000
3
bds
|
2
ba
|
2,216
sqft
|
built
2014
8954 Highland Star, San Antonio, TX 78254
$-721
Cash flow
-10.7%
Cash-on-Cash Return
3.2%
Cap rate
0.6%
Rent to Value Ratio
Active
$300,000
3
bds
|
2
ba
|
1,662
sqft
|
built
2021
13019 Minuet Sway, San Antonio, TX 78252
$-733
Cash flow
-12.7%
Cash-on-Cash Return
2.7%
Cap rate
0.6%
Rent to Value Ratio

Active
$799,900
4
bds
|
3
ba
|
4,880
sqft
|
built
1990
2943 Kingsford Ln, San Antonio, TX 78259
$-2,850
Cash flow
-18.6%
Cash-on-Cash Return
1.4%
Cap rate
0.4%
Rent to Value Ratio

Active
$174,500
3
bds
|
3
ba
|
1,501
sqft
|
built
1998
5506 Summer Fest Dr, San Antonio, TX 78244
$-141
Cash flow
-4.2%
Cash-on-Cash Return
4.7%
Cap rate
0.9%
Rent to Value Ratio
Active
$225,000
2
bds
|
3
ba
|
1,649
sqft
|
built
1976
3103 Eisenhauer Rd, San Antonio, TX 78209
$-346
Cash flow
-8.0%
Cash-on-Cash Return
3.8%
Cap rate
1.1%
Rent to Value Ratio
Active
$235,000
2
bds
|
2
ba
|
1,160
sqft
|
built
1983
4212 Medical Dr, San Antonio, TX 78229
$-766
Cash flow
-17.0%
Cash-on-Cash Return
1.8%
Cap rate
0.7%
Rent to Value Ratio
Active
$899,000
4
bds
|
4
ba
|
2,698
sqft
|
built
2023
756 Spacious Sky, San Antonio, TX 78260
$-546
Cash flow
-3.2%
Cash-on-Cash Return
4.9%
Cap rate
0.6%
Rent to Value Ratio

Active
$224,500
3
bds
|
2
ba
|
1,209
sqft
|
built
1992
321 S Olive St, San Antonio, TX 78203
$-300
Cash flow
-7.0%
Cash-on-Cash Return
4.1%
Cap rate
0.7%
Rent to Value Ratio
Active
$148,000
2
bds
|
2
ba
|
1,079
sqft
|
built
1988
14343 Judson Rd, San Antonio, TX 78233
$-532
Cash flow
-18.8%
Cash-on-Cash Return
1.4%
Cap rate
0.9%
Rent to Value Ratio

Active
$165,000
3
bds
|
1
ba
|
1,409
sqft
|
built
1927
559 W Highland Blvd, San Antonio, TX 78210
$-134
Cash flow
-4.2%
Cash-on-Cash Return
4.7%
Cap rate
1.2%
Rent to Value Ratio
Active
$279,900
4
bds
|
3
ba
|
2,438
sqft
|
built
2007
9715 Woodland Pnes, San Antonio, TX 78254
$-389
Cash flow
-7.3%
Cash-on-Cash Return
4.0%
Cap rate
0.7%
Rent to Value Ratio

Active
$283,000
4
bds
|
3
ba
|
2,245
sqft
|
built
2017
3123 Mission Gate, San Antonio, TX 78224
$-581
Cash flow
-10.7%
Cash-on-Cash Return
3.2%
Cap rate
0.7%
Rent to Value Ratio
Active
$225,000
2
bds
|
2
ba
|
2,642
sqft
|
built
1930
202 Benita St, San Antonio, TX 78210
$-99
Cash flow
-2.3%
Cash-on-Cash Return
5.2%
Cap rate
0.6%
Rent to Value Ratio
Active
$550,000
5
bds
|
4
ba
|
3,714
sqft
|
built
1991
3310 Carbine Rd, San Antonio, TX 78247
$-1,522
Cash flow
-14.4%
Cash-on-Cash Return
2.4%
Cap rate
0.6%
Rent to Value Ratio
Active
$324,900
3
bds
|
3
ba
|
2,459
sqft
|
built
2021
11205 Plaudit, San Antonio, TX 78245
$-622
Cash flow
-10.0%
Cash-on-Cash Return
3.4%
Cap rate
0.7%
Rent to Value Ratio

Active
$592,900
4
bds
|
3
ba
|
3,491
sqft
|
built
1996
3919 Creek Frst, San Antonio, TX 78230
$-1,537
Cash flow
-13.5%
Cash-on-Cash Return
2.6%
Cap rate
0.5%
Rent to Value Ratio
Active
$254,900
3
bds
|
3
ba
|
2,859
sqft
|
built
2007
5003 Green Post, San Antonio, TX 78223
$-149
Cash flow
-3.0%
Cash-on-Cash Return
5.0%
Cap rate
0.9%
Rent to Value Ratio
Active
$249,000
2
bds
|
2
ba
|
1,312
sqft
|
built
1976
13823 Brays Frst, San Antonio, TX 78217
$-376
Cash flow
-7.9%
Cash-on-Cash Return
3.9%
Cap rate
0.7%
Rent to Value Ratio
Active
$240,000
3
bds
|
2
ba
|
1,428
sqft
|
built
2016
4424 Donley Byu, San Antonio, TX 78245
$-379
Cash flow
-8.2%
Cash-on-Cash Return
3.8%
Cap rate
0.7%
Rent to Value Ratio
Active
$269,900
4
bds
|
2
ba
|
1,714
sqft
|
built
2002
9842 Charline Ln, San Antonio, TX 78254
$-544
Cash flow
-10.5%
Cash-on-Cash Return
3.3%
Cap rate
0.7%
Rent to Value Ratio
Active
$480,000
4
bds
|
4
ba
|
2,804
sqft
|
built
2004
18838 Rogers Pass, San Antonio, TX 78258
$-1,196
Cash flow
-13.0%
Cash-on-Cash Return
2.7%
Cap rate
0.6%
Rent to Value Ratio

Active
$249,000
3
bds
|
2
ba
|
1,232
sqft
|
built
1920
517 S Pine St, San Antonio, TX 78203
$-334
Cash flow
-7.0%
Cash-on-Cash Return
4.1%
Cap rate
0.8%
Rent to Value Ratio

Active
$305,000
3
bds
|
1
ba
|
1,104
sqft
|
built
1946
146 El Monte Blvd, San Antonio, TX 78212
$-743
Cash flow
-12.7%
Cash-on-Cash Return
2.8%
Cap rate
0.6%
Rent to Value Ratio
Active
$880,000
5
bds
|
4
ba
|
4,708
sqft
|
built
2013
28007 Cascabel Ln, San Antonio, TX 78260
$-2,130
Cash flow
-12.6%
Cash-on-Cash Return
2.8%
Cap rate
0.6%
Rent to Value Ratio

Active
$230,000
4
bds
|
2
ba
|
1,946
sqft
|
built
2021
9618 Pleasanton Ash, San Antonio, TX 78221
$-270
Cash flow
-6.1%
Cash-on-Cash Return
4.3%
Cap rate
0.9%
Rent to Value Ratio
Active
$284,000
4
bds
|
3
ba
|
1,847
sqft
|
built
2020
918 Lambshead Draw, San Antonio, TX 78245
$-483
Cash flow
-8.9%
Cash-on-Cash Return
3.6%
Cap rate
0.7%
Rent to Value Ratio
Active
$379,000
5
bds
|
4
ba
|
2,961
sqft
|
built
2006
3763 Browning Blf, San Antonio, TX 78245
$-790
Cash flow
-10.9%
Cash-on-Cash Return
3.2%
Cap rate
0.6%
Rent to Value Ratio

Active
$274,999
3
bds
|
2
ba
|
1,036
sqft
|
built
1924
231 Spruce St, San Antonio, TX 78203
$-575
Cash flow
-10.9%
Cash-on-Cash Return
3.2%
Cap rate
0.7%
Rent to Value Ratio
Active
$179,000
3
bds
|
1
ba
|
1,249
sqft
|
built
2003
4033 Salty Marsh, San Antonio, TX 78245
$-86
Cash flow
-2.5%
Cash-on-Cash Return
5.1%
Cap rate
0.9%
Rent to Value Ratio

Active
$365,000
4
bds
|
3
ba
|
2,764
sqft
|
built
1945
166 E Harding Blvd, San Antonio, TX 78214
$-693
Cash flow
-9.9%
Cash-on-Cash Return
3.4%
Cap rate
0.7%
Rent to Value Ratio
Active
$239,999
3
bds
|
2
ba
|
1,065
sqft
|
built
1961
918 Cerro Alto Dr, San Antonio, TX 78213
$-344
Cash flow
-7.5%
Cash-on-Cash Return
4.0%
Cap rate
0.7%
Rent to Value Ratio
Active
$186,000
2
bds
|
2
ba
|
1,206
sqft
|
built
1982
7701 Wurzbach Rd, San Antonio, TX 78229
$-946
Cash flow
-26.5%
Cash-on-Cash Return
-0.4%
Cap rate
1.0%
Rent to Value Ratio
Active
$235,000
3
bds
|
1
ba
|
1,708
sqft
|
built
1940
555 Cincinnati Ave, San Antonio, TX 78201
$-442
Cash flow
-9.8%
Cash-on-Cash Return
3.4%
Cap rate
0.7%
Rent to Value Ratio