San Antonio, TX Investment Properties for Sale
Browse homes for sale and investment properties in San Antonio, TX. Refine your search by price, property type, or more.
Best cash flowing properties in San Antonio, TX
Active
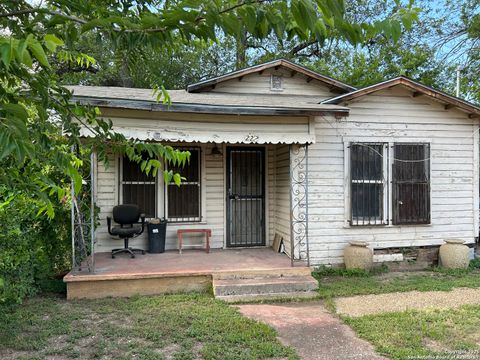
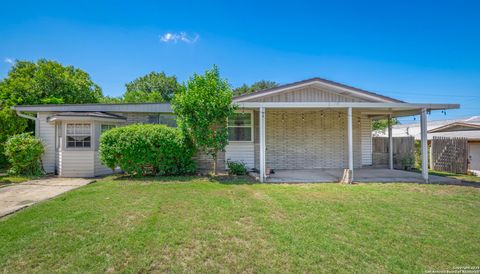
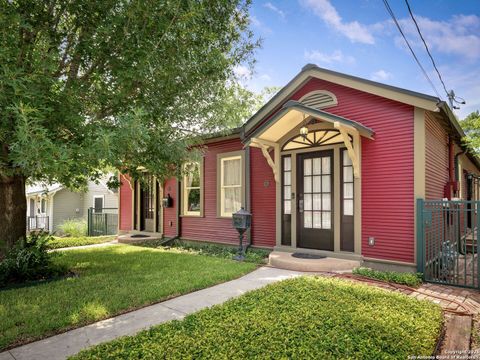
$65,000
2
bds
|
1
ba
|
696
sqft
|
built
1954
227 Noria St, San Antonio, TX 78207
$617
Cash flow
11.1%
Cash-on-Cash Return
11.4%
Cap rate
1.7%
Rent to Value Ratio
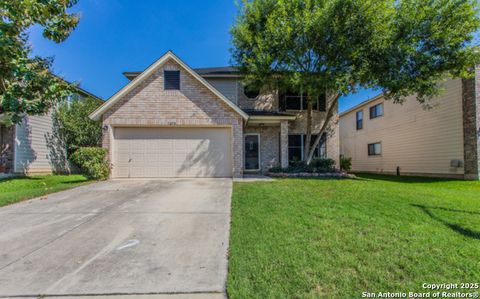
Active
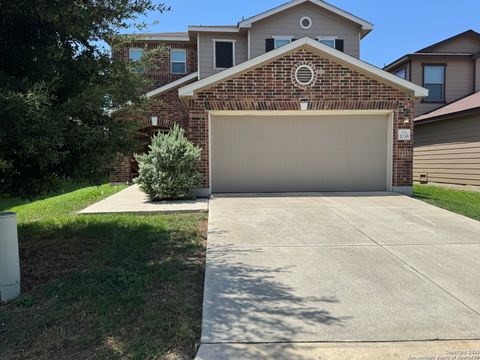
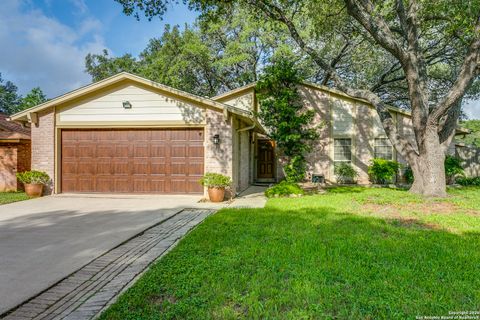
$199,000
3
bds
|
2
ba
|
2,096
sqft
|
built
2001
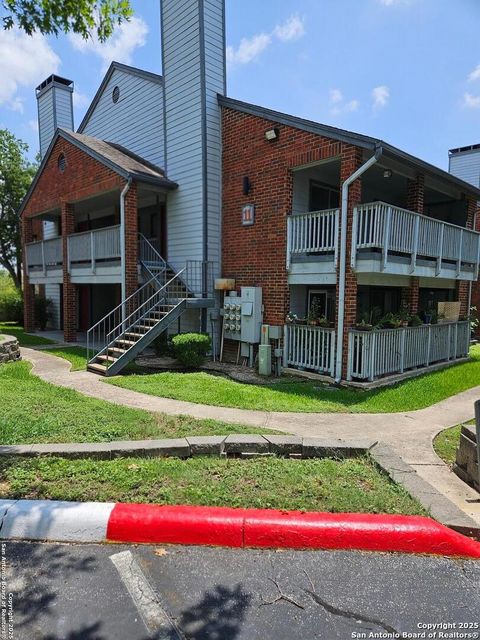
7254 Ruby Palm Pass, San Antonio, TX 78218
$-248
Cash flow
-6.5%
Cash-on-Cash Return
4.8%
Cap rate
0.9%
Rent to Value Ratio
6,106 out of 6,402 properties for sale in San Antonio, TX
Limited Results Shown
Create a free account, or log in to reveal all property listings and enjoy the complete experience.
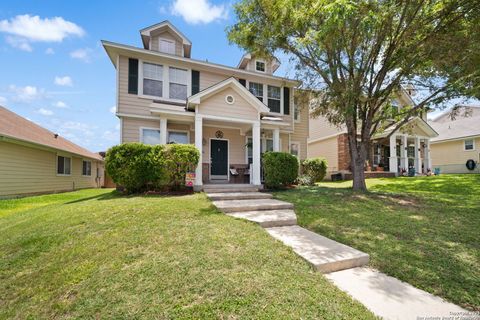
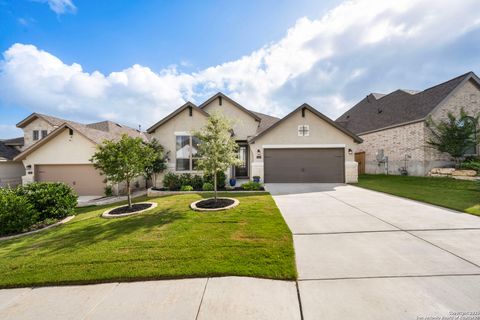
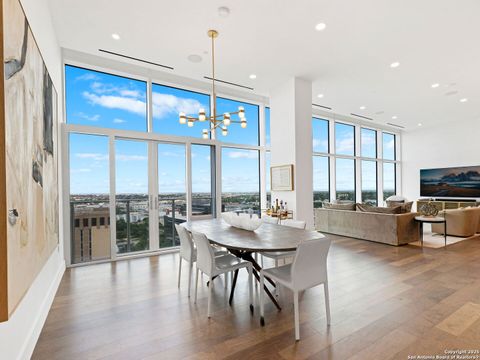
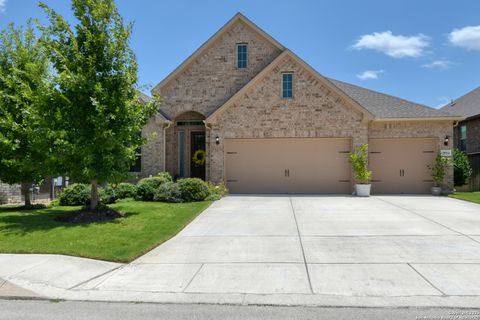
Active
$285,000
4
bds
|
3
ba
|
2,229
sqft
|
built
2005
9606 Wild Horse Run, San Antonio, TX 78251
$-820
Cash flow
-15.0%
Cash-on-Cash Return
2.8%
Cap rate
0.6%
Rent to Value Ratio
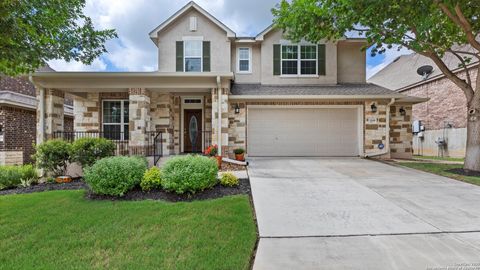
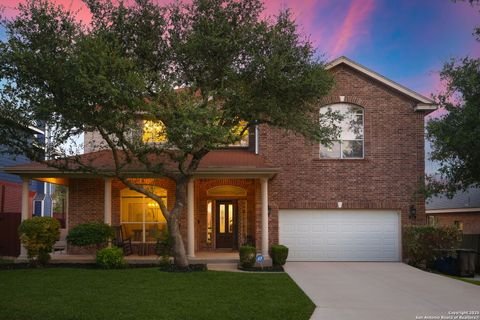
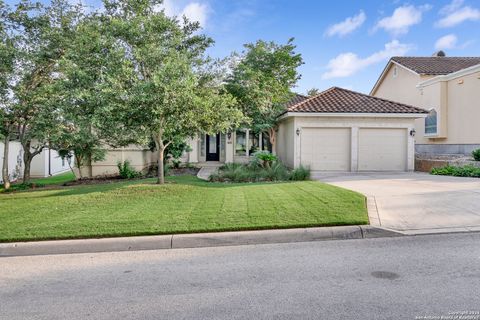
Active
$485,000
4
bds
|
4
ba
|
2,785
sqft
|
built
2014
12618 Ozona Rnch, San Antonio, TX 78245
$-1,500
Cash flow
-16.1%
Cash-on-Cash Return
2.6%
Cap rate
0.5%
Rent to Value Ratio
Active
$596,000
4
bds
|
3
ba
|
2,563
sqft
|
built
2021
1159 Cadogan Squire, San Antonio, TX 78260
$-1,853
Cash flow
-16.2%
Cash-on-Cash Return
2.5%
Cap rate
0.5%
Rent to Value Ratio
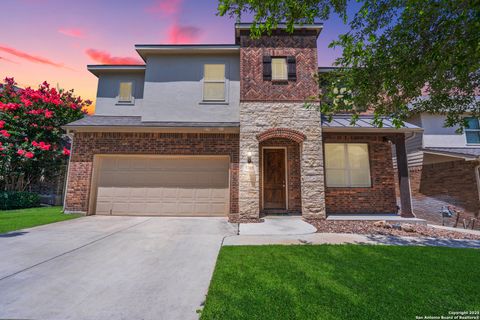
Active
$315,000
3
bds
|
3
ba
|
1,641
sqft
|
built
1997
3419 Tumblewood Trl, San Antonio, TX 78247
$-864
Cash flow
-14.3%
Cash-on-Cash Return
3.0%
Cap rate
0.6%
Rent to Value Ratio
Active
$299,990
3
bds
|
2
ba
|
1,751
sqft
|
built
2011
451 Tequila Rnch, San Antonio, TX 78245
$-736
Cash flow
-12.8%
Cash-on-Cash Return
3.3%
Cap rate
0.7%
Rent to Value Ratio
Active
$359,900
4
bds
|
4
ba
|
2,694
sqft
|
built
2013
14503 Prairie Pass, San Antonio, TX 78254
$-888
Cash flow
-12.9%
Cash-on-Cash Return
3.3%
Cap rate
0.7%
Rent to Value Ratio
Active
$600,000
5
bds
|
4
ba
|
3,651
sqft
|
built
2015
5315 Saffron Rose, San Antonio, TX 78253
$-1,970
Cash flow
-17.1%
Cash-on-Cash Return
2.3%
Cap rate
0.5%
Rent to Value Ratio
Active
$199,000
3
bds
|
2
ba
|
2,096
sqft
|
built
2001
7254 Ruby Palm Pass, San Antonio, TX 78218
$-248
Cash flow
-6.5%
Cash-on-Cash Return
4.8%
Cap rate
0.9%
Rent to Value Ratio
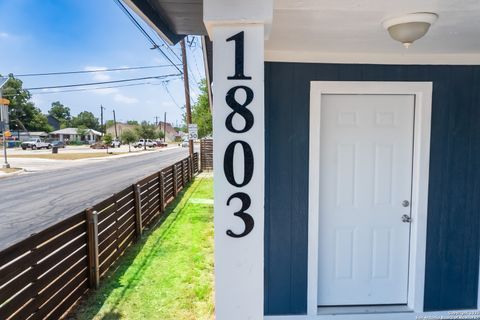
Active
$299,995
4
bds
|
2
ba
|
1,668
sqft
|
built
1950
1803 Burnet St, San Antonio, TX 78202
$-823
Cash flow
-14.3%
Cash-on-Cash Return
3.0%
Cap rate
0.5%
Rent to Value Ratio
Active
$225,000
3
bds
|
2
ba
|
1,135
sqft
|
built
1969
10803 Edgecrest Dr, San Antonio, TX 78217
$-495
Cash flow
-11.5%
Cash-on-Cash Return
3.6%
Cap rate
0.7%
Rent to Value Ratio
Active
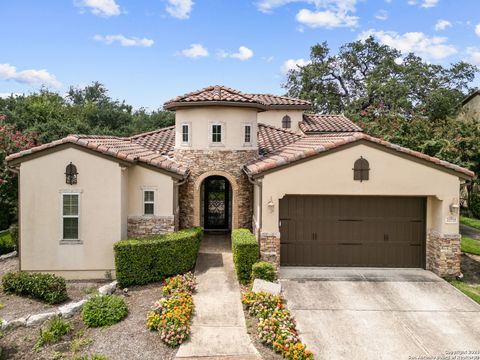
$585,000
4
bds
|
5
ba
|
3,019
sqft
|
built
2012
25910 Trickling Rock, San Antonio, TX 78260
$-1,586
Cash flow
-14.1%
Cash-on-Cash Return
3.0%
Cap rate
0.6%
Rent to Value Ratio
Active
$939,000
4
bds
|
4
ba
|
4,179
sqft
|
built
1993
17118 Eagle Star, San Antonio, TX 78248
$-2,764
Cash flow
-15.4%
Cash-on-Cash Return
2.7%
Cap rate
0.6%
Rent to Value Ratio
Active
$245,000
3
bds
|
2
ba
|
1,532
sqft
|
built
2019
6314 Hibiscus Fls, San Antonio, TX 78218
$-517
Cash flow
-11.0%
Cash-on-Cash Return
3.7%
Cap rate
0.7%
Rent to Value Ratio
Active
$339,900
5
bds
|
4
ba
|
2,687
sqft
|
built
2018
15530 Gray Catbird, San Antonio, TX 78253
$-848
Cash flow
-13.0%
Cash-on-Cash Return
3.3%
Cap rate
0.6%
Rent to Value Ratio
Active
$309,999
4
bds
|
3
ba
|
2,304
sqft
|
built
2018
11914 Silver Sails, San Antonio, TX 78254
$-620
Cash flow
-10.4%
Cash-on-Cash Return
3.9%
Cap rate
0.7%
Rent to Value Ratio
Active
$699,900
3
bds
|
3
ba
|
2,500
sqft
|
built
2008
22715 Colibries, San Antonio, TX 78261
$-2,725
Cash flow
-20.3%
Cash-on-Cash Return
1.6%
Cap rate
0.6%
Rent to Value Ratio
Active
$279,900
3
bds
|
2
ba
|
1,635
sqft
|
built
2020
952 Brown Thrasher, San Antonio, TX 78253
$-691
Cash flow
-12.9%
Cash-on-Cash Return
3.3%
Cap rate
0.6%
Rent to Value Ratio
Active
$655,000
4
bds
|
8
ba
|
3,322
sqft
|
built
2007
21811 Chaucer Hl, San Antonio, TX 78256
$-2,228
Cash flow
-17.7%
Cash-on-Cash Return
2.2%
Cap rate
0.5%
Rent to Value Ratio
Active
$65,000
2
bds
|
1
ba
|
696
sqft
|
built
1954
227 Noria St, San Antonio, TX 78207
$617
Cash flow
11.1%
Cash-on-Cash Return
11.4%
Cap rate
1.7%
Rent to Value Ratio
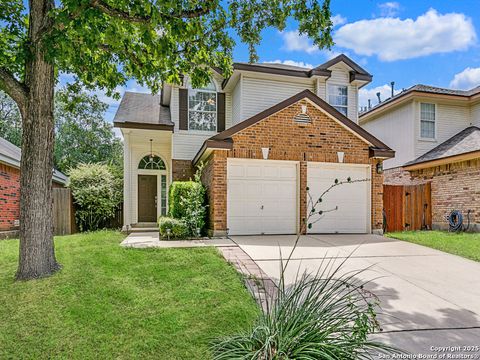
Active
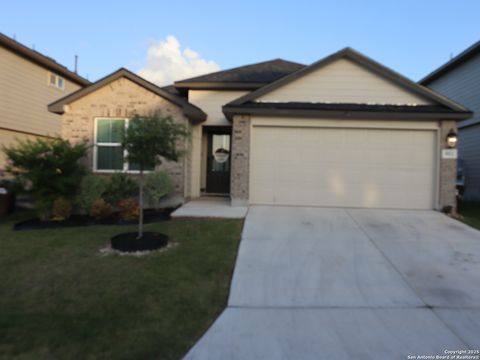
$269,000
3
bds
|
2
ba
|
1,520
sqft
|
built
1995
8810 Sebec Cir, San Antonio, TX 78250
$-696
Cash flow
-13.5%
Cash-on-Cash Return
3.2%
Cap rate
0.6%
Rent to Value Ratio
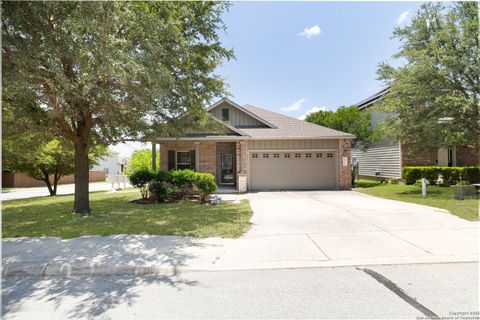
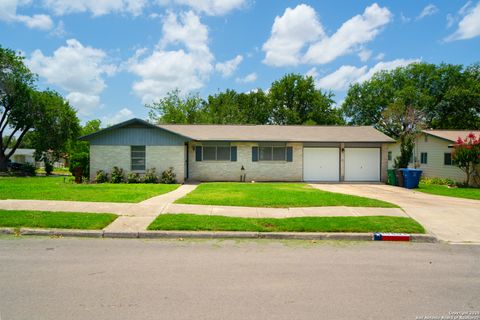
Active
$275,000
3
bds
|
2
ba
|
1,812
sqft
|
built
1956
4342 Eisenhauer Rd, San Antonio, TX 78218
$-787
Cash flow
-14.9%
Cash-on-Cash Return
2.8%
Cap rate
0.6%
Rent to Value Ratio
Active
$250,000
3
bds
|
3
ba
|
1,773
sqft
|
built
2018
1038 Loma Mesa, San Antonio, TX 78214
$-459
Cash flow
-9.6%
Cash-on-Cash Return
4.1%
Cap rate
0.7%
Rent to Value Ratio
Active
$2,250,000
3
bds
|
4
ba
|
2,848
sqft
|
built
2020
123 Lexington Ave, San Antonio, TX 78205
$-12,678
Cash flow
-29.4%
Cash-on-Cash Return
-0.5%
Cap rate
0.4%
Rent to Value Ratio
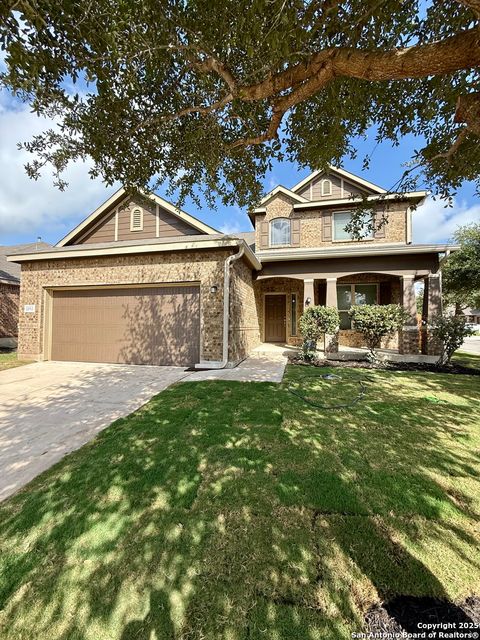
Active
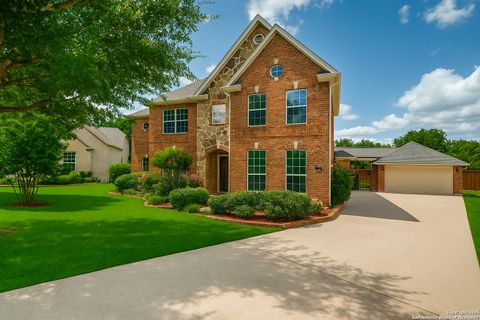
$499,999
5
bds
|
3
ba
|
3,287
sqft
|
built
2005
414 Nueces Spg, San Antonio, TX 78258
$-1,443
Cash flow
-15.1%
Cash-on-Cash Return
2.8%
Cap rate
0.6%
Rent to Value Ratio
Active
$259,900
3
bds
|
2
ba
|
1,615
sqft
|
built
2009
5715 Sendero Spg, San Antonio, TX 78251
$-675
Cash flow
-13.6%
Cash-on-Cash Return
3.1%
Cap rate
0.7%
Rent to Value Ratio
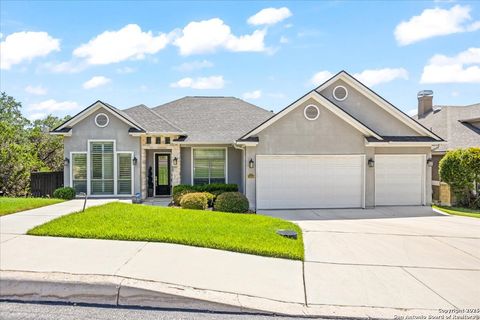
Active
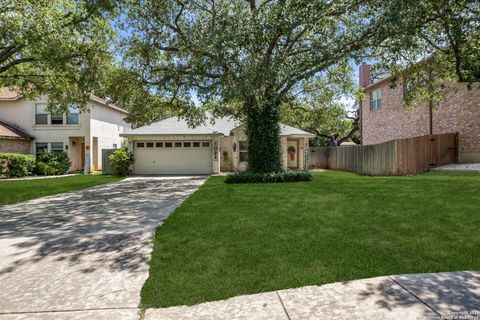
$495,000
4
bds
|
3
ba
|
2,879
sqft
|
built
2000
18310 Redwood Path, San Antonio, TX 78259
$-1,627
Cash flow
-17.1%
Cash-on-Cash Return
2.3%
Cap rate
0.6%
Rent to Value Ratio
Active
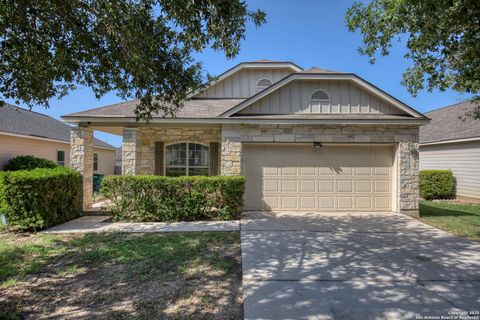
$450,000
5
bds
|
3
ba
|
2,751
sqft
|
built
2003
4763 Bending Grv, San Antonio, TX 78259
$-1,286
Cash flow
-14.9%
Cash-on-Cash Return
2.8%
Cap rate
0.6%
Rent to Value Ratio
Active
$273,000
3
bds
|
2
ba
|
1,446
sqft
|
built
1986
9219 Perkins Dr, San Antonio, TX 78240
$-744
Cash flow
-14.2%
Cash-on-Cash Return
3.0%
Cap rate
0.7%
Rent to Value Ratio
Active
$164,900
2
bds
|
2
ba
|
914
sqft
|
built
1988
14343 Judson Rd, San Antonio, TX 78233
$-729
Cash flow
-23.1%
Cash-on-Cash Return
1.0%
Cap rate
0.7%
Rent to Value Ratio
Active
$290,000
4
bds
|
0
ba
|
1,832
sqft
|
built
1982
5224 Meadow Rise St, San Antonio, TX 78250
$-1,132
Cash flow
-20.4%
Cash-on-Cash Return
1.6%
Cap rate
0.4%
Rent to Value Ratio

Active
$238,500
3
bds
|
2
ba
|
1,510
sqft
|
built
2021
10342 Gibbons Crk, San Antonio, TX 78252
$-593
Cash flow
-13.0%
Cash-on-Cash Return
3.3%
Cap rate
0.8%
Rent to Value Ratio

Active
$334,990
4
bds
|
3
ba
|
2,333
sqft
|
built
2022
4516 Appaloosa Crst, San Antonio, TX 78245
$-739
Cash flow
-11.5%
Cash-on-Cash Return
3.6%
Cap rate
0.7%
Rent to Value Ratio
Active
$525,000
4
bds
|
3
ba
|
2,432
sqft
|
built
1996
4922 Rosemoss, San Antonio, TX 78249
$-1,891
Cash flow
-18.8%
Cash-on-Cash Return
1.9%
Cap rate
0.5%
Rent to Value Ratio
Active
$270,000
3
bds
|
2
ba
|
1,866
sqft
|
built
1993
7822 Sandpiper Park Dr, San Antonio, TX 78249
$-586
Cash flow
-11.3%
Cash-on-Cash Return
3.7%
Cap rate
0.7%
Rent to Value Ratio
Active
$695,000
2
bds
|
3
ba
|
2,141
sqft
|
built
1928
520 E Mulberry Ave, San Antonio, TX 78212
$-3,621
Cash flow
-27.2%
Cash-on-Cash Return
0.0%
Cap rate
0.2%
Rent to Value Ratio
Active
$378,500
3
bds
|
2
ba
|
1,566
sqft
|
built
1977
1406 Aylsbury Dr, San Antonio, TX 78216
$-1,155
Cash flow
-15.9%
Cash-on-Cash Return
2.6%
Cap rate
0.5%
Rent to Value Ratio
Active
$587,000
3
bds
|
3
ba
|
2,705
sqft
|
built
2019
28914 Throssel Ln, San Antonio, TX 78260
$-1,869
Cash flow
-16.6%
Cash-on-Cash Return
2.4%
Cap rate
0.5%
Rent to Value Ratio
Active
$649,900
3
bds
|
3
ba
|
2,792
sqft
|
built
2004
110 Lantana Way, San Antonio, TX 78258
$-1,800
Cash flow
-14.5%
Cash-on-Cash Return
2.9%
Cap rate
0.7%
Rent to Value Ratio
Active
$3,450,000
6
bds
|
8
ba
|
5,910
sqft
|
built
2021
211 Wellesley Hl, San Antonio, TX 78231
$-16,574
Cash flow
-25.1%
Cash-on-Cash Return
0.5%
Cap rate
0.3%
Rent to Value Ratio
Active
$469,900
4
bds
|
3
ba
|
3,136
sqft
|
built
1993
14722 Forward Pass, San Antonio, TX 78248
$-1,450
Cash flow
-16.1%
Cash-on-Cash Return
2.6%
Cap rate
0.6%
Rent to Value Ratio