San Antonio, TX Investment Properties for Sale
Browse homes for sale and investment properties in San Antonio, TX. Refine your search by price, property type, or more.
Best cash flowing properties in San Antonio, TX

Active
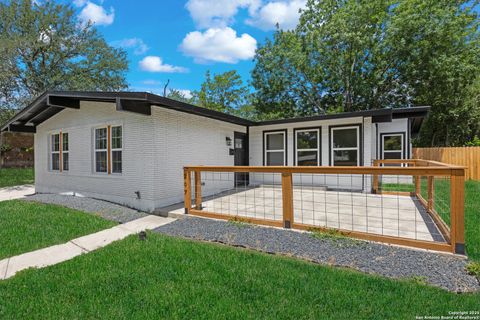
$84,000
3
bds
|
2
ba
|
1,545
sqft
|
built
1950
314 Wabash St, San Antonio, TX 78211
$390
Cash flow
24.2%
Cash-on-Cash Return
11.3%
Cap rate
1.9%
Rent to Value Ratio

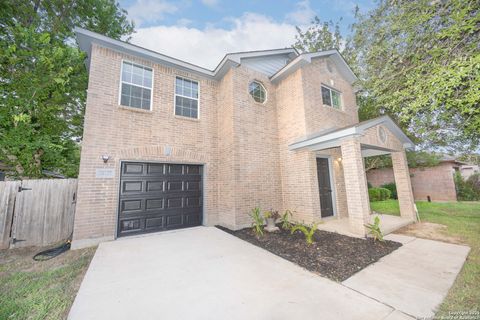
Active
$110,000
3
bds
|
2
ba
|
1,315
sqft
|
built
1970
546 Park Meadow Dr, San Antonio, TX 78227
$127
Cash flow
6.0%
Cash-on-Cash Return
7.1%
Cap rate
1.3%
Rent to Value Ratio
5,719 out of 5,997 properties for sale in San Antonio, TX
Limited Results Shown
Create a free account, or log in to reveal all property listings and enjoy the complete experience.

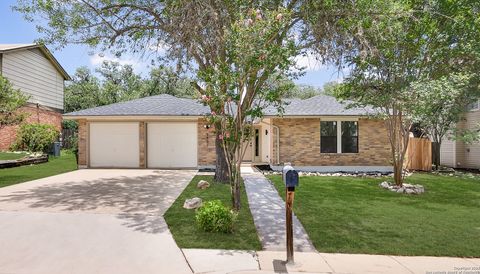
Active
$475,000
4
bds
|
3
ba
|
2,220
sqft
|
built
1932
246 Felisa St, San Antonio, TX 78210
$-1,368
Cash flow
-15.0%
Cash-on-Cash Return
2.2%
Cap rate
0.4%
Rent to Value Ratio
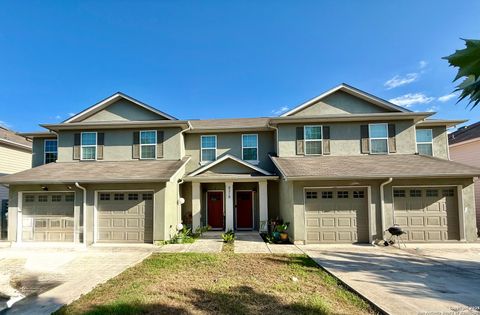
Active
$339,900
3
bds
|
2
ba
|
1,534
sqft
|
built
1957
207 Northaven Dr, San Antonio, TX 78229
$-511
Cash flow
-7.8%
Cash-on-Cash Return
3.9%
Cap rate
0.7%
Rent to Value Ratio
Active
$279,000
3
bds
|
3
ba
|
1,880
sqft
|
built
2004
10707 Shaenview, San Antonio, TX 78254
$-519
Cash flow
-9.7%
Cash-on-Cash Return
3.4%
Cap rate
0.6%
Rent to Value Ratio
Active
$272,000
3
bds
|
2
ba
|
1,491
sqft
|
built
1982
9807 Boulder Hill St, San Antonio, TX 78250
$-685
Cash flow
-13.1%
Cash-on-Cash Return
2.7%
Cap rate
0.6%
Rent to Value Ratio
Active
$734,900
12
bds
|
0
ba
|
4,872
sqft
|
built
2017
6318 Melanzane Ave, San Antonio, TX 78233
$-4,084
Cash flow
-29.0%
Cash-on-Cash Return
-1.0%
Cap rate
0.2%
Rent to Value Ratio
Active
$550,000
4
bds
|
4
ba
|
3,114
sqft
|
built
2011
726 Aucuba Fls, San Antonio, TX 78260
$-1,574
Cash flow
-14.9%
Cash-on-Cash Return
2.2%
Cap rate
0.5%
Rent to Value Ratio

Active
$245,000
3
bds
|
2
ba
|
1,300
sqft
|
built
1947
114 E Mayfield Blvd, San Antonio, TX 78214
$-332
Cash flow
-7.1%
Cash-on-Cash Return
4.1%
Cap rate
0.7%
Rent to Value Ratio

Active
$355,000
3
bds
|
2
ba
|
1,825
sqft
|
built
2011
1014 Windy Pond, San Antonio, TX 78260
$-764
Cash flow
-11.2%
Cash-on-Cash Return
3.1%
Cap rate
0.6%
Rent to Value Ratio

Active
$190,000
2
bds
|
1
ba
|
934
sqft
|
built
1928
710 W Hollywood Ave, San Antonio, TX 78212
$-228
Cash flow
-6.3%
Cash-on-Cash Return
4.2%
Cap rate
0.8%
Rent to Value Ratio

Active
$685,000
5
bds
|
5
ba
|
3,956
sqft
|
built
2019
2114 Derussy Rd, San Antonio, TX 78253
$-1,613
Cash flow
-12.3%
Cash-on-Cash Return
2.9%
Cap rate
0.6%
Rent to Value Ratio
Active
$1,449,999
5
bds
|
6
ba
|
5,397
sqft
|
built
2005
10 Kings Tower, San Antonio, TX 78257
$-4,787
Cash flow
-17.2%
Cash-on-Cash Return
1.7%
Cap rate
0.4%
Rent to Value Ratio

Active
$315,000
4
bds
|
3
ba
|
2,338
sqft
|
built
2010
10736 Gemsbuck Ldg, San Antonio, TX 78245
$-501
Cash flow
-8.3%
Cash-on-Cash Return
3.8%
Cap rate
0.7%
Rent to Value Ratio

Active
$329,000
3
bds
|
2
ba
|
1,494
sqft
|
built
2020
468 Salz Way, San Antonio, TX 78260
$-737
Cash flow
-11.7%
Cash-on-Cash Return
3.0%
Cap rate
0.6%
Rent to Value Ratio

Active
$295,000
4
bds
|
3
ba
|
2,242
sqft
|
built
2020
2006 Prometheus Cv, San Antonio, TX 78245
$-375
Cash flow
-6.6%
Cash-on-Cash Return
4.2%
Cap rate
0.7%
Rent to Value Ratio

Active
$649,999
4
bds
|
3
ba
|
2,780
sqft
|
built
2020
6827 Bella Verso, San Antonio, TX 78256
$-2,204
Cash flow
-17.7%
Cash-on-Cash Return
1.6%
Cap rate
0.5%
Rent to Value Ratio

Active
$250,000
4
bds
|
0
ba
|
2,704
sqft
|
built
1948
146 Shadwell Dr, San Antonio, TX 78228
$-725
Cash flow
-15.1%
Cash-on-Cash Return
2.2%
Cap rate
0.6%
Rent to Value Ratio

Active
$260,000
5
bds
|
3
ba
|
1,634
sqft
|
built
2018
2307 Gunsmoke, San Antonio, TX 78227
$41
Cash flow
0.8%
Cash-on-Cash Return
5.9%
Cap rate
1.0%
Rent to Value Ratio

Active
$319,900
4
bds
|
3
ba
|
2,437
sqft
|
built
2013
6763 Indian Ldg, San Antonio, TX 78253
$-551
Cash flow
-9.0%
Cash-on-Cash Return
3.6%
Cap rate
0.7%
Rent to Value Ratio

Active
$430,000
4
bds
|
3
ba
|
2,303
sqft
|
built
2020
12810 Braxon Pass, San Antonio, TX 78253
$-1,074
Cash flow
-13.0%
Cash-on-Cash Return
2.7%
Cap rate
0.6%
Rent to Value Ratio

Active
$140,000
2
bds
|
0
ba
|
576
sqft
|
built
1945
330 E Hart Ave, San Antonio, TX 78214
$-26
Cash flow
-1.0%
Cash-on-Cash Return
5.5%
Cap rate
0.9%
Rent to Value Ratio

Active
$770,000
4
bds
|
4
ba
|
3,455
sqft
|
built
2013
1410 Melanie Cir, San Antonio, TX 78258
$-2,277
Cash flow
-15.4%
Cash-on-Cash Return
2.1%
Cap rate
0.5%
Rent to Value Ratio

Active
$989,500
3
bds
|
3
ba
|
2,351
sqft
|
built
2016
139 Mount Erin Pass, San Antonio, TX 78212
$-4,154
Cash flow
-21.9%
Cash-on-Cash Return
0.6%
Cap rate
0.4%
Rent to Value Ratio

Active
$475,000
4
bds
|
0
ba
|
2,777
sqft
|
built
1980
141 E Summit Ave, San Antonio, TX 78212
$-2,110
Cash flow
-23.2%
Cash-on-Cash Return
0.3%
Cap rate
0.3%
Rent to Value Ratio
Active
$110,000
3
bds
|
2
ba
|
1,315
sqft
|
built
1970
546 Park Meadow Dr, San Antonio, TX 78227
$127
Cash flow
6.0%
Cash-on-Cash Return
7.1%
Cap rate
1.3%
Rent to Value Ratio

Pending
$300,000
4
bds
|
3
ba
|
2,361
sqft
|
built
2007
6218 Ozona Ml, San Antonio, TX 78253
$-410
Cash flow
-7.1%
Cash-on-Cash Return
4.0%
Cap rate
0.7%
Rent to Value Ratio

Active
$625,000
5
bds
|
3
ba
|
3,510
sqft
|
built
1991
7835 Wild Eagle Rd, San Antonio, TX 78255
$-2,074
Cash flow
-17.3%
Cash-on-Cash Return
1.7%
Cap rate
0.4%
Rent to Value Ratio

Active
$199,000
2
bds
|
1
ba
|
927
sqft
|
built
1920
118 Cant Stop, San Antonio, TX 78202
$-575
Cash flow
-15.1%
Cash-on-Cash Return
2.2%
Cap rate
0.5%
Rent to Value Ratio

Active
$304,998
3
bds
|
2
ba
|
1,561
sqft
|
built
2014
22418 Akin Fawn, San Antonio, TX 78261
$-606
Cash flow
-10.4%
Cash-on-Cash Return
3.3%
Cap rate
0.7%
Rent to Value Ratio

Active
$269,990
3
bds
|
3
ba
|
2,380
sqft
|
built
2004
9422 Wolf Pt, San Antonio, TX 78251
$-644
Cash flow
-12.4%
Cash-on-Cash Return
2.8%
Cap rate
0.7%
Rent to Value Ratio
Active
$84,000
3
bds
|
2
ba
|
1,545
sqft
|
built
1950
314 Wabash St, San Antonio, TX 78211
$390
Cash flow
24.2%
Cash-on-Cash Return
11.3%
Cap rate
1.9%
Rent to Value Ratio

Active under contract
$295,000
4
bds
|
2
ba
|
2,007
sqft
|
built
1974
5847 Fort Stanwix St, San Antonio, TX 78233
$-552
Cash flow
-9.8%
Cash-on-Cash Return
3.4%
Cap rate
0.7%
Rent to Value Ratio

Active
$305,000
4
bds
|
3
ba
|
2,202
sqft
|
built
2021
7502 Anchor Cyn, San Antonio, TX 78252
$-467
Cash flow
-8.0%
Cash-on-Cash Return
3.8%
Cap rate
0.7%
Rent to Value Ratio

Active
$219,000
3
bds
|
1
ba
|
1,296
sqft
|
built
1970
6722 Spring Hollow Dr, San Antonio, TX 78249
$-344
Cash flow
-8.2%
Cash-on-Cash Return
3.8%
Cap rate
0.7%
Rent to Value Ratio
Active
$260,000
4
bds
|
2
ba
|
1,643
sqft
|
built
2021
10573 Green Lake Dr, San Antonio, TX 78223
$-358
Cash flow
-7.2%
Cash-on-Cash Return
4.0%
Cap rate
0.7%
Rent to Value Ratio

Active under contract
$550,000
4
bds
|
3
ba
|
2,343
sqft
|
built
2015
215 Hornpipe Hls, San Antonio, TX 78260
$-1,318
Cash flow
-12.5%
Cash-on-Cash Return
2.8%
Cap rate
0.6%
Rent to Value Ratio

Active
$325,000
4
bds
|
2
ba
|
1,885
sqft
|
built
1976
16519 Burr Hill St, San Antonio, TX 78247
$-744
Cash flow
-11.9%
Cash-on-Cash Return
2.9%
Cap rate
0.6%
Rent to Value Ratio

Active
$248,000
3
bds
|
2
ba
|
1,617
sqft
|
built
1981
5823 Archwood, San Antonio, TX 78239
$-467
Cash flow
-9.8%
Cash-on-Cash Return
3.4%
Cap rate
0.7%
Rent to Value Ratio

Active
$284,900
3
bds
|
3
ba
|
1,450
sqft
|
built
2020
12830 Cedarcreek Trl, San Antonio, TX 78254
$-1,312
Cash flow
-24.0%
Cash-on-Cash Return
0.2%
Cap rate
0.3%
Rent to Value Ratio

Active
$295,900
4
bds
|
3
ba
|
2,855
sqft
|
built
2002
418 Diver Pt, San Antonio, TX 78253
$-541
Cash flow
-9.5%
Cash-on-Cash Return
3.5%
Cap rate
0.7%
Rent to Value Ratio

Active
$279,000
3
bds
|
2
ba
|
1,811
sqft
|
built
1977
6707 Lake Cliff St, San Antonio, TX 78244
$-596
Cash flow
-11.1%
Cash-on-Cash Return
3.1%
Cap rate
0.6%
Rent to Value Ratio