San Antonio, TX Investment Properties for Sale
Browse homes for sale and investment properties in San Antonio, TX. Refine your search by price, property type, or more.
Best cash flowing properties in San Antonio, TX

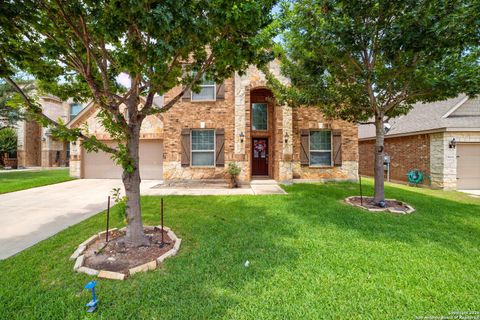
Active
$156,000
3
bds
|
1
ba
|
1,200
sqft
|
built
1930
213 W Hart Ave, San Antonio, TX 78214
$-29
Cash flow
-1.0%
Cash-on-Cash Return
6.0%
Cap rate
1.0%
Rent to Value Ratio

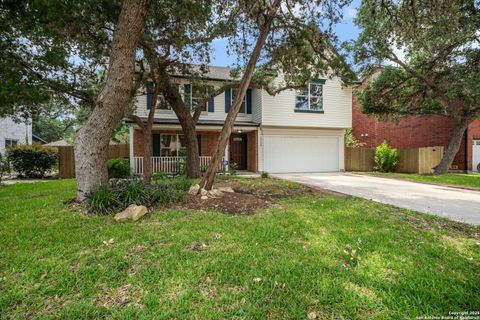
Active
$229,000
3
bds
|
1
ba
|
1,333
sqft
|
built
1952
703 Mc Dougal Ave, San Antonio, TX 78223
$-421
Cash flow
-9.6%
Cash-on-Cash Return
4.1%
Cap rate
0.7%
Rent to Value Ratio
5,678 out of 5,956 properties for sale in San Antonio, TX
Limited Results Shown
Create a free account, or log in to reveal all property listings and enjoy the complete experience.

Active under contract
$229,900
3
bds
|
2
ba
|
1,216
sqft
|
built
2012
11907 Pure Silver, San Antonio, TX 78254
$-441
Cash flow
-10.0%
Cash-on-Cash Return
4.0%
Cap rate
0.7%
Rent to Value Ratio

Active
$269,000
4
bds
|
0
ba
|
2,442
sqft
|
built
1984
7026 Elmbank, San Antonio, TX 78244
$-925
Cash flow
-17.9%
Cash-on-Cash Return
2.1%
Cap rate
0.5%
Rent to Value Ratio

Active
$270,000
4
bds
|
0
ba
|
1,876
sqft
|
built
1948
2456 Cincinnati Ave, San Antonio, TX 78228
$-993
Cash flow
-19.2%
Cash-on-Cash Return
1.9%
Cap rate
0.4%
Rent to Value Ratio

Active
$619,000
4
bds
|
4
ba
|
3,148
sqft
|
built
2008
1222 Ashbury Bay, San Antonio, TX 78258
$-2,134
Cash flow
-18.0%
Cash-on-Cash Return
2.1%
Cap rate
0.5%
Rent to Value Ratio
Active
$549,000
5
bds
|
4
ba
|
3,382
sqft
|
built
2014
8618 Sierra Sky, San Antonio, TX 78254
$-1,728
Cash flow
-16.4%
Cash-on-Cash Return
2.5%
Cap rate
0.6%
Rent to Value Ratio
Active
$365,000
4
bds
|
3
ba
|
3,300
sqft
|
built
1995
7734 Falcon Oak Dr, San Antonio, TX 78249
$-951
Cash flow
-13.6%
Cash-on-Cash Return
3.1%
Cap rate
0.7%
Rent to Value Ratio

Active
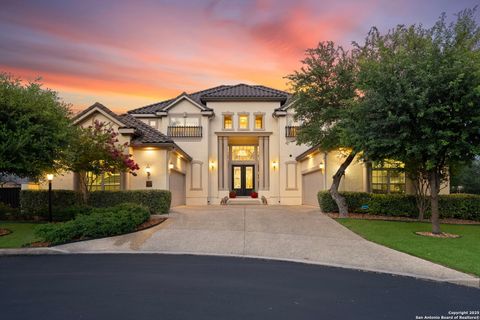
$1,379,900
6
bds
|
6
ba
|
3,064
sqft
|
built
1927
264 E Lullwood Ave, San Antonio, TX 78212
$-7,423
Cash flow
-28.1%
Cash-on-Cash Return
-0.2%
Cap rate
0.1%
Rent to Value Ratio

Pending
$279,500
3
bds
|
3
ba
|
1,500
sqft
|
built
1985
13043 Trent St, San Antonio, TX 78232
$-954
Cash flow
-17.8%
Cash-on-Cash Return
2.2%
Cap rate
0.6%
Rent to Value Ratio

Active
$565,000
3
bds
|
2
ba
|
1,904
sqft
|
built
1900
1219 N Olive St, San Antonio, TX 78202
$-1,925
Cash flow
-17.8%
Cash-on-Cash Return
2.2%
Cap rate
0.5%
Rent to Value Ratio

Active
$719,000
4
bds
|
3
ba
|
2,598
sqft
|
built
1947
131 Larchmont Dr, San Antonio, TX 78209
$-2,704
Cash flow
-19.6%
Cash-on-Cash Return
1.8%
Cap rate
0.4%
Rent to Value Ratio
Active
$229,000
3
bds
|
1
ba
|
1,333
sqft
|
built
1952
703 Mc Dougal Ave, San Antonio, TX 78223
$-421
Cash flow
-9.6%
Cash-on-Cash Return
4.1%
Cap rate
0.7%
Rent to Value Ratio

Pending
$1,150,000
3
bds
|
3
ba
|
2,652
sqft
|
built
1989
41 Longsford, San Antonio, TX 78209
$-4,989
Cash flow
-22.6%
Cash-on-Cash Return
1.1%
Cap rate
0.3%
Rent to Value Ratio

Active
$454,900
3
bds
|
3
ba
|
2,551
sqft
|
built
1994
15323 Antler Creek Dr, San Antonio, TX 78248
$-2,219
Cash flow
-25.5%
Cash-on-Cash Return
0.4%
Cap rate
0.3%
Rent to Value Ratio

Active
$240,000
3
bds
|
2
ba
|
1,394
sqft
|
built
1959
1919 Arroya Vista Dr, San Antonio, TX 78213
$-439
Cash flow
-9.5%
Cash-on-Cash Return
4.1%
Cap rate
0.8%
Rent to Value Ratio

Active
$305,000
3
bds
|
2
ba
|
1,988
sqft
|
built
1989
9515 Wicklow Dr, San Antonio, TX 78250
$-786
Cash flow
-13.4%
Cash-on-Cash Return
3.2%
Cap rate
0.7%
Rent to Value Ratio

Active
$900,000
5
bds
|
5
ba
|
4,098
sqft
|
built
2002
1818 Palmer Vw, San Antonio, TX 78260
$-2,245
Cash flow
-13.0%
Cash-on-Cash Return
3.3%
Cap rate
0.6%
Rent to Value Ratio

Active under contract
$675,000
4
bds
|
4
ba
|
3,718
sqft
|
built
1979
1818 Moreshead St, San Antonio, TX 78231
$-2,625
Cash flow
-20.3%
Cash-on-Cash Return
1.6%
Cap rate
0.4%
Rent to Value Ratio

Active
$379,000
3
bds
|
2
ba
|
1,473
sqft
|
built
1925
1106 W Summit Ave, San Antonio, TX 78201
$-1,186
Cash flow
-16.3%
Cash-on-Cash Return
2.5%
Cap rate
0.5%
Rent to Value Ratio
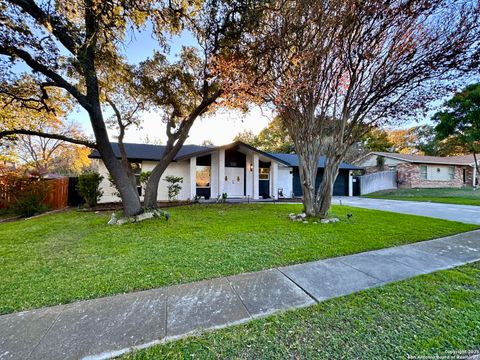
Active
$335,000
1
bds
|
1
ba
|
766
sqft
|
built
2008
831 S Flores St, San Antonio, TX 78204
$-1,507
Cash flow
-23.5%
Cash-on-Cash Return
0.9%
Cap rate
0.5%
Rent to Value Ratio

Active
$845,000
5
bds
|
4
ba
|
3,604
sqft
|
built
2014
2715 Sonata Park, San Antonio, TX 78230
$-3,088
Cash flow
-19.1%
Cash-on-Cash Return
1.9%
Cap rate
0.5%
Rent to Value Ratio

Active
$425,000
3
bds
|
3
ba
|
2,859
sqft
|
built
2021
22418 Peonia Park, San Antonio, TX 78261
$-1,169
Cash flow
-14.4%
Cash-on-Cash Return
3.0%
Cap rate
0.6%
Rent to Value Ratio

Active
$220,000
3
bds
|
2
ba
|
1,357
sqft
|
built
2018
3027 Mission Gate, San Antonio, TX 78224
$-525
Cash flow
-12.5%
Cash-on-Cash Return
3.4%
Cap rate
0.7%
Rent to Value Ratio
Active
$276,000
3
bds
|
2
ba
|
1,510
sqft
|
built
2022
526 Wild Olive Way, San Antonio, TX 78219
$-745
Cash flow
-14.1%
Cash-on-Cash Return
3.0%
Cap rate
0.7%
Rent to Value Ratio

Active
$449,000
4
bds
|
3
ba
|
2,463
sqft
|
built
1989
942 Lightstone Dr, San Antonio, TX 78258
$-1,536
Cash flow
-17.8%
Cash-on-Cash Return
2.2%
Cap rate
0.6%
Rent to Value Ratio

Active
$359,900
3
bds
|
3
ba
|
2,042
sqft
|
built
1977
6127 Walking Gait Dr, San Antonio, TX 78240
$-1,087
Cash flow
-15.8%
Cash-on-Cash Return
2.6%
Cap rate
0.6%
Rent to Value Ratio

Active
$329,000
4
bds
|
2
ba
|
1,528
sqft
|
built
1976
2714 Floral Way Dr, San Antonio, TX 78247
$-1,125
Cash flow
-17.8%
Cash-on-Cash Return
2.2%
Cap rate
0.5%
Rent to Value Ratio

Active
$395,000
4
bds
|
3
ba
|
2,133
sqft
|
built
2019
10242 Nate Range, San Antonio, TX 78254
$-1,011
Cash flow
-13.4%
Cash-on-Cash Return
3.2%
Cap rate
0.6%
Rent to Value Ratio

Active
$250,000
3
bds
|
2
ba
|
1,248
sqft
|
built
2005
9215 Hilltop Crossing Dr, San Antonio, TX 78251
$-688
Cash flow
-14.4%
Cash-on-Cash Return
3.0%
Cap rate
0.6%
Rent to Value Ratio

Active
$274,800
3
bds
|
2
ba
|
1,492
sqft
|
built
1974
4515 Timberhill, San Antonio, TX 78238
$-778
Cash flow
-14.8%
Cash-on-Cash Return
2.9%
Cap rate
0.6%
Rent to Value Ratio
Active
$1,675,000
5
bds
|
6
ba
|
6,205
sqft
|
built
2014
21302 Ronda De Cadiz, San Antonio, TX 78257
$-7,706
Cash flow
-24.0%
Cash-on-Cash Return
0.7%
Cap rate
0.3%
Rent to Value Ratio

Active
$249,000
3
bds
|
2
ba
|
1,306
sqft
|
built
1959
522 E Rector St, San Antonio, TX 78216
$-437
Cash flow
-9.2%
Cash-on-Cash Return
4.2%
Cap rate
0.8%
Rent to Value Ratio
Active
$156,000
3
bds
|
1
ba
|
1,200
sqft
|
built
1930
213 W Hart Ave, San Antonio, TX 78214
$-29
Cash flow
-1.0%
Cash-on-Cash Return
6.0%
Cap rate
1.0%
Rent to Value Ratio

Active under contract
$799,000
5
bds
|
4
ba
|
3,782
sqft
|
built
2010
511 Rio Spgs, San Antonio, TX 78258
$-2,878
Cash flow
-18.8%
Cash-on-Cash Return
1.9%
Cap rate
0.5%
Rent to Value Ratio

Active under contract
$750,000
4
bds
|
4
ba
|
3,709
sqft
|
built
2014
26019 Red Heron, San Antonio, TX 78261
$-2,804
Cash flow
-19.5%
Cash-on-Cash Return
1.8%
Cap rate
0.4%
Rent to Value Ratio

Active
$255,000
3
bds
|
3
ba
|
2,244
sqft
|
built
2004
1230 Range Fld, San Antonio, TX 78245
$-614
Cash flow
-12.6%
Cash-on-Cash Return
3.4%
Cap rate
0.7%
Rent to Value Ratio

Pending
$789,500
3
bds
|
4
ba
|
3,154
sqft
|
built
2017
18426 Wild Onion, San Antonio, TX 78258
$-2,998
Cash flow
-19.8%
Cash-on-Cash Return
1.7%
Cap rate
0.5%
Rent to Value Ratio

Active
$550,000
4
bds
|
2
ba
|
2,138
sqft
|
built
2018
23107 Emerald Pass, San Antonio, TX 78258
$-1,697
Cash flow
-16.1%
Cash-on-Cash Return
2.6%
Cap rate
0.5%
Rent to Value Ratio

Active
$299,000
3
bds
|
2
ba
|
1,432
sqft
|
built
1946
1119 N Pine St, San Antonio, TX 78202
$-712
Cash flow
-12.4%
Cash-on-Cash Return
3.4%
Cap rate
0.7%
Rent to Value Ratio
Active under contract
$350,000
3
bds
|
2
ba
|
1,632
sqft
|
built
1972
6422 Balky St, San Antonio, TX 78240
$-980
Cash flow
-14.6%
Cash-on-Cash Return
2.9%
Cap rate
0.6%
Rent to Value Ratio

Active
$446,500
4
bds
|
3
ba
|
2,806
sqft
|
built
1975
2822 Low Oak St, San Antonio, TX 78232
$-1,387
Cash flow
-16.2%
Cash-on-Cash Return
2.5%
Cap rate
0.6%
Rent to Value Ratio