San Jose, CA Investment Properties for Sale
Browse homes for sale and investment properties in San Jose, CA. Refine your search by price, property type, or more.
Best cash flowing properties in San Jose, CA
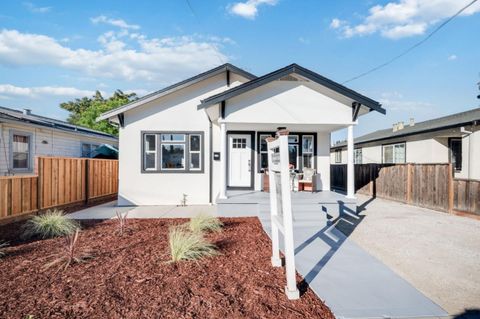
Active
$499,000
2
bds
|
2
ba
|
918
sqft
|
built
1983
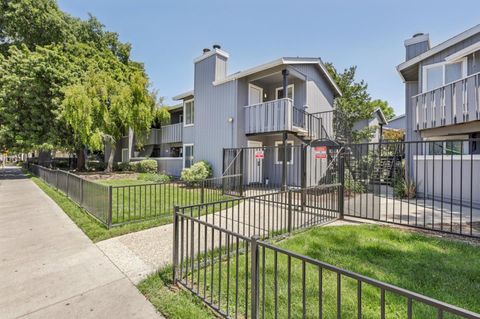
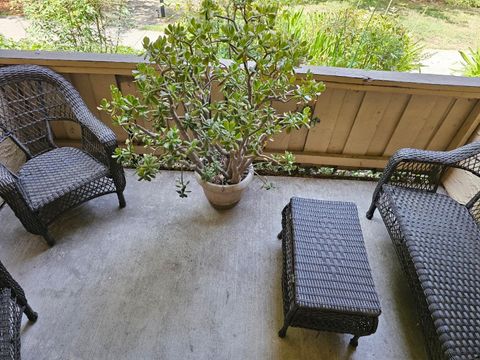
106 Rancho Dr, San Jose, CA 95111
$-660
Cash flow
-6.9%
Cash-on-Cash Return
4.5%
Cap rate
0.5%
Rent to Value Ratio
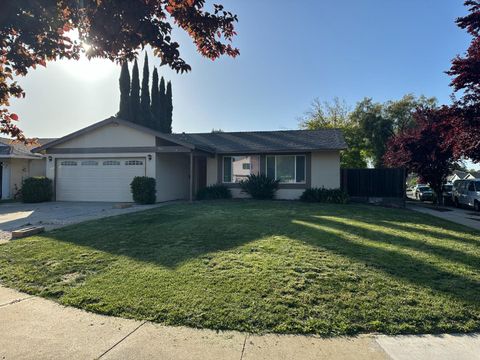
Active
$499,900
1
bds
|
1
ba
|
828
sqft
|
built
1977
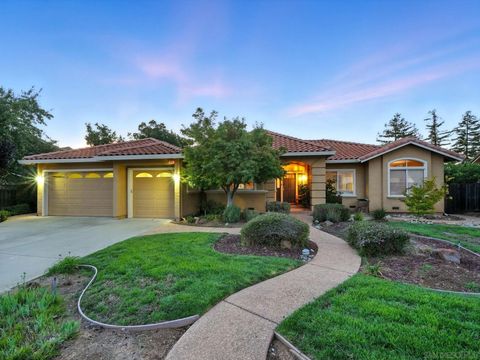
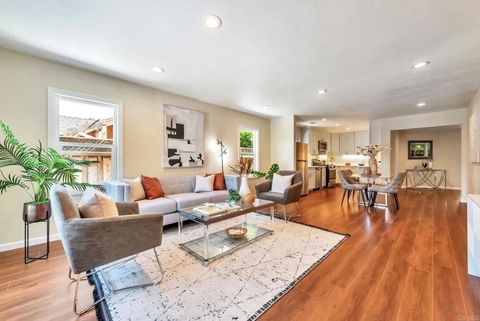
259 N Capitol Ave, San Jose, CA 95127
$-734
Cash flow
-7.7%
Cash-on-Cash Return
4.3%
Cap rate
0.5%
Rent to Value Ratio
426 out of 470 properties for sale in San Jose, CA
Limited Results Shown
Create a free account, or log in to reveal all property listings and enjoy the complete experience.
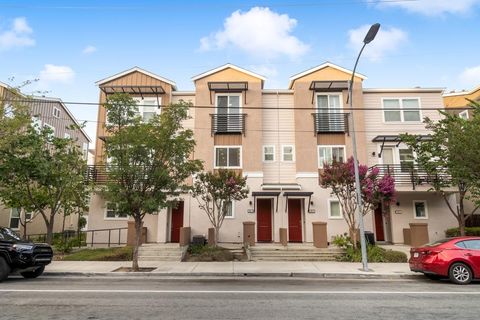
Active
$3,495,000
5
bds
|
4
ba
|
3,294
sqft
|
built
1996
3097 High Meadow Ln, San Jose, CA 95135
$-13,257
Cash flow
-19.8%
Cash-on-Cash Return
1.5%
Cap rate
0.2%
Rent to Value Ratio
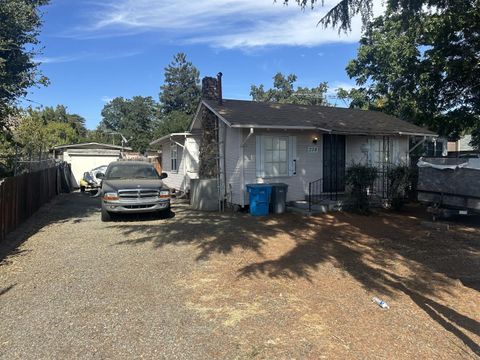
Active
$1,430,000
6
bds
|
4
ba
|
2,265
sqft
|
built
1939
408 Page St, San Jose, CA 95126
$-3,850
Cash flow
-14.0%
Cash-on-Cash Return
2.8%
Cap rate
0.3%
Rent to Value Ratio
Active
$1,769,000
4
bds
|
3
ba
|
1,434
sqft
|
built
1971
1435 Mardan Dr, San Jose, CA 95132
$-5,909
Cash flow
-17.4%
Cash-on-Cash Return
2.1%
Cap rate
0.2%
Rent to Value Ratio
Active
$599,000
2
bds
|
2
ba
|
1,071
sqft
|
built
1984
1467 Alma Loop, San Jose, CA 95125
$-1,035
Cash flow
-9.0%
Cash-on-Cash Return
4.0%
Cap rate
0.6%
Rent to Value Ratio
Active
$525,000
1
bds
|
1
ba
|
692
sqft
|
built
2007
25 S 3rd St, San Jose, CA 95113
$-1,468
Cash flow
-14.6%
Cash-on-Cash Return
2.7%
Cap rate
0.5%
Rent to Value Ratio
Active
$1,158,000
3
bds
|
3
ba
|
1,848
sqft
|
built
1986
606 Skyway Dr, San Jose, CA 95111
$-3,281
Cash flow
-14.8%
Cash-on-Cash Return
2.7%
Cap rate
0.3%
Rent to Value Ratio
Active
$895,000
2
bds
|
3
ba
|
1,327
sqft
|
built
2008
2070 Almaden Rd, San Jose, CA 95125
$-2,235
Cash flow
-13.0%
Cash-on-Cash Return
3.1%
Cap rate
0.4%
Rent to Value Ratio
Active
$1,729,999
6
bds
|
0
ba
|
2,219
sqft
|
built
1920
622 Berryessa Rd, San Jose, CA 95112
$-5,712
Cash flow
-17.2%
Cash-on-Cash Return
2.1%
Cap rate
0.3%
Rent to Value Ratio
Active
$1,115,000
2
bds
|
3
ba
|
1,445
sqft
|
built
1981
1932 Huxley Ct, San Jose, CA 95125
$-3,269
Cash flow
-15.3%
Cash-on-Cash Return
2.5%
Cap rate
0.4%
Rent to Value Ratio
Active
$1,749,000
5
bds
|
3
ba
|
2,200
sqft
|
built
2000
960 Sunbonnet Loop, San Jose, CA 95125
$-5,130
Cash flow
-15.3%
Cash-on-Cash Return
2.5%
Cap rate
0.3%
Rent to Value Ratio
Active
$849,000
3
bds
|
2
ba
|
1,272
sqft
|
built
1974
263 Truckee Ln, San Jose, CA 95136
$-2,369
Cash flow
-14.6%
Cash-on-Cash Return
2.7%
Cap rate
0.4%
Rent to Value Ratio
Active
$670,000
2
bds
|
1
ba
|
852
sqft
|
built
1988
5973 Lake Almanor Dr, San Jose, CA 95123
$-1,656
Cash flow
-12.9%
Cash-on-Cash Return
3.1%
Cap rate
0.5%
Rent to Value Ratio
Active
$768,000
2
bds
|
2
ba
|
1,646
sqft
|
built
1978
8463 Traminer Ct, San Jose, CA 95135
$-2,554
Cash flow
-17.4%
Cash-on-Cash Return
2.1%
Cap rate
0.5%
Rent to Value Ratio
Active
$649,000
2
bds
|
2
ba
|
1,421
sqft
|
built
1997
144 S 3rd St, San Jose, CA 95112
$-1,876
Cash flow
-15.1%
Cash-on-Cash Return
2.6%
Cap rate
0.6%
Rent to Value Ratio
Active
$1,895,000
3
bds
|
2
ba
|
1,851
sqft
|
built
1969
4450 Silva Ave, San Jose, CA 95118
$-6,132
Cash flow
-16.9%
Cash-on-Cash Return
2.2%
Cap rate
0.3%
Rent to Value Ratio

Active
$1,339,000
4
bds
|
2
ba
|
1,400
sqft
|
built
1969
6097 Indian Ave, San Jose, CA 95123
$-3,735
Cash flow
-14.6%
Cash-on-Cash Return
2.7%
Cap rate
0.3%
Rent to Value Ratio
Active
$799,000
2
bds
|
2
ba
|
1,421
sqft
|
built
1997
144 S 3rd St, San Jose, CA 95112
$-2,565
Cash flow
-16.7%
Cash-on-Cash Return
2.2%
Cap rate
0.5%
Rent to Value Ratio
Active
$1,548,000
3
bds
|
2
ba
|
1,359
sqft
|
built
1965
1598 Hallbrook Dr, San Jose, CA 95118
$-5,344
Cash flow
-18.0%
Cash-on-Cash Return
1.9%
Cap rate
0.2%
Rent to Value Ratio
Active
$1,750,000
4
bds
|
2
ba
|
1,857
sqft
|
built
1966
3910 Briarglen Dr, San Jose, CA 95118
$-5,399
Cash flow
-16.1%
Cash-on-Cash Return
2.4%
Cap rate
0.3%
Rent to Value Ratio
Active
$949,888
2
bds
|
3
ba
|
1,776
sqft
|
built
1985
3230 Lake Albano Cir, San Jose, CA 95135
$-3,838
Cash flow
-21.1%
Cash-on-Cash Return
1.2%
Cap rate
0.4%
Rent to Value Ratio
Active
$840,000
2
bds
|
2
ba
|
925
sqft
|
built
1994
803 Debut Ct, San Jose, CA 95134
$-2,245
Cash flow
-13.9%
Cash-on-Cash Return
2.9%
Cap rate
0.4%
Rent to Value Ratio
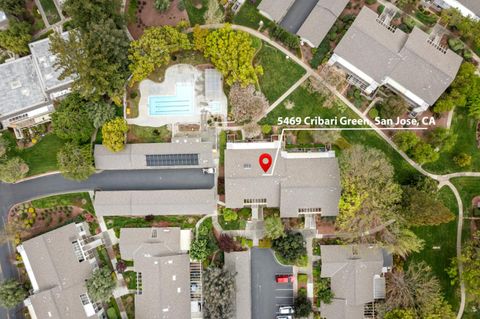
Active
$509,000
2
bds
|
2
ba
|
1,223
sqft
|
built
1969
5469 Cribari Grn, San Jose, CA 95135
$-1,453
Cash flow
-14.9%
Cash-on-Cash Return
2.6%
Cap rate
0.6%
Rent to Value Ratio
Active
$709,000
2
bds
|
2
ba
|
1,010
sqft
|
built
2005
749 Bonita Pl, San Jose, CA 95116
$-1,696
Cash flow
-12.5%
Cash-on-Cash Return
3.2%
Cap rate
0.4%
Rent to Value Ratio
Active
$1,188,000
3
bds
|
3
ba
|
1,850
sqft
|
built
2014
1057 Foxglove Pl, San Jose, CA 95131
$-2,488
Cash flow
-10.9%
Cash-on-Cash Return
3.6%
Cap rate
0.4%
Rent to Value Ratio
Active
$2,198,000
3
bds
|
4
ba
|
1,786
sqft
|
built
1938
1265 Blewett Ave, San Jose, CA 95125
$-7,595
Cash flow
-18.0%
Cash-on-Cash Return
1.9%
Cap rate
0.2%
Rent to Value Ratio
Active
$1,049,999
2
bds
|
3
ba
|
1,777
sqft
|
built
2004
501 Casselino Dr, San Jose, CA 95136
$-2,968
Cash flow
-14.7%
Cash-on-Cash Return
2.7%
Cap rate
0.4%
Rent to Value Ratio
Active
$1,779,999
4
bds
|
3
ba
|
1,974
sqft
|
built
1969
1332 Cabrillo Ave, San Jose, CA 95132
$-5,620
Cash flow
-16.5%
Cash-on-Cash Return
2.3%
Cap rate
0.3%
Rent to Value Ratio
Active
$1,199,000
3
bds
|
2
ba
|
1,358
sqft
|
built
1955
366 Cureton Pl, San Jose, CA 95127
$-3,648
Cash flow
-15.9%
Cash-on-Cash Return
2.4%
Cap rate
0.3%
Rent to Value Ratio
Active
$1,225,000
3
bds
|
3
ba
|
1,818
sqft
|
built
2017
3092 Manuel St, San Jose, CA 95136
$-3,493
Cash flow
-14.9%
Cash-on-Cash Return
2.6%
Cap rate
0.4%
Rent to Value Ratio
Active
$849,000
3
bds
|
1
ba
|
1,052
sqft
|
built
1965
2222 Annona Ave, San Jose, CA 95122
$-1,809
Cash flow
-11.1%
Cash-on-Cash Return
3.5%
Cap rate
0.4%
Rent to Value Ratio
Active
$625,000
1
bds
|
2
ba
|
1,077
sqft
|
built
2003
350 E Mission St, San Jose, CA 95112
$-1,835
Cash flow
-15.3%
Cash-on-Cash Return
2.5%
Cap rate
0.5%
Rent to Value Ratio
Active
$2,198,000
4
bds
|
2
ba
|
1,900
sqft
|
built
1979
1563 Dorcey Ln, San Jose, CA 95120
$-7,595
Cash flow
-18.0%
Cash-on-Cash Return
1.9%
Cap rate
0.2%
Rent to Value Ratio
Active
$1,258,000
4
bds
|
4
ba
|
2,139
sqft
|
built
2016
1999 Dobbin Dr, San Jose, CA 95133
$-3,091
Cash flow
-12.8%
Cash-on-Cash Return
3.1%
Cap rate
0.4%
Rent to Value Ratio
Active
$899,000
2
bds
|
1
ba
|
928
sqft
|
built
1910
1536 Little Orchard St, San Jose, CA 95110
$-2,407
Cash flow
-14.0%
Cash-on-Cash Return
2.9%
Cap rate
0.3%
Rent to Value Ratio
Active
$1,350,000
3
bds
|
2
ba
|
1,137
sqft
|
built
1970
203 Pemba Ct, San Jose, CA 95119
$-3,790
Cash flow
-14.6%
Cash-on-Cash Return
2.7%
Cap rate
0.3%
Rent to Value Ratio
Active
$935,000
2
bds
|
3
ba
|
1,241
sqft
|
built
2014
748 N 10th St, San Jose, CA 95112
$-2,580
Cash flow
-14.4%
Cash-on-Cash Return
2.8%
Cap rate
0.4%
Rent to Value Ratio
Active
$775,000
1
bds
|
1
ba
|
744
sqft
|
built
1920
274 Vista Ave, San Jose, CA 95127
$-1,780
Cash flow
-12.0%
Cash-on-Cash Return
3.3%
Cap rate
0.4%
Rent to Value Ratio
Active
$999,888
3
bds
|
2
ba
|
1,388
sqft
|
built
1940
86 S Cragmont Ave, San Jose, CA 95127
$-2,296
Cash flow
-12.0%
Cash-on-Cash Return
3.3%
Cap rate
0.4%
Rent to Value Ratio