San Marcos, TX Investment Properties for Sale
Browse homes for sale and investment properties in San Marcos, TX. Refine your search by price, property type, or more.
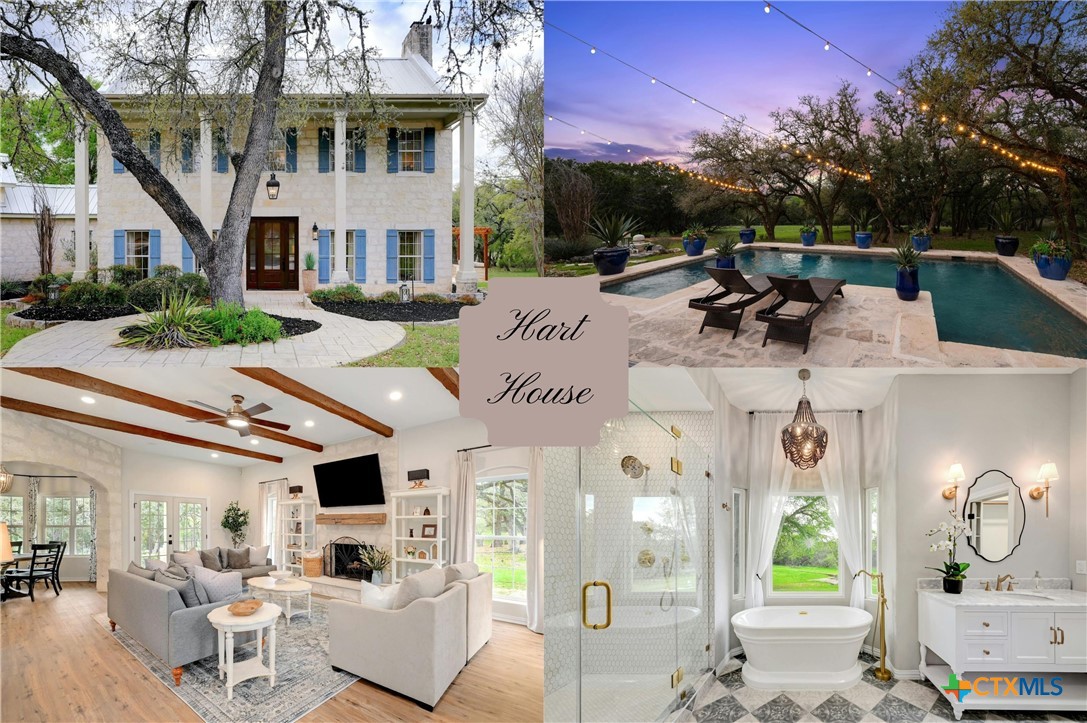
Best cash flowing properties in San Marcos, TX
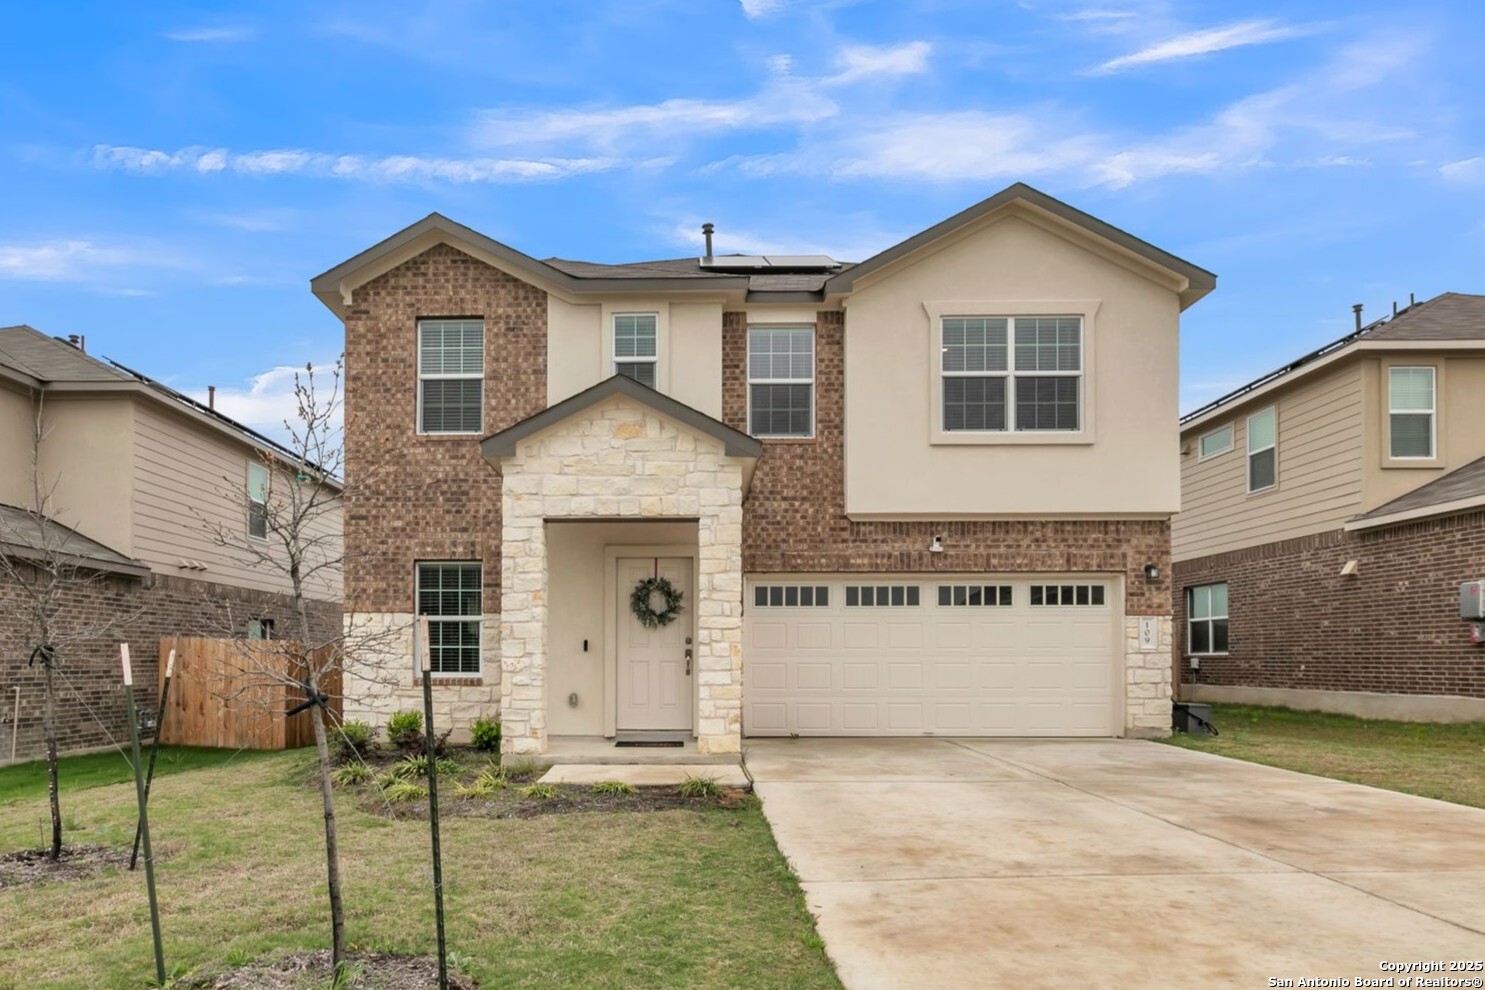
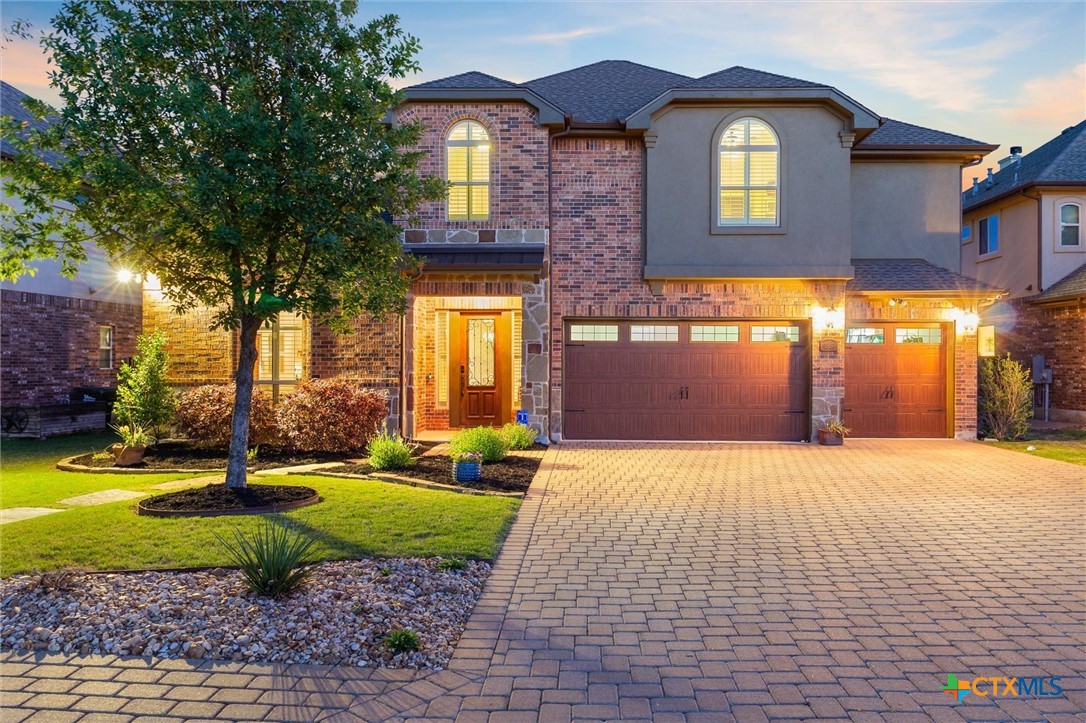
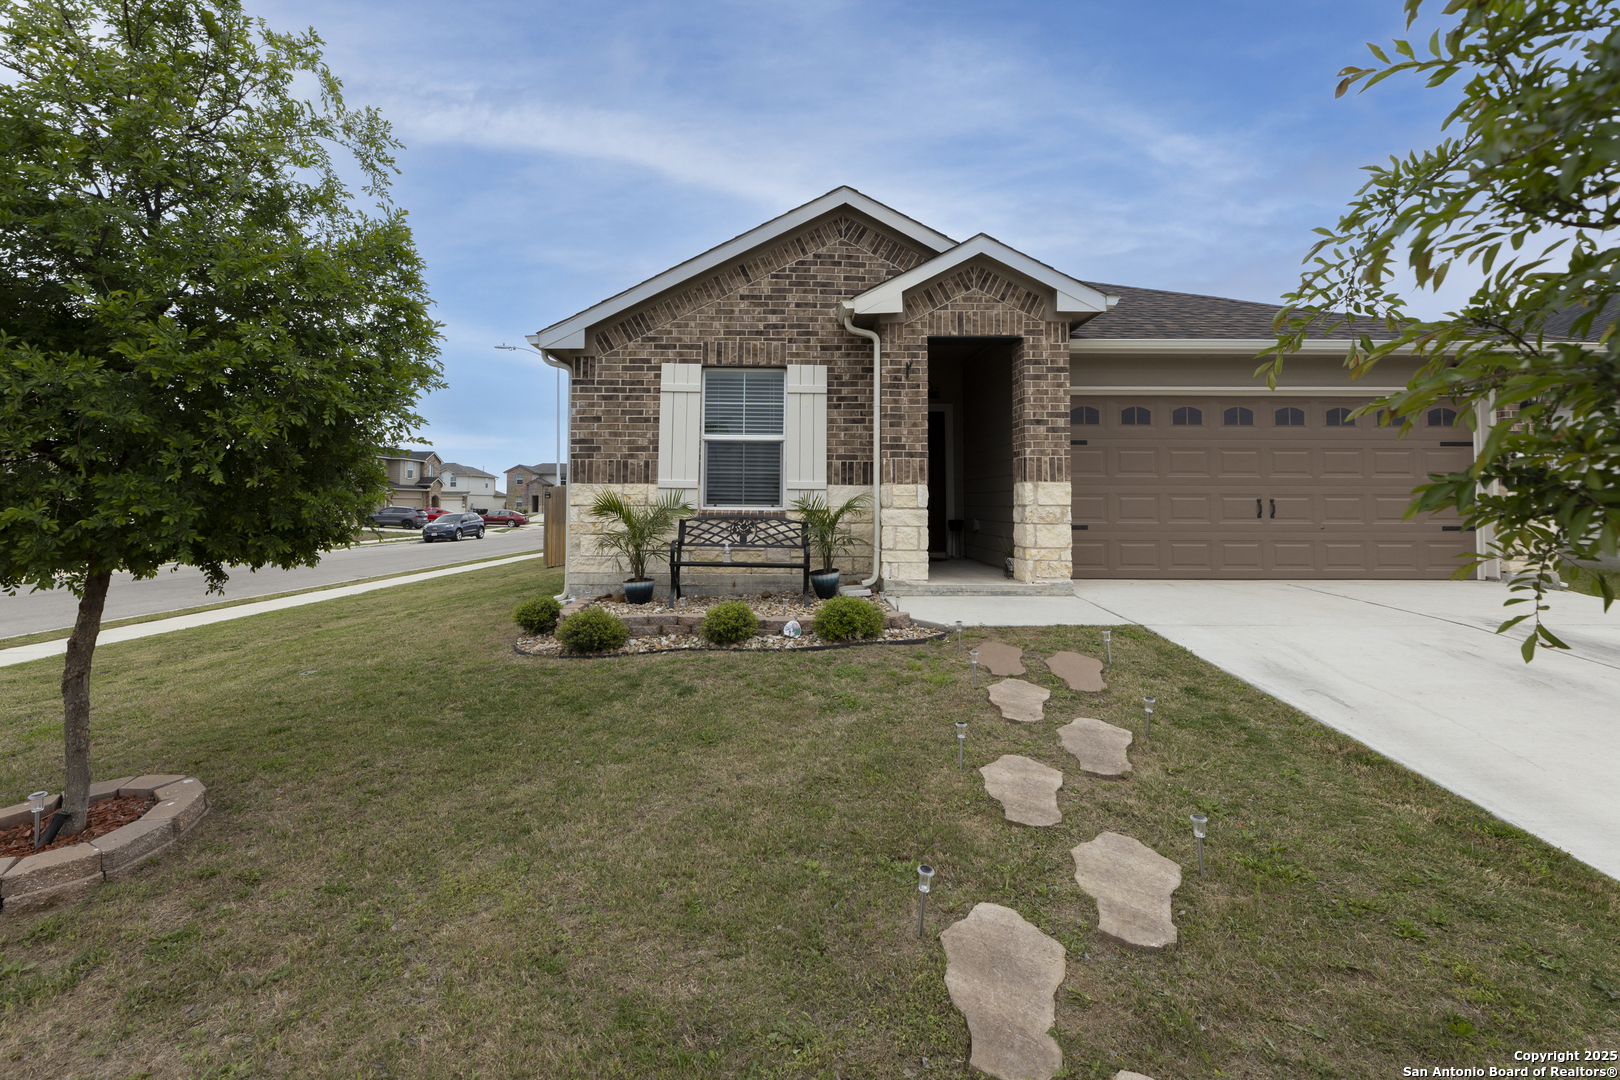
Active
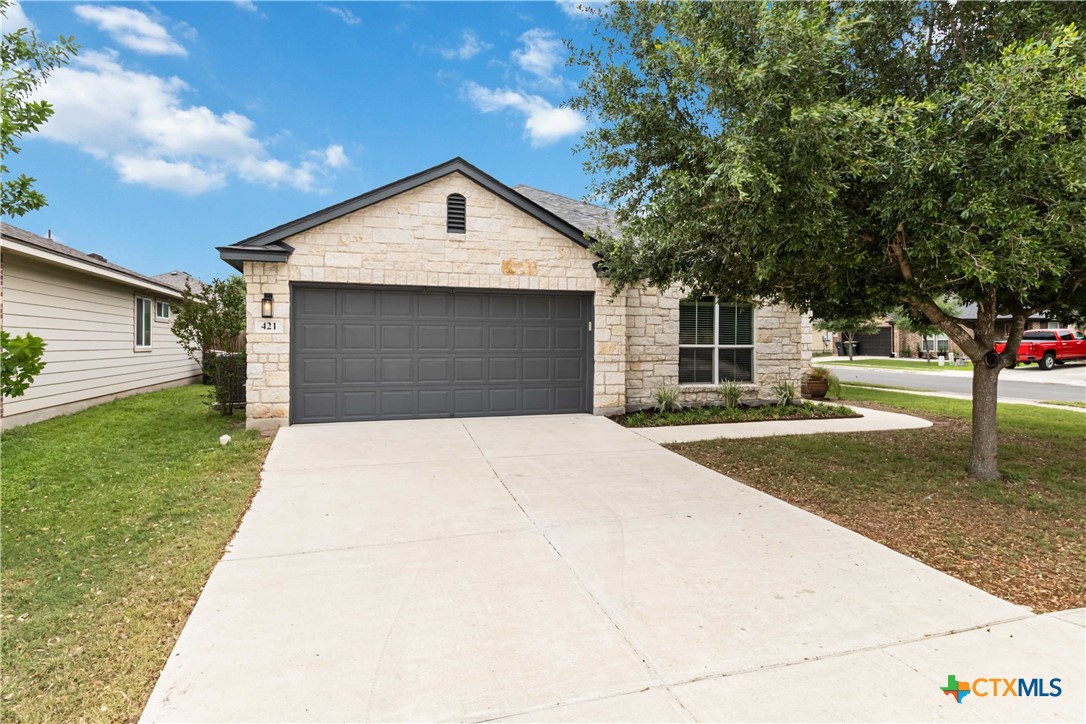
$335,000
3
bds
|
3
ba
|
2,072
sqft
|
built
2024
109 Seminole Dr, San Marcos, TX 78666
n/a
Cash flow
n/a
Cash-on-Cash Return
n/a
Cap rate
n/a
Rent to Value Ratio
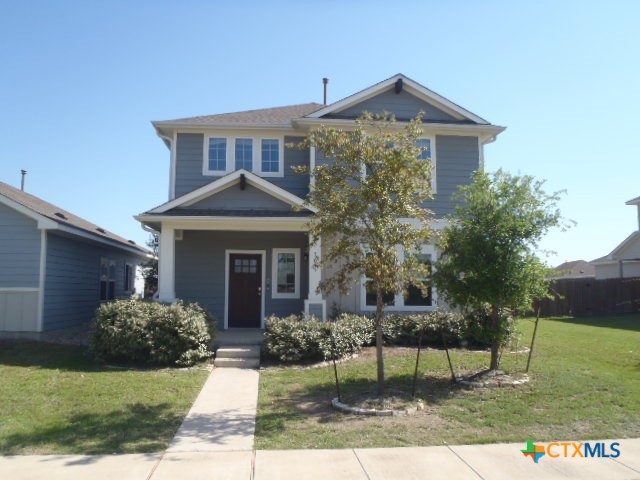
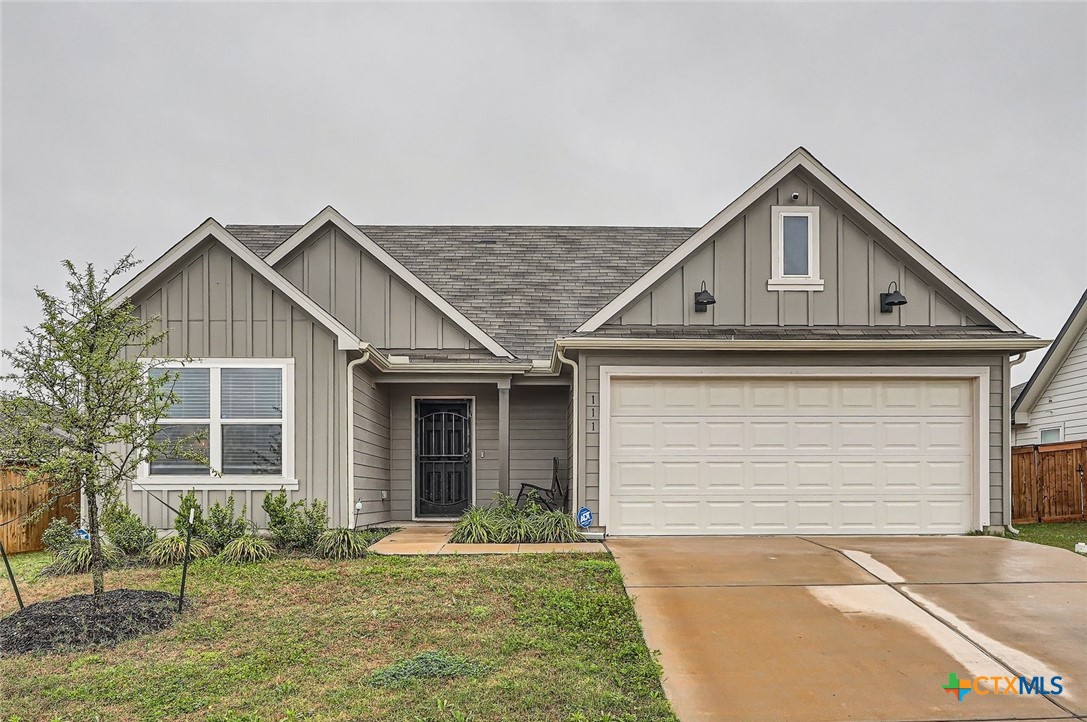
Pending
$299,000
3
bds
|
3
ba
|
1,730
sqft
|
built
2018
302 Mossycup Dr, San Marcos, TX 78666
$-168
Cash flow
-2.9%
Cash-on-Cash Return
5.0%
Cap rate
0.9%
Rent to Value Ratio
130 out of 302 properties for sale in San Marcos, TX
Limited Results Shown
Create a free account, or log in to reveal all property listings and enjoy the complete experience.
Active
$295,000
3
bds
|
3
ba
|
1,945
sqft
|
built
2020
1109 Esplanade Pkwy, San Marcos, TX 78666
$-527
Cash flow
-9.3%
Cash-on-Cash Return
3.5%
Cap rate
0.7%
Rent to Value Ratio
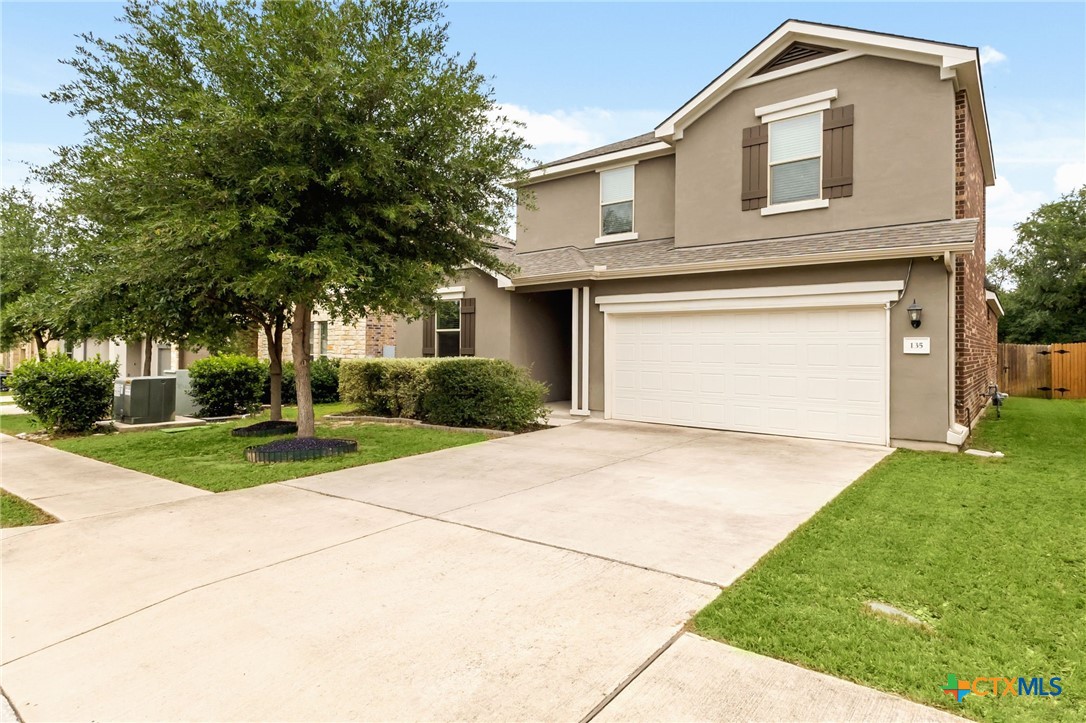
Active
$399,500
3
bds
|
3
ba
|
2,286
sqft
|
built
2017
135 Mary Max Cir, San Marcos, TX 78666
$-304
Cash flow
-4.0%
Cash-on-Cash Return
4.8%
Cap rate
0.6%
Rent to Value Ratio
Active
$249,500
3
bds
|
2
ba
|
1,363
sqft
|
built
1956
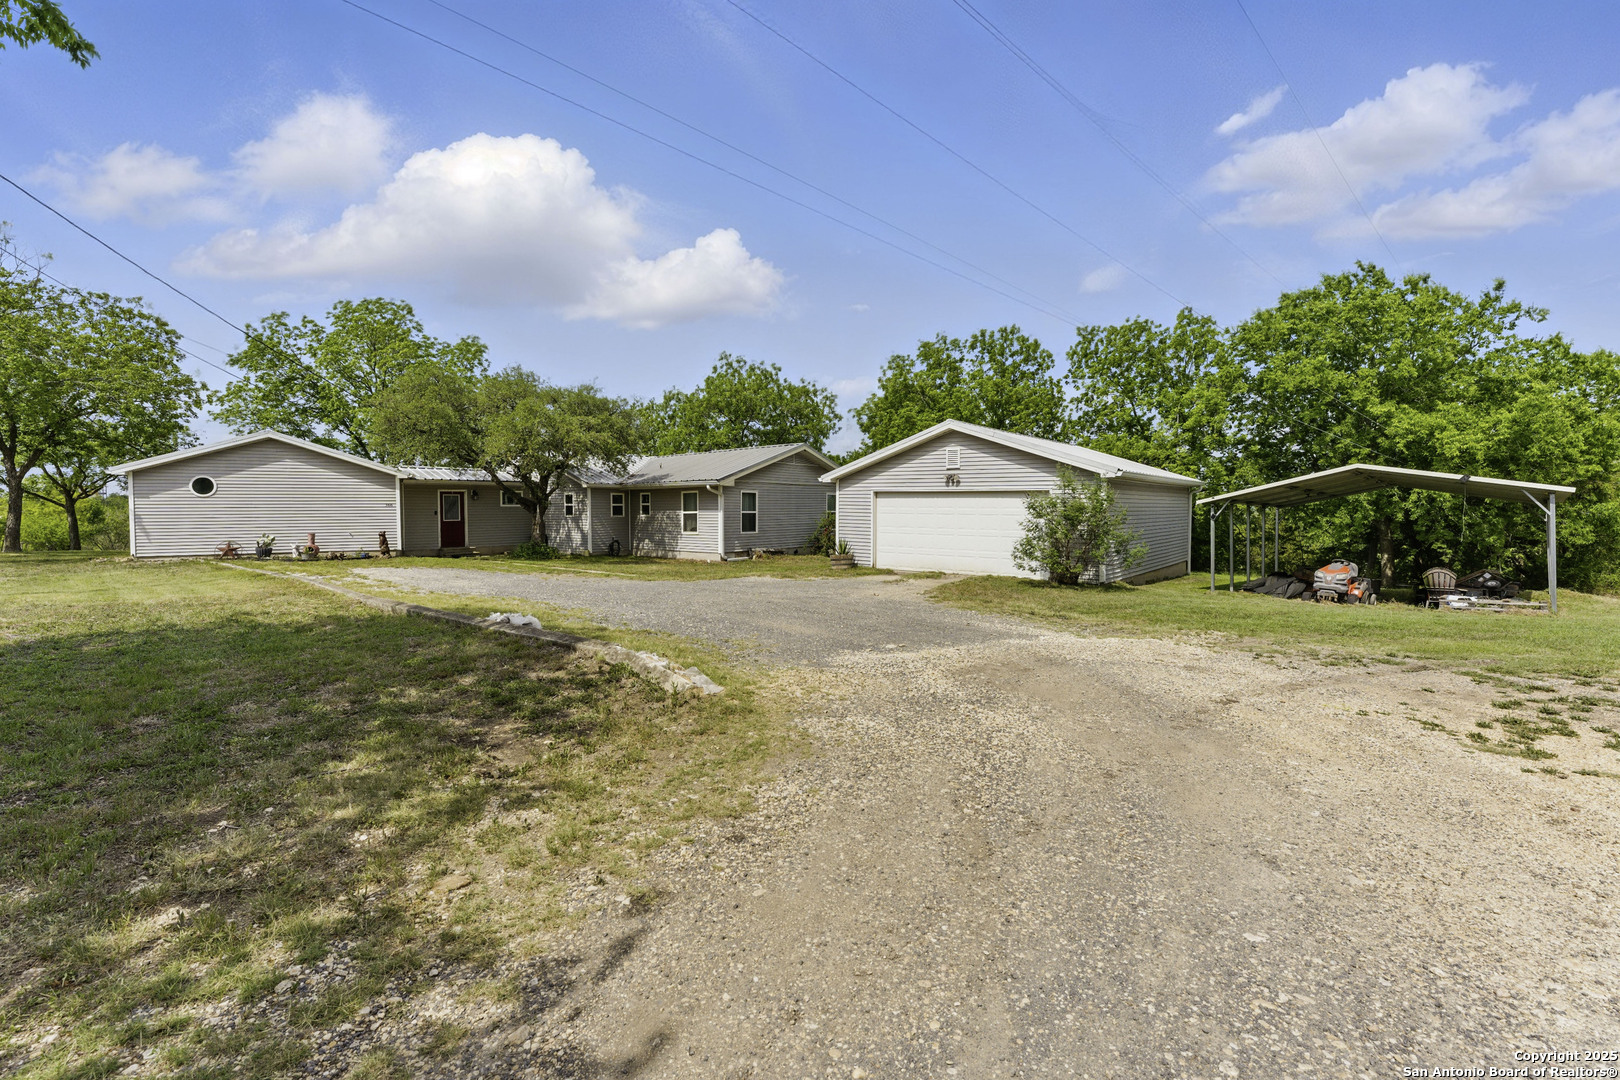
310 Smith Ln, San Marcos, TX 78666
$-485
Cash flow
-10.1%
Cash-on-Cash Return
3.3%
Cap rate
0.6%
Rent to Value Ratio
Active
$629,000
5
bds
|
3
ba
|
2,892
sqft
|
built
2003
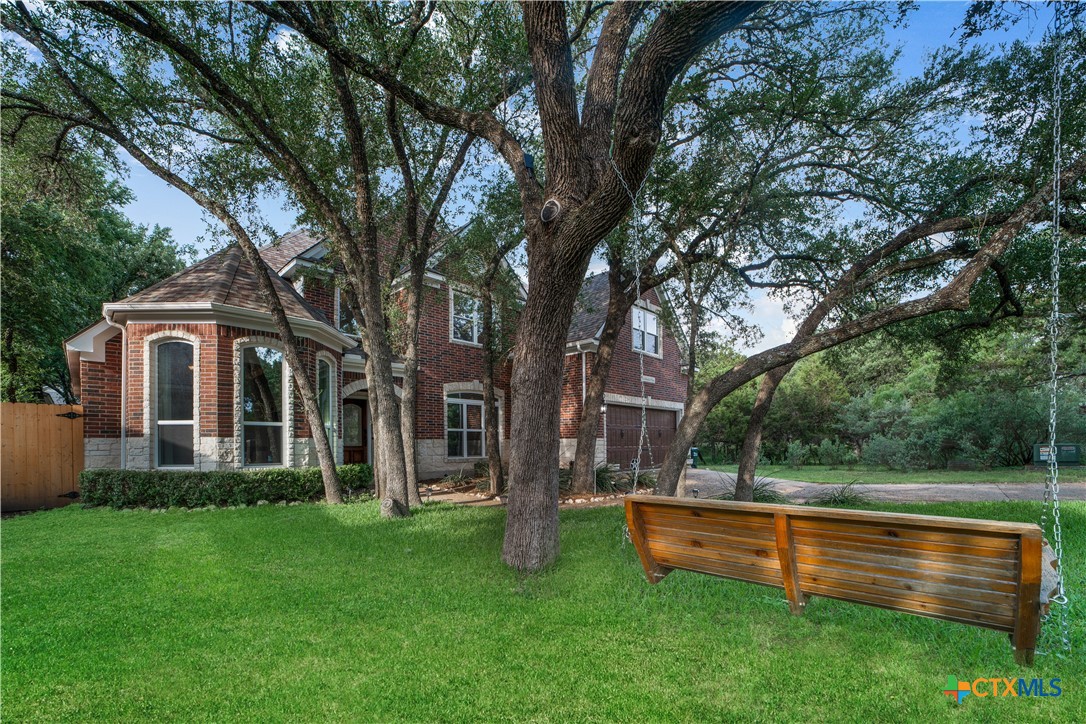
103 Sierra Ridge Dr, San Marcos, TX 78666
$-2,153
Cash flow
-17.9%
Cash-on-Cash Return
1.6%
Cap rate
0.4%
Rent to Value Ratio
Active
$415,000
3
bds
|
2
ba
|
2,344
sqft
|
built
2014
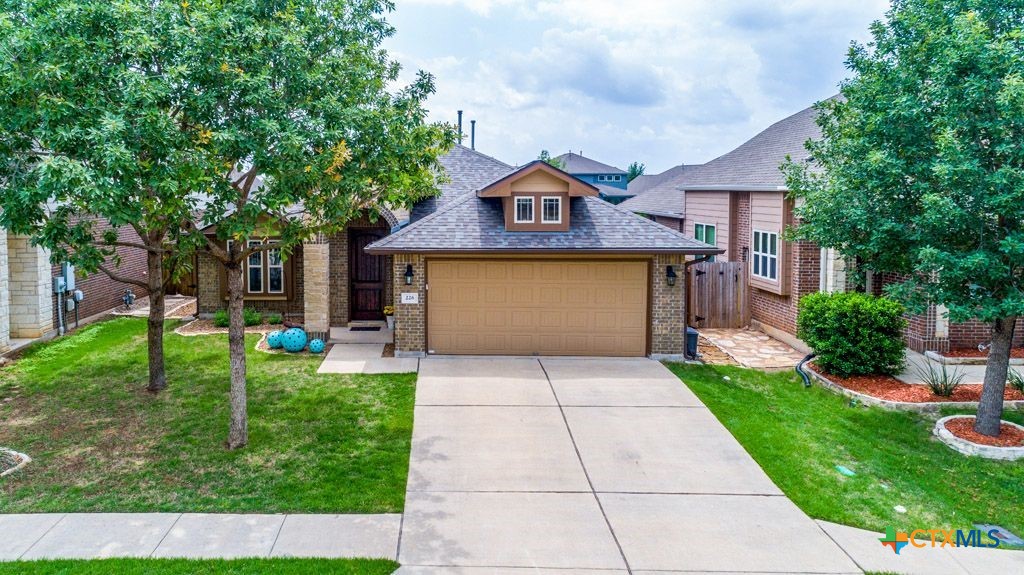
226 Pincea Pl, San Marcos, TX 78666
$-1,311
Cash flow
-16.5%
Cash-on-Cash Return
1.9%
Cap rate
0.5%
Rent to Value Ratio
Active
$750,000
4
bds
|
3
ba
|
2,412
sqft
|
built
2000
366 Arrow Hl, San Marcos, TX 78666
$-2,511
Cash flow
-17.5%
Cash-on-Cash Return
1.7%
Cap rate
0.3%
Rent to Value Ratio
Active
$989,000
3
bds
|
2
ba
|
1,816
sqft
|
built
1998
504 Oak Grove Rd, San Marcos, TX 78666
$-3,143
Cash flow
-16.6%
Cash-on-Cash Return
1.9%
Cap rate
0.3%
Rent to Value Ratio
Active
$317,800
3
bds
|
3
ba
|
1,920
sqft
|
built
2013
201 Trestle Tree, San Marcos, TX 78666
$-677
Cash flow
-11.1%
Cash-on-Cash Return
3.1%
Cap rate
0.6%
Rent to Value Ratio
Active
$639,995
4
bds
|
5
ba
|
3,080
sqft
|
built
2023
422 Quiet Oak Rd, San Marcos, TX 78666
$-1,152
Cash flow
-9.4%
Cash-on-Cash Return
3.5%
Cap rate
0.6%
Rent to Value Ratio

Active
$599,000
2
bds
|
2
ba
|
2,017
sqft
|
built
2022
1435 Dancing Oak Ln, San Marcos, TX 78666
$-2,109
Cash flow
-18.4%
Cash-on-Cash Return
1.5%
Cap rate
0.5%
Rent to Value Ratio
Active
$275,000
3
bds
|
2
ba
|
1,529
sqft
|
built
2009
214 Silo St, San Marcos, TX 78666
$-732
Cash flow
-13.9%
Cash-on-Cash Return
2.5%
Cap rate
0.7%
Rent to Value Ratio
Active
$269,500
3
bds
|
2
ba
|
1,373
sqft
|
built
2012
421 Capistrano Dr, San Marcos, TX 78666
$-471
Cash flow
-9.1%
Cash-on-Cash Return
3.6%
Cap rate
0.7%
Rent to Value Ratio
Active
$425,000
4
bds
|
4
ba
|
3,040
sqft
|
built
2018
209 Sky Springs Pass, San Marcos, TX 78666
$-944
Cash flow
-11.6%
Cash-on-Cash Return
3.0%
Cap rate
0.7%
Rent to Value Ratio
Active
$309,900
4
bds
|
2
ba
|
1,734
sqft
|
built
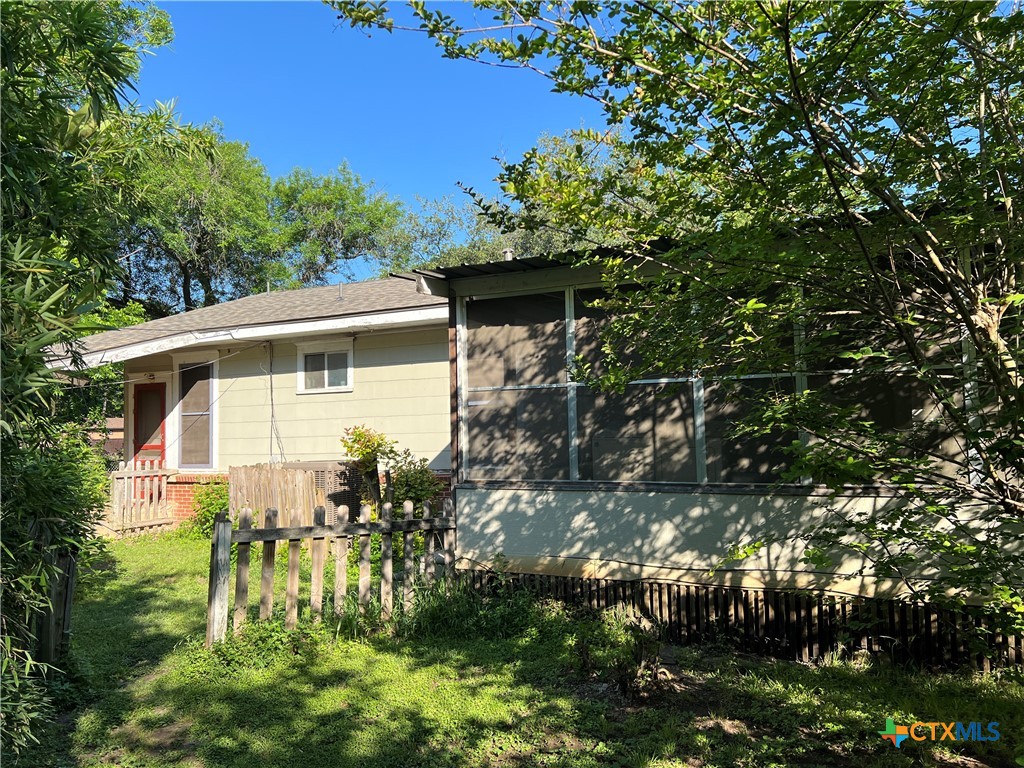
1926 Nevada St, San Marcos, TX 78666
$-645
Cash flow
-10.9%
Cash-on-Cash Return
3.2%
Cap rate
0.6%
Rent to Value Ratio
Active
$919,000
4
bds
|
3
ba
|
3,188
sqft
|
built
1996
1100 Appalachian Trl, San Marcos, TX 78666
$-2,327
Cash flow
-13.2%
Cash-on-Cash Return
2.6%
Cap rate
0.4%
Rent to Value Ratio
Active
$650,000
4
bds
|
4
ba
|
2,607
sqft
|
built
2015
1919 Los Santos Dr, San Marcos, TX 78666
$-1,974
Cash flow
-15.8%
Cash-on-Cash Return
2.0%
Cap rate
0.5%
Rent to Value Ratio
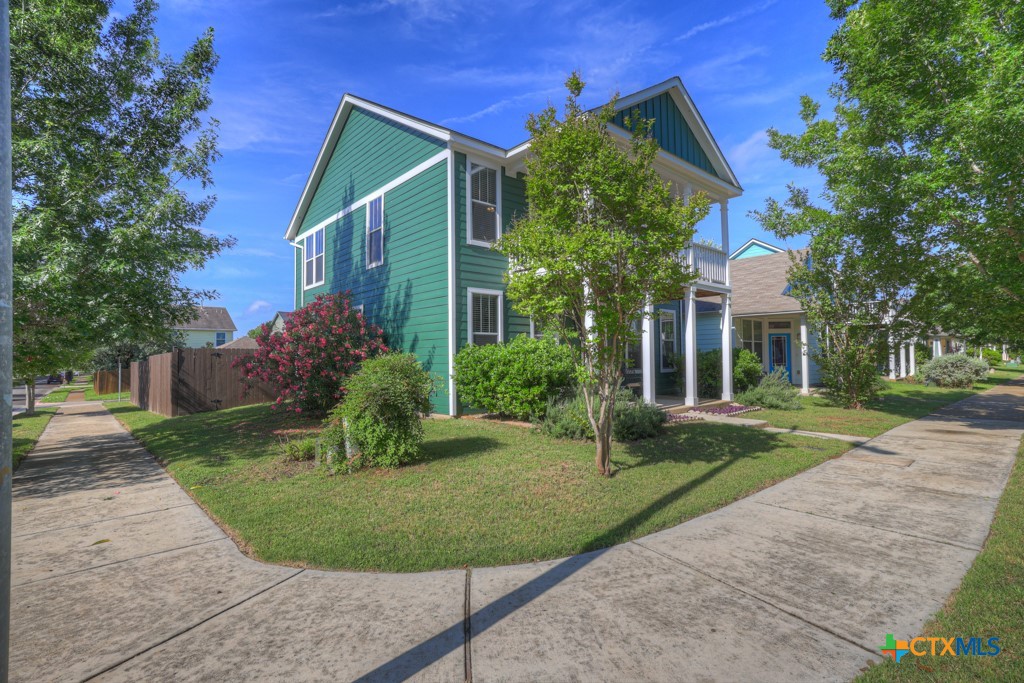
Pending
$299,000
3
bds
|
3
ba
|
1,730
sqft
|
built
2018
302 Mossycup Dr, San Marcos, TX 78666
$-168
Cash flow
-2.9%
Cash-on-Cash Return
5.0%
Cap rate
0.9%
Rent to Value Ratio
Active
$399,900
4
bds
|
3
ba
|
2,143
sqft
|
built
2017
229 Split Rail Dr, San Marcos, TX 78666
$-984
Cash flow
-12.8%
Cash-on-Cash Return
2.7%
Cap rate
0.6%
Rent to Value Ratio
Active
$550,000
4
bds
|
3
ba
|
2,593
sqft
|
built
1982
703 Stagecoach Trl, San Marcos, TX 78666
$-1,171
Cash flow
-11.1%
Cash-on-Cash Return
3.1%
Cap rate
0.5%
Rent to Value Ratio
Active
$589,000
2
bds
|
3
ba
|
1,827
sqft
|
built
2017
233 Hopping Peach St, San Marcos, TX 78666
$-1,874
Cash flow
-16.6%
Cash-on-Cash Return
1.9%
Cap rate
0.5%
Rent to Value Ratio
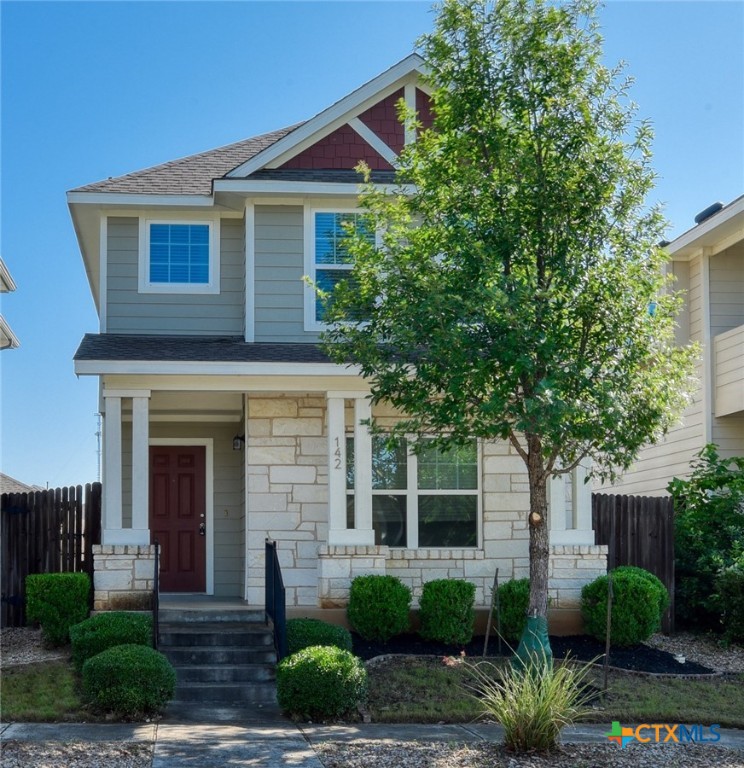
Active
$249,000
3
bds
|
3
ba
|
1,244
sqft
|
built
2016
142 Gambel Oak Way, San Marcos, TX 78666
$-431
Cash flow
-9.0%
Cash-on-Cash Return
3.6%
Cap rate
0.7%
Rent to Value Ratio
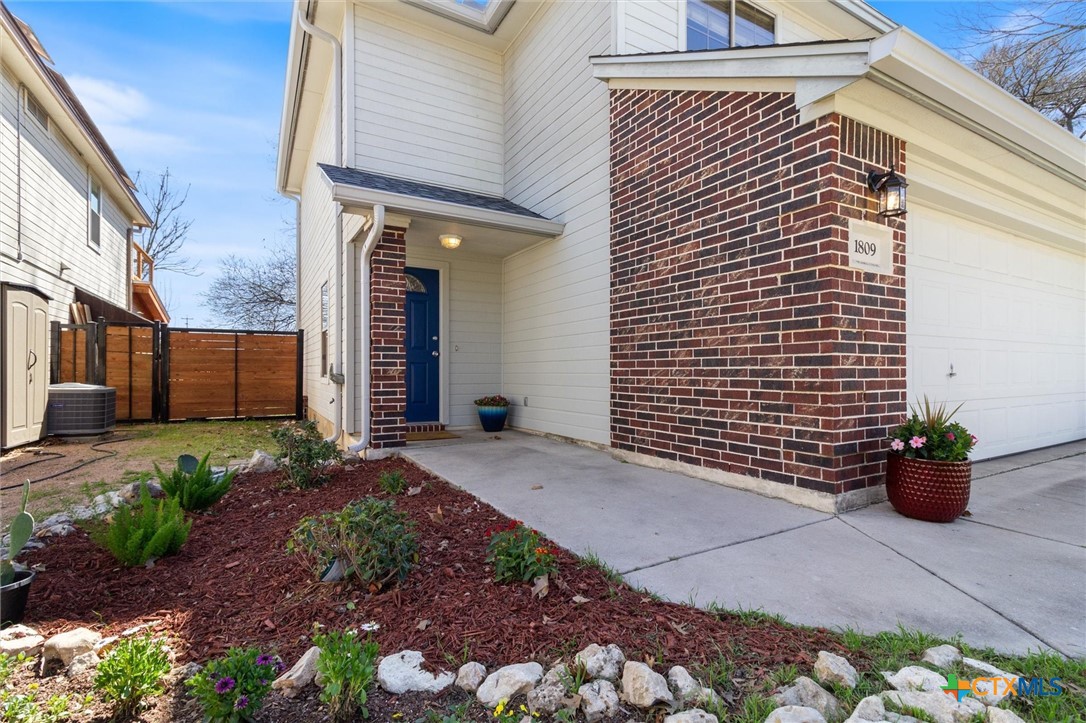
Active
$315,000
3
bds
|
3
ba
|
1,449
sqft
|
built
1999
1809 Pearce Ct, San Marcos, TX 78666
$-657
Cash flow
-10.9%
Cash-on-Cash Return
3.2%
Cap rate
0.6%
Rent to Value Ratio
Active
$549,000
4
bds
|
5
ba
|
3,236
sqft
|
built
2015
702 Old Settlers Dr, San Marcos, TX 78666
$-1,714
Cash flow
-16.3%
Cash-on-Cash Return
1.9%
Cap rate
0.5%
Rent to Value Ratio
Active
$599,000
4
bds
|
3
ba
|
2,380
sqft
|
built
1954
615 Dale Dr, San Marcos, TX 78666
$-2,122
Cash flow
-18.5%
Cash-on-Cash Return
1.4%
Cap rate
0.4%
Rent to Value Ratio
Active
$415,000
4
bds
|
3
ba
|
2,696
sqft
|
built
2002
1434 Meadow Pkwy, San Marcos, TX 78666
$-985
Cash flow
-12.4%
Cash-on-Cash Return
2.8%
Cap rate
0.6%
Rent to Value Ratio
Active
$325,000
3
bds
|
2
ba
|
1,598
sqft
|
built
2019
432 Lacey Oak Loop, San Marcos, TX 78666
$-595
Cash flow
-9.6%
Cash-on-Cash Return
3.5%
Cap rate
0.7%
Rent to Value Ratio
Active
$335,000
3
bds
|
3
ba
|
2,072
sqft
|
built
2024
109 Seminole Dr, San Marcos, TX 78666
n/a
Cash flow
n/a
Cash-on-Cash Return
n/a
Cap rate
n/a
Rent to Value Ratio
Active
$284,900
3
bds
|
2
ba
|
1,415
sqft
|
built
2019
235 Mossycup Dr, San Marcos, TX 78666
$-616
Cash flow
-11.3%
Cash-on-Cash Return
3.1%
Cap rate
0.7%
Rent to Value Ratio
Active
$548,500
4
bds
|
3
ba
|
2,337
sqft
|
built
1972
1319 Mustang Ln, San Marcos, TX 78666
$-1,486
Cash flow
-14.1%
Cash-on-Cash Return
2.4%
Cap rate
0.4%
Rent to Value Ratio
Active
$340,900
4
bds
|
2
ba
|
1,717
sqft
|
built
2021
244 Spotted Bass Ln, San Marcos, TX 78666
$-680
Cash flow
-10.4%
Cash-on-Cash Return
3.3%
Cap rate
0.6%
Rent to Value Ratio
Active
$338,000
3
bds
|
2
ba
|
1,566
sqft
|
built
2023
111 Merriman Rd, San Marcos, TX 78666
$-220
Cash flow
-3.4%
Cash-on-Cash Return
4.9%
Cap rate
0.6%
Rent to Value Ratio
Active
$789,900
3
bds
|
3
ba
|
1,872
sqft
|
built
1997
309 Oakwood Loop, San Marcos, TX 78666
$-1,599
Cash flow
-10.6%
Cash-on-Cash Return
3.2%
Cap rate
0.4%
Rent to Value Ratio
Active
$295,000
3
bds
|
2
ba
|
1,350
sqft
|
built
2001
127 Dolly St, San Marcos, TX 78666
$-589
Cash flow
-10.4%
Cash-on-Cash Return
3.3%
Cap rate
0.6%
Rent to Value Ratio
Active
$268,000
3
bds
|
2
ba
|
1,144
sqft
|
built
2002
1128 Overlook Way, San Marcos, TX 78666
$-458
Cash flow
-8.9%
Cash-on-Cash Return
3.6%
Cap rate
0.7%
Rent to Value Ratio
Active
$825,000
3
bds
|
2
ba
|
2,394
sqft
|
built
1987
322 Oakwood Loop, San Marcos, TX 78666
$-3,570
Cash flow
-22.6%
Cash-on-Cash Return
0.5%
Cap rate
0.2%
Rent to Value Ratio
Active
$289,000
3
bds
|
2
ba
|
1,539
sqft
|
built
2020
144 Lyndon Dr, San Marcos, TX 78666
$-608
Cash flow
-11.0%
Cash-on-Cash Return
3.2%
Cap rate
0.7%
Rent to Value Ratio
Active
$2,500,000
3
bds
|
2
ba
|
1,767
sqft
|
built
1989
101 Rancho Encino Dr, San Marcos, TX 78666
$-10,196
Cash flow
-21.3%
Cash-on-Cash Return
0.8%
Cap rate
0.2%
Rent to Value Ratio
Active
$2,249,999
5
bds
|
5
ba
|
3,926
sqft
|
built
1999
1660 W Mc Carty Ln, San Marcos, TX 78666
$-6,541
Cash flow
-15.2%
Cash-on-Cash Return
2.2%
Cap rate
0.3%
Rent to Value Ratio
Active
$359,000
4
bds
|
3
ba
|
2,372
sqft
|
built
2021
630 Golden Grove Pkwy, San Marcos, TX 78666
$-663
Cash flow
-9.6%
Cash-on-Cash Return
3.5%
Cap rate
0.7%
Rent to Value Ratio
Active
$369,999
4
bds
|
3
ba
|
2,560
sqft
|
built
2021
633 Golden Grove Pkwy, San Marcos, TX 78666
$-792
Cash flow
-11.2%
Cash-on-Cash Return
3.1%
Cap rate
0.7%
Rent to Value Ratio