San Marcos, TX Investment Properties for Sale
Browse homes for sale and investment properties in San Marcos, TX. Refine your search by price, property type, or more.
Best cash flowing properties in San Marcos, TX
Active
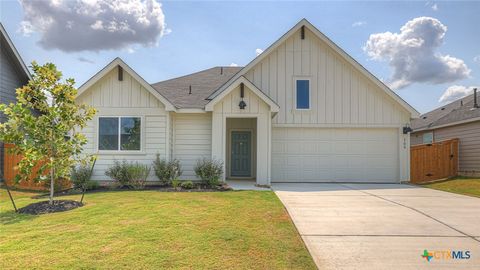
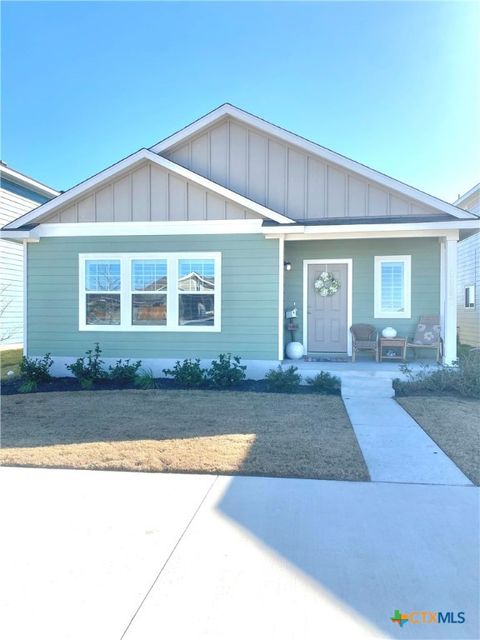
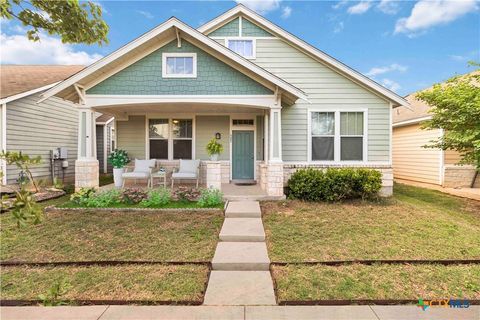
$312,990
3
bds
|
2
ba
|
1,253
sqft
|
built
2025
108 Flora Vista St, San Marcos, TX 78666
$0
Cash flow
n/a
Cash-on-Cash Return
n/a
Cap rate
n/a
Rent to Value Ratio
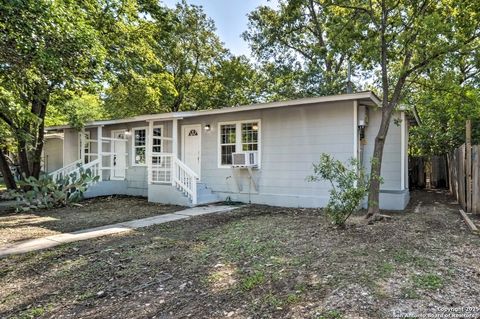
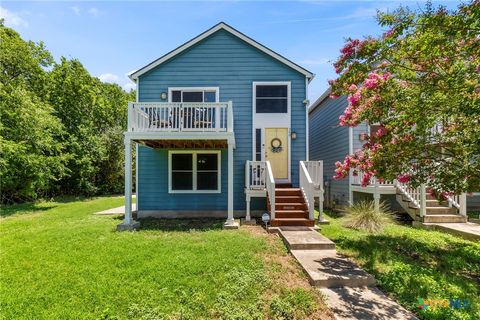
Active
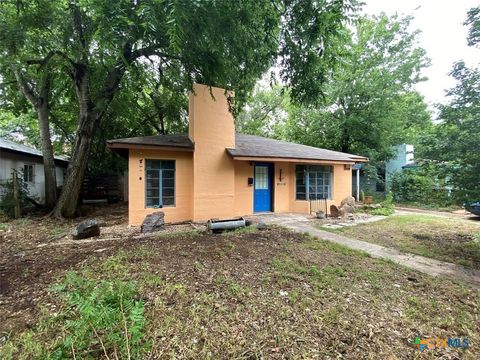
$197,500
2
bds
|
1
ba
|
853
sqft
|
built
1949
948 Sycamore St, San Marcos, TX 78666
$-208
Cash flow
-5.5%
Cash-on-Cash Return
4.4%
Cap rate
0.7%
Rent to Value Ratio
100 out of 430 properties for sale in San Marcos, TX
Limited Results Shown
Create a free account, or log in to reveal all property listings and enjoy the complete experience.
Active
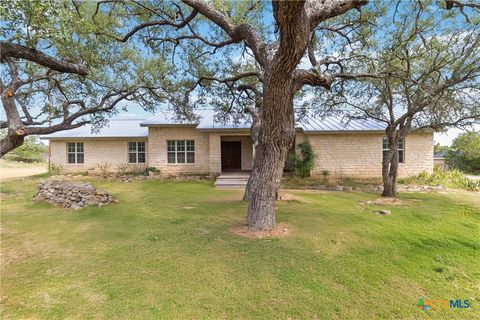
$589,000
3
bds
|
2
ba
|
1,829
sqft
|
built
1996
124 Turkey Trail Dr, San Marcos, TX 78666
$-1,414
Cash flow
-12.5%
Cash-on-Cash Return
2.8%
Cap rate
0.5%
Rent to Value Ratio
Active
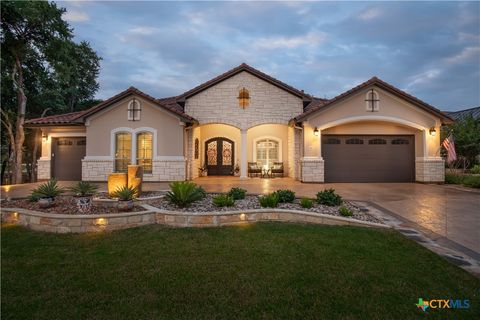
$985,000
2
bds
|
3
ba
|
2,802
sqft
|
built
2018
316 Leaping Holly St, San Marcos, TX 78666
$-3,714
Cash flow
-19.7%
Cash-on-Cash Return
1.2%
Cap rate
0.4%
Rent to Value Ratio
Active
$293,500
3
bds
|
2
ba
|
1,415
sqft
|
built
2021
357 Mallard Loop, San Marcos, TX 78666
$-273
Cash flow
-4.9%
Cash-on-Cash Return
4.6%
Cap rate
0.7%
Rent to Value Ratio
Active
$1,170,000
3
bds
|
3
ba
|
2,460
sqft
|
built
2019
117 Balancing Laurel, San Marcos, TX 78666
$-4,554
Cash flow
-20.3%
Cash-on-Cash Return
1.0%
Cap rate
0.3%
Rent to Value Ratio
Active
$462,859
2
bds
|
2
ba
|
1,796
sqft
|
built
2025
204 Sandbar Dr, San Marcos, TX 78666
$-1,252
Cash flow
-14.1%
Cash-on-Cash Return
2.4%
Cap rate
0.4%
Rent to Value Ratio
Active
$750,000
1
bds
|
1
ba
|
540
sqft
|
built
2022
735 Old Zorn Rd, San Marcos, TX 78666
$-2,445
Cash flow
-17.0%
Cash-on-Cash Return
1.8%
Cap rate
0.2%
Rent to Value Ratio
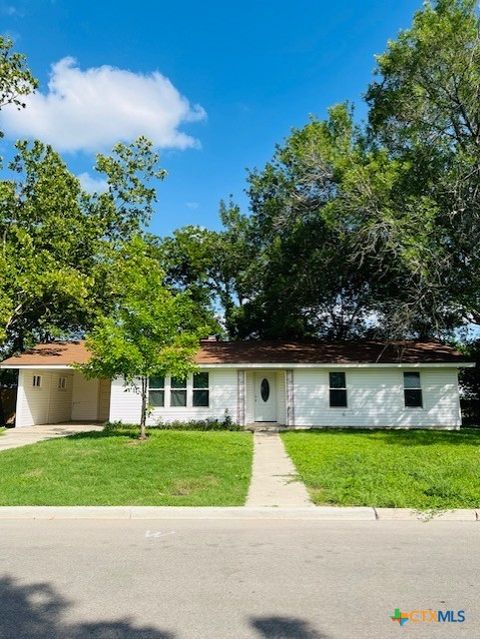
Active
$324,900
5
bds
|
0
ba
|
1,497
sqft
|
built
1955
1026 Haynes St, San Marcos, TX 78666
$-913
Cash flow
-14.7%
Cash-on-Cash Return
2.3%
Cap rate
0.5%
Rent to Value Ratio
Active
$285,000
3
bds
|
2
ba
|
1,738
sqft
|
built
1980
616 Conway Dr, San Marcos, TX 78666
$-555
Cash flow
-10.2%
Cash-on-Cash Return
3.3%
Cap rate
0.7%
Rent to Value Ratio
Active
$359,000
2
bds
|
2
ba
|
1,372
sqft
|
built
2021
209 Eagle Dr, San Marcos, TX 78666
$-802
Cash flow
-11.7%
Cash-on-Cash Return
3.0%
Cap rate
0.6%
Rent to Value Ratio
Active
$269,999
3
bds
|
3
ba
|
1,839
sqft
|
built
2017
104 Blair Ct, San Marcos, TX 78666
$-556
Cash flow
-10.7%
Cash-on-Cash Return
3.2%
Cap rate
0.7%
Rent to Value Ratio
Active
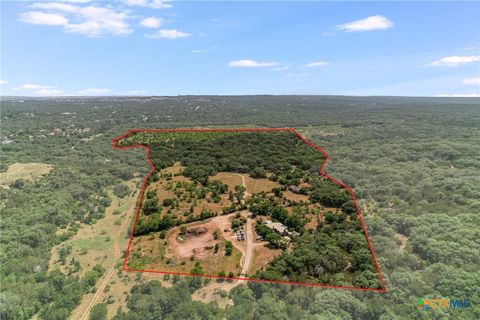
$1,999,000
5
bds
|
5
ba
|
3,926
sqft
|
built
1999
1660 W Mc Carty Ln, San Marcos, TX 78666
$-5,427
Cash flow
-14.2%
Cash-on-Cash Return
2.4%
Cap rate
0.4%
Rent to Value Ratio
Active
$1,600,000
2
bds
|
0
ba
|
5,012
sqft
|
built
1981
101 Hunters Glen Dr, San Marcos, TX 78666
$-6,167
Cash flow
-20.1%
Cash-on-Cash Return
1.1%
Cap rate
0.2%
Rent to Value Ratio
Active
$599,000
2
bds
|
4
ba
|
2,242
sqft
|
built
2001
1795 Falconwood Dr, San Marcos, TX 78666
$-1,276
Cash flow
-11.1%
Cash-on-Cash Return
3.1%
Cap rate
0.6%
Rent to Value Ratio
Active
$329,000
3
bds
|
2
ba
|
1,175
sqft
|
built
1983
500 Park Pl, San Marcos, TX 78666
$-774
Cash flow
-12.3%
Cash-on-Cash Return
2.9%
Cap rate
0.5%
Rent to Value Ratio
Active
$295,000
3
bds
|
3
ba
|
1,628
sqft
|
built
2015
340 Trestle Tree, San Marcos, TX 78666
$-999
Cash flow
-17.7%
Cash-on-Cash Return
1.6%
Cap rate
0.6%
Rent to Value Ratio
Active
$599,400
4
bds
|
3
ba
|
2,916
sqft
|
built
2022
412 Pin Cherry Pass, San Marcos, TX 78666
$-1,399
Cash flow
-12.2%
Cash-on-Cash Return
2.9%
Cap rate
0.6%
Rent to Value Ratio

Active
$665,000
5
bds
|
4
ba
|
2,527
sqft
|
built
2000
1600 Alpine Trl, San Marcos, TX 78666
$-1,533
Cash flow
-12.0%
Cash-on-Cash Return
2.9%
Cap rate
0.5%
Rent to Value Ratio
Active
$359,000
3
bds
|
2
ba
|
1,768
sqft
|
built
1986
1157 Lago Vista St, San Marcos, TX 78666
$-1,071
Cash flow
-15.6%
Cash-on-Cash Return
2.1%
Cap rate
0.4%
Rent to Value Ratio
Active
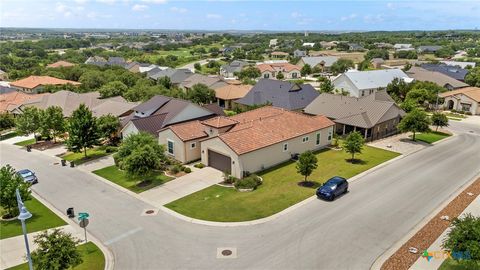
$609,929
4
bds
|
4
ba
|
3,326
sqft
|
built
2015
913 Overcup Dr, San Marcos, TX 78666
$-2,074
Cash flow
-17.7%
Cash-on-Cash Return
1.6%
Cap rate
0.4%
Rent to Value Ratio
Active
$269,990
3
bds
|
2
ba
|
1,424
sqft
|
built
2020
1157 Esplanade Pkwy, San Marcos, TX 78666
$-450
Cash flow
-8.7%
Cash-on-Cash Return
3.7%
Cap rate
0.7%
Rent to Value Ratio
Active
$2,400,000
4
bds
|
2
ba
|
2,838
sqft
|
built
2011
1750 Craddock Ave, San Marcos, TX 78666
$-8,845
Cash flow
-19.2%
Cash-on-Cash Return
1.3%
Cap rate
0.2%
Rent to Value Ratio
Active
$595,000
2
bds
|
3
ba
|
2,084
sqft
|
built
2017
249 Hopping Peach St, San Marcos, TX 78666
$-1,695
Cash flow
-14.9%
Cash-on-Cash Return
2.3%
Cap rate
0.5%
Rent to Value Ratio
Active
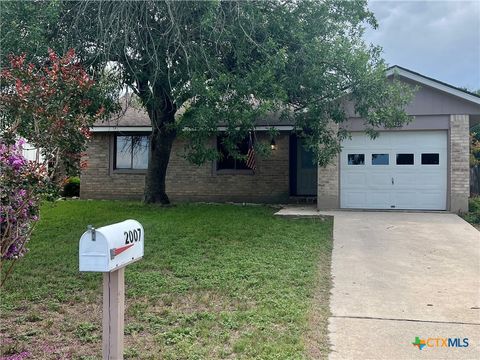
$269,500
3
bds
|
2
ba
|
1,128
sqft
|
built
1988
2007 Castle Gate Cir, San Marcos, TX 78666
$-480
Cash flow
-9.3%
Cash-on-Cash Return
3.5%
Cap rate
0.7%
Rent to Value Ratio
Active
$289,000
4
bds
|
3
ba
|
2,096
sqft
|
built
2016
323 Rachel St, San Marcos, TX 78666
$-418
Cash flow
-7.5%
Cash-on-Cash Return
3.9%
Cap rate
0.8%
Rent to Value Ratio
Active
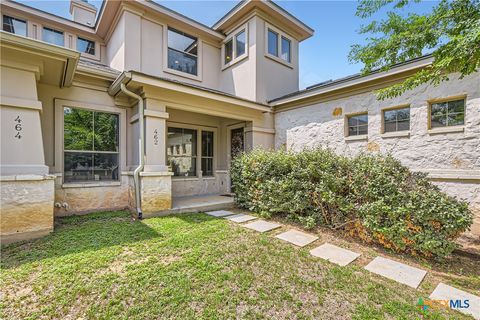
$399,000
3
bds
|
3
ba
|
2,303
sqft
|
built
2011
462 Stagecoach Trl, San Marcos, TX 78666
$-865
Cash flow
-11.3%
Cash-on-Cash Return
3.1%
Cap rate
0.6%
Rent to Value Ratio

Active
$275,000
3
bds
|
2
ba
|
1,587
sqft
|
built
2010
306 Wild Plum, San Marcos, TX 78666
$-520
Cash flow
-9.9%
Cash-on-Cash Return
3.4%
Cap rate
0.7%
Rent to Value Ratio

Active
$359,000
4
bds
|
2
ba
|
1,883
sqft
|
built
2017
124 Mary Max Cir, San Marcos, TX 78666
$-717
Cash flow
-10.4%
Cash-on-Cash Return
3.3%
Cap rate
0.6%
Rent to Value Ratio
Active
$1,080,000
4
bds
|
4
ba
|
3,546
sqft
|
built
1999
421 Thurman Rd, San Marcos, TX 78666
$-3,498
Cash flow
-16.9%
Cash-on-Cash Return
1.8%
Cap rate
0.4%
Rent to Value Ratio

Active
$338,500
3
bds
|
2
ba
|
1,713
sqft
|
built
1994
2203 Lancaster St, San Marcos, TX 78666
$-722
Cash flow
-11.1%
Cash-on-Cash Return
3.1%
Cap rate
0.6%
Rent to Value Ratio
Active
$349,900
4
bds
|
3
ba
|
2,196
sqft
|
built
2020
225 Horsemint Way, San Marcos, TX 78666
$-973
Cash flow
-14.5%
Cash-on-Cash Return
2.3%
Cap rate
0.6%
Rent to Value Ratio
Active
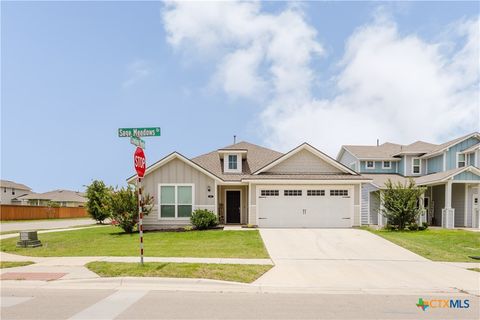
$287,500
3
bds
|
2
ba
|
1,544
sqft
|
built
2020
228 Sage Meadows Dr, San Marcos, TX 78666
$-525
Cash flow
-9.5%
Cash-on-Cash Return
3.5%
Cap rate
0.7%
Rent to Value Ratio
Active
$320,000
3
bds
|
2
ba
|
1,723
sqft
|
built
2024
123 Paul Pena Dr, San Marcos, TX 78666
$-239
Cash flow
-3.9%
Cash-on-Cash Return
4.8%
Cap rate
0.6%
Rent to Value Ratio

Active
$271,999
3
bds
|
2
ba
|
1,509
sqft
|
built
2022
101 Calgary Ln, San Marcos, TX 78666
$-480
Cash flow
-9.2%
Cash-on-Cash Return
3.6%
Cap rate
0.7%
Rent to Value Ratio

Active
$335,000
3
bds
|
2
ba
|
1,565
sqft
|
built
2014
234 Rock Bluff Ln, San Marcos, TX 78666
$-792
Cash flow
-12.3%
Cash-on-Cash Return
2.8%
Cap rate
0.6%
Rent to Value Ratio
Active
$519,000
2
bds
|
2
ba
|
1,754
sqft
|
built
2020
305 Dashing Sycamore St, San Marcos, TX 78666
$-1,372
Cash flow
-13.8%
Cash-on-Cash Return
2.5%
Cap rate
0.5%
Rent to Value Ratio

Active
$224,900
3
bds
|
2
ba
|
1,136
sqft
|
built
2020
310 Spiny Lizard Ln, San Marcos, TX 78666
$-315
Cash flow
-7.3%
Cash-on-Cash Return
4.0%
Cap rate
0.8%
Rent to Value Ratio

Active
$275,000
4
bds
|
2
ba
|
1,546
sqft
|
built
2020
109 Falco Ln, San Marcos, TX 78666
$-570
Cash flow
-10.8%
Cash-on-Cash Return
3.2%
Cap rate
0.7%
Rent to Value Ratio

Active
$1,150,000
3
bds
|
3
ba
|
4,040
sqft
|
built
2021
4401 Hilliard Rd, San Marcos, TX 78666
$-4,377
Cash flow
-19.9%
Cash-on-Cash Return
1.1%
Cap rate
0.3%
Rent to Value Ratio