San Marcos, TX Investment Properties for Sale
Browse homes for sale and investment properties in San Marcos, TX. Refine your search by price, property type, or more.
Best cash flowing properties in San Marcos, TX
Active
$319,900
2
bds
|
2
ba
|
1,274
sqft
|
built
2021
104 Balinese Cove, San Marcos, TX 78666
n/a
Cash flow
n/a
Cash-on-Cash Return
n/a
Cap rate
n/a
Rent to Value Ratio
Active
$285,000
3
bds
|
2
ba
|
1,530
sqft
|
built
2019
220 Sage Meadows Dr, San Marcos, TX 78666
$-112
Cash flow
-2.1%
Cash-on-Cash Return
5.8%
Cap rate
0.7%
Rent to Value Ratio
153 out of 415 properties for sale in San Marcos, TX
Limited Results Shown
Create a free account, or log in to reveal all property listings and enjoy the complete experience.
Active
$548,500
4
bds
|
3
ba
|
2,337
sqft
|
built
1972
1319 Mustang Ln, San Marcos, TX 78666
$-1,762
Cash flow
-16.8%
Cash-on-Cash Return
2.4%
Cap rate
0.4%
Rent to Value Ratio
Active
$489,900
1
bds
|
2
ba
|
1,284
sqft
|
built
2012
907 Deertrail Dr, San Marcos, TX 78666
$-881
Cash flow
-9.4%
Cash-on-Cash Return
4.1%
Cap rate
0.5%
Rent to Value Ratio
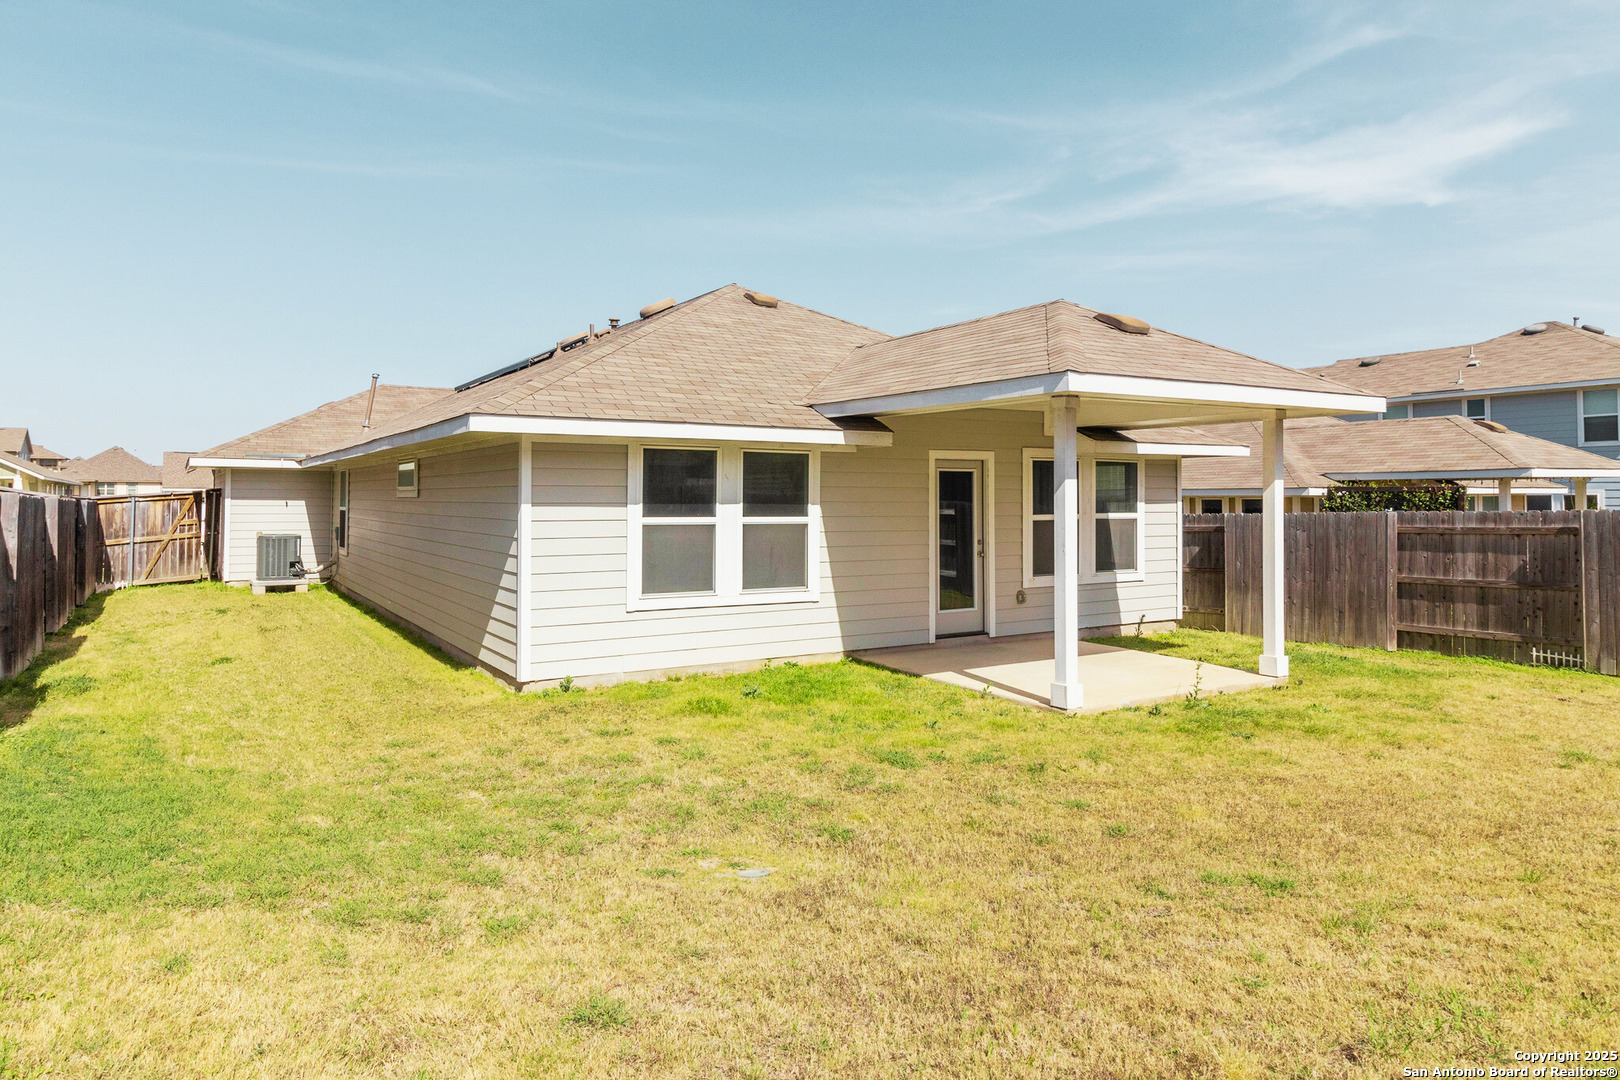
Active
$340,900
4
bds
|
2
ba
|
1,717
sqft
|
built
2021
244 Spotted Bass Ln, San Marcos, TX 78666
$-852
Cash flow
-13.0%
Cash-on-Cash Return
3.3%
Cap rate
0.6%
Rent to Value Ratio
Active
$338,000
3
bds
|
2
ba
|
1,566
sqft
|
built
2023
111 Merriman Rd, San Marcos, TX 78666
$-390
Cash flow
-6.0%
Cash-on-Cash Return
4.9%
Cap rate
0.6%
Rent to Value Ratio
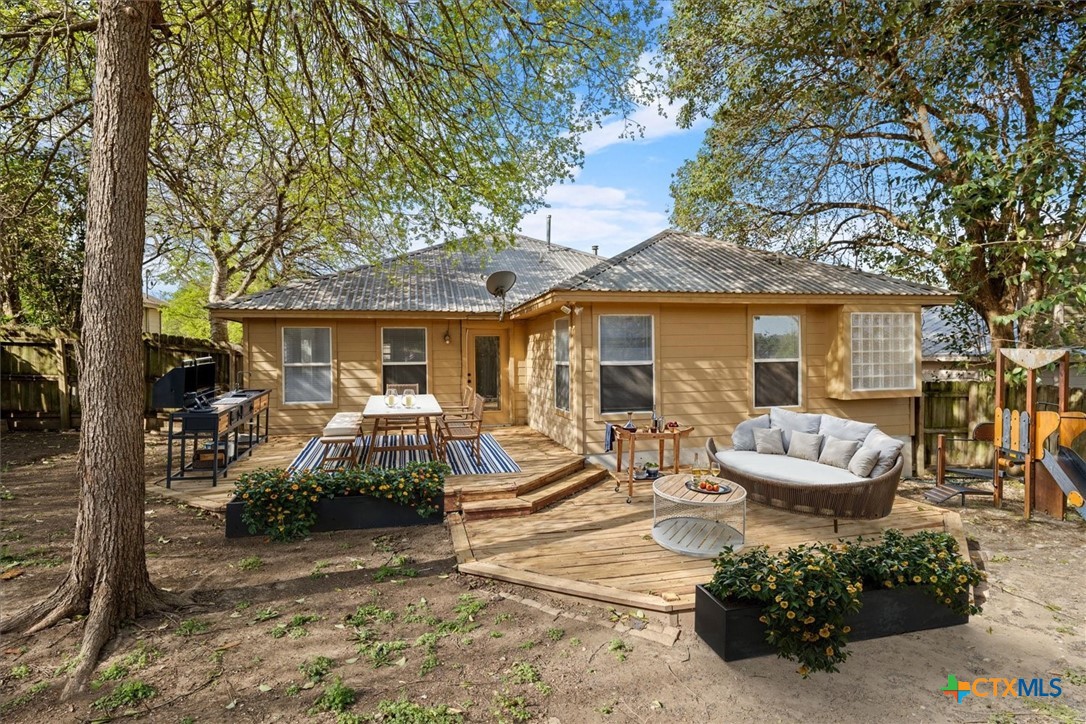
Active
$319,900
2
bds
|
2
ba
|
1,274
sqft
|
built
2021
104 Balinese Cove, San Marcos, TX 78666
n/a
Cash flow
n/a
Cash-on-Cash Return
n/a
Cap rate
n/a
Rent to Value Ratio
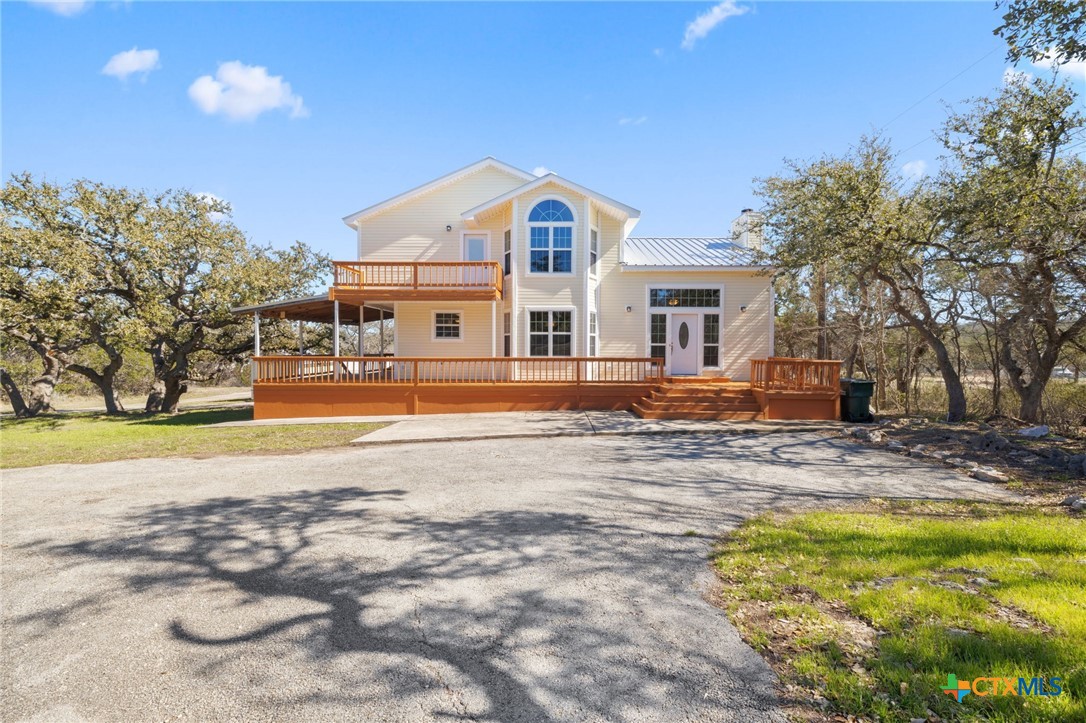
Active
$789,900
3
bds
|
3
ba
|
1,872
sqft
|
built
1997
309 Oakwood Loop, San Marcos, TX 78666
$-1,997
Cash flow
-13.2%
Cash-on-Cash Return
3.2%
Cap rate
0.4%
Rent to Value Ratio
Active
$2,000,000
bds
|
0
ba
|
7,396
sqft
|
built
527 W San Antonio St, San Marcos, TX 78666
$-9,960
Cash flow
-26.0%
Cash-on-Cash Return
0.3%
Cap rate
0.1%
Rent to Value Ratio
Active
$295,000
3
bds
|
2
ba
|
1,350
sqft
|
built
2001
127 Dolly St, San Marcos, TX 78666
$-738
Cash flow
-13.1%
Cash-on-Cash Return
3.3%
Cap rate
0.6%
Rent to Value Ratio
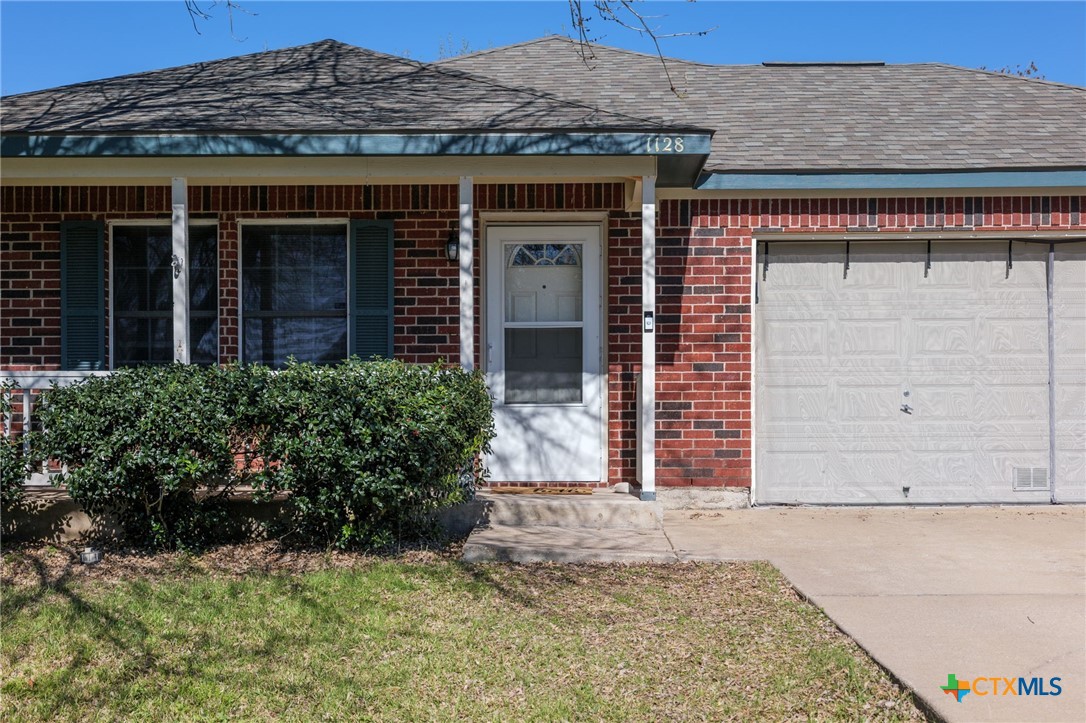
Active
$268,000
3
bds
|
2
ba
|
1,144
sqft
|
built
2002
1128 Overlook Way, San Marcos, TX 78666
$-593
Cash flow
-11.5%
Cash-on-Cash Return
3.6%
Cap rate
0.7%
Rent to Value Ratio
Active
$825,000
3
bds
|
2
ba
|
2,394
sqft
|
built
1987
322 Oakwood Loop, San Marcos, TX 78666
$-3,986
Cash flow
-25.2%
Cash-on-Cash Return
0.5%
Cap rate
0.2%
Rent to Value Ratio
Active
$289,000
3
bds
|
2
ba
|
1,539
sqft
|
built
2020
144 Lyndon Dr, San Marcos, TX 78666
$-753
Cash flow
-13.6%
Cash-on-Cash Return
3.2%
Cap rate
0.7%
Rent to Value Ratio
Active
$2,500,000
3
bds
|
2
ba
|
1,767
sqft
|
built
1989
101 Rancho Encino Dr, San Marcos, TX 78666
$-11,457
Cash flow
-23.9%
Cash-on-Cash Return
0.8%
Cap rate
0.2%
Rent to Value Ratio
Active
$2,249,999
5
bds
|
5
ba
|
3,926
sqft
|
built
1999
1660 W Mc Carty Ln, San Marcos, TX 78666
$-7,676
Cash flow
-17.8%
Cash-on-Cash Return
2.2%
Cap rate
0.3%
Rent to Value Ratio
Active
$359,000
4
bds
|
3
ba
|
2,372
sqft
|
built
2021
630 Golden Grove Pkwy, San Marcos, TX 78666
$-844
Cash flow
-12.3%
Cash-on-Cash Return
3.5%
Cap rate
0.7%
Rent to Value Ratio
Active
$200,000
2
bds
|
3
ba
|
1,168
sqft
|
built
1980
1602 Mill St, San Marcos, TX 78666
$-683
Cash flow
-17.8%
Cash-on-Cash Return
2.2%
Cap rate
0.8%
Rent to Value Ratio
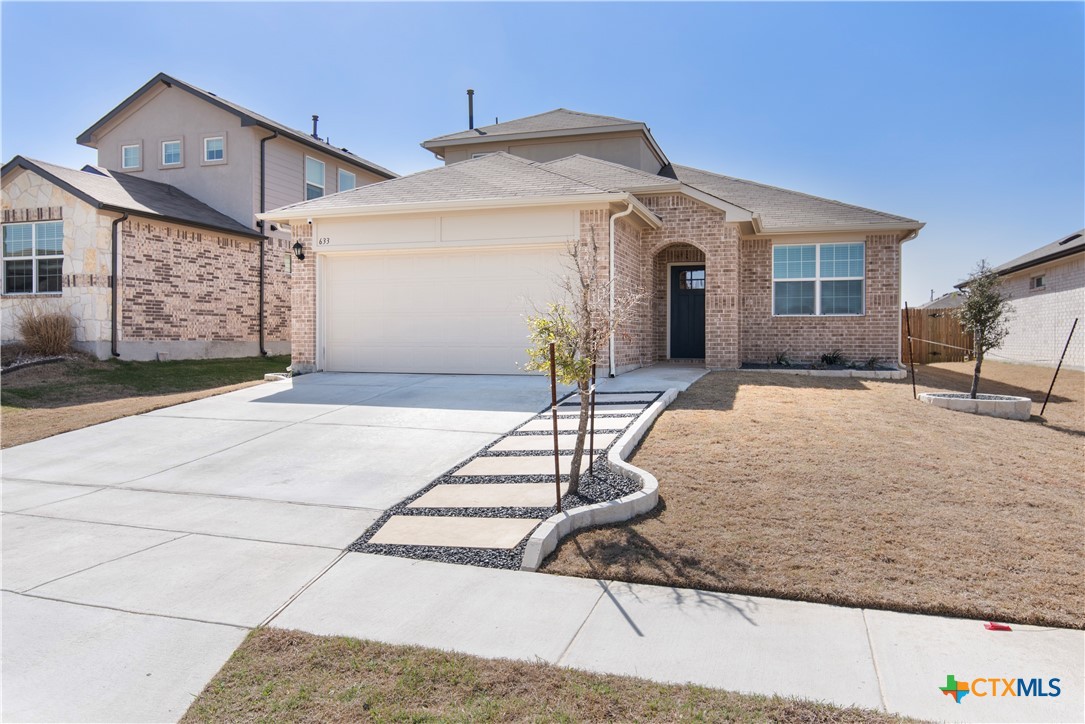
Active
$369,999
4
bds
|
3
ba
|
2,560
sqft
|
built
2021
633 Golden Grove Pkwy, San Marcos, TX 78666
$-979
Cash flow
-13.8%
Cash-on-Cash Return
3.1%
Cap rate
0.7%
Rent to Value Ratio
Active
$340,000
4
bds
|
3
ba
|
2,701
sqft
|
built
2022
428 Millbrook Blvd, San Marcos, TX 78666
$-430
Cash flow
-6.6%
Cash-on-Cash Return
4.8%
Cap rate
0.6%
Rent to Value Ratio
Active
$744,000
5
bds
|
4
ba
|
3,117
sqft
|
built
2010
2123 Annes Trl, San Marcos, TX 78666
$-2,299
Cash flow
-16.1%
Cash-on-Cash Return
2.6%
Cap rate
0.5%
Rent to Value Ratio
Active
$309,000
3
bds
|
2
ba
|
1,214
sqft
|
built
1998
1800 Pearce Ct, San Marcos, TX 78666
$-890
Cash flow
-15.0%
Cash-on-Cash Return
2.8%
Cap rate
0.6%
Rent to Value Ratio
Active
$305,000
3
bds
|
3
ba
|
1,336
sqft
|
built
2022
205 Duck Creek Trl, San Marcos, TX 78666
$-661
Cash flow
-11.3%
Cash-on-Cash Return
3.7%
Cap rate
0.7%
Rent to Value Ratio
Active
$165,000
2
bds
|
2
ba
|
720
sqft
|
built
1981
1624 Aquarena Springs Dr, San Marcos, TX 78666
$-236
Cash flow
-7.5%
Cash-on-Cash Return
4.6%
Cap rate
0.7%
Rent to Value Ratio
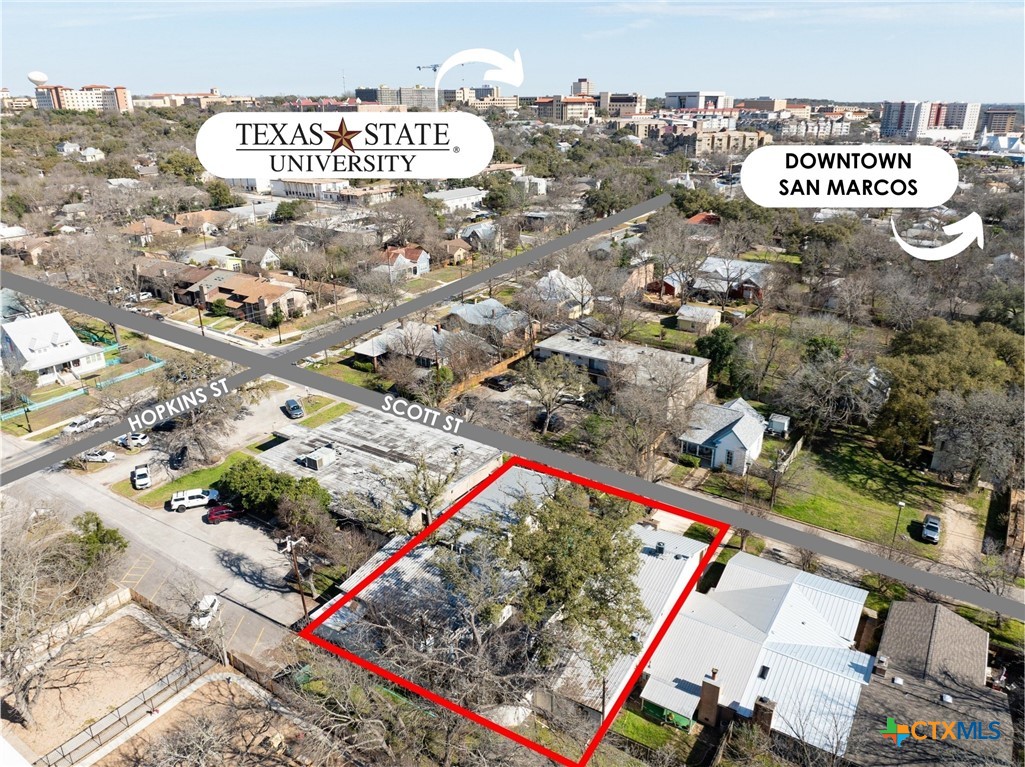
Active
$739,000
5
bds
|
5
ba
|
5,268
sqft
|
built
121 Scott St, San Marcos, TX 78666
$-3,175
Cash flow
-22.4%
Cash-on-Cash Return
1.1%
Cap rate
0.4%
Rent to Value Ratio
Active
$355,000
3
bds
|
2
ba
|
1,619
sqft
|
built
2022
273 Horsemint Way, San Marcos, TX 78666
$-418
Cash flow
-6.1%
Cash-on-Cash Return
4.9%
Cap rate
0.6%
Rent to Value Ratio
Active
$617,000
2
bds
|
3
ba
|
1,868
sqft
|
built
2019
517 Freeing Oak St, San Marcos, TX 78666
$-2,227
Cash flow
-18.8%
Cash-on-Cash Return
2.0%
Cap rate
0.5%
Rent to Value Ratio
Active under contract
$385,000
4
bds
|
2
ba
|
2,162
sqft
|
built
2022
337 Blue Oak Blvd, San Marcos, TX 78666
$-1,182
Cash flow
-16.0%
Cash-on-Cash Return
2.6%
Cap rate
0.6%
Rent to Value Ratio
Active
$465,000
3
bds
|
3
ba
|
2,462
sqft
|
built
2000
2216 Garden Ct, San Marcos, TX 78666
$-1,460
Cash flow
-16.4%
Cash-on-Cash Return
2.5%
Cap rate
0.6%
Rent to Value Ratio
Active
$294,999
4
bds
|
3
ba
|
2,332
sqft
|
built
2016
113 Wedgewood Way, San Marcos, TX 78666
$-711
Cash flow
-12.6%
Cash-on-Cash Return
3.4%
Cap rate
0.7%
Rent to Value Ratio
Active
$665,000
4
bds
|
4
ba
|
2,889
sqft
|
built
2023
840 Teakmill Trl, San Marcos, TX 78666
$-1,772
Cash flow
-13.9%
Cash-on-Cash Return
3.1%
Cap rate
0.6%
Rent to Value Ratio
Active
$1,100,000
bds
|
0
ba
|
5,238
sqft
|
built
2016
414 Henk Ln, San Marcos, TX 78666
$-4,181
Cash flow
-19.8%
Cash-on-Cash Return
1.7%
Cap rate
0.3%
Rent to Value Ratio
Pending
$349,000
2
bds
|
2
ba
|
1,920
sqft
|
built
2000
314 Harvard St, San Marcos, TX 78666
$-927
Cash flow
-13.9%
Cash-on-Cash Return
3.1%
Cap rate
0.6%
Rent to Value Ratio
Active
$285,000
3
bds
|
2
ba
|
1,530
sqft
|
built
2019
220 Sage Meadows Dr, San Marcos, TX 78666
$-112
Cash flow
-2.1%
Cash-on-Cash Return
5.8%
Cap rate
0.7%
Rent to Value Ratio
Active
$175,000
2
bds
|
2
ba
|
720
sqft
|
built
1982
1624 Aquarena Springs Dr, San Marcos, TX 78666
$-468
Cash flow
-14.0%
Cash-on-Cash Return
3.1%
Cap rate
0.7%
Rent to Value Ratio
Active
$328,000
3
bds
|
3
ba
|
1,342
sqft
|
built
1996
1931 Lisa Ln, San Marcos, TX 78666
$-895
Cash flow
-14.2%
Cash-on-Cash Return
3.0%
Cap rate
0.5%
Rent to Value Ratio
Active
$950,000
4
bds
|
3
ba
|
3,398
sqft
|
built
2018
609 Dancing Oak Ln, San Marcos, TX 78666
$-3,259
Cash flow
-17.9%
Cash-on-Cash Return
2.2%
Cap rate
0.5%
Rent to Value Ratio
Active
$700,000
3
bds
|
3
ba
|
2,479
sqft
|
built
2020
132 Drawing Maple St, San Marcos, TX 78666
$-2,611
Cash flow
-19.5%
Cash-on-Cash Return
1.8%
Cap rate
0.5%
Rent to Value Ratio
Active
$314,500
3
bds
|
3
ba
|
1,728
sqft
|
built
2019
1053 Esplanade Pkwy, San Marcos, TX 78666
$-991
Cash flow
-16.4%
Cash-on-Cash Return
2.5%
Cap rate
0.6%
Rent to Value Ratio
Active
$298,500
3
bds
|
2
ba
|
1,415
sqft
|
built
2021
357 Mallard Loop, San Marcos, TX 78666
$-447
Cash flow
-7.8%
Cash-on-Cash Return
4.5%
Cap rate
0.7%
Rent to Value Ratio
Active
$375,000
4
bds
|
3
ba
|
2,352
sqft
|
built
2020
237 Dylan Dr, San Marcos, TX 78666
$-352
Cash flow
-4.9%
Cash-on-Cash Return
5.2%
Cap rate
0.7%
Rent to Value Ratio
Active
$629,900
5
bds
|
3
ba
|
2,902
sqft
|
built
1994
303 Pampas Pass, San Marcos, TX 78666
$-1,611
Cash flow
-13.3%
Cash-on-Cash Return
3.2%
Cap rate
0.6%
Rent to Value Ratio
Active
$290,000
3
bds
|
3
ba
|
1,303
sqft
|
built
2019
1126 Esplanade Pkwy, San Marcos, TX 78666
$-363
Cash flow
-6.5%
Cash-on-Cash Return
4.8%
Cap rate
0.6%
Rent to Value Ratio