San Marcos, TX Investment Properties for Sale
Browse homes for sale and investment properties in San Marcos, TX. Refine your search by price, property type, or more.
Best cash flowing properties in San Marcos, TX
Active
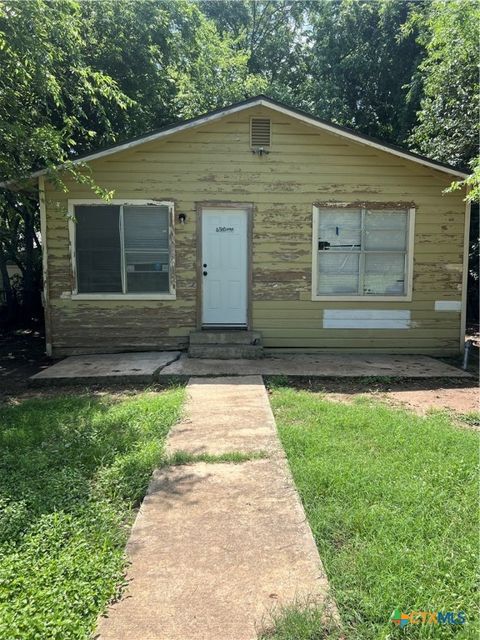
$178,000
2
bds
|
1
ba
|
720
sqft
|
built
1981
410 Railroad St, San Marcos, TX 78666
$-101
Cash flow
-3.0%
Cash-on-Cash Return
5.0%
Cap rate
0.8%
Rent to Value Ratio

Active
$117,000
1
bds
|
1
ba
|
441
sqft
|
built
1982
1624 Aquarena Springs Dr, San Marcos, TX 78666
$-242
Cash flow
-10.8%
Cash-on-Cash Return
3.8%
Cap rate
0.9%
Rent to Value Ratio
154 out of 433 properties for sale in San Marcos, TX
Limited Results Shown
Create a free account, or log in to reveal all property listings and enjoy the complete experience.
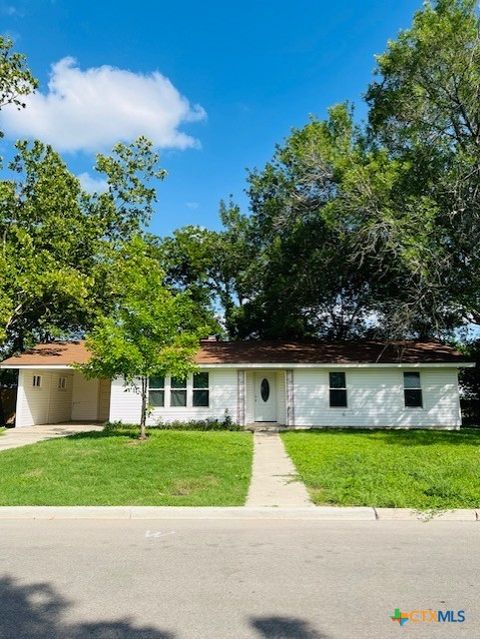
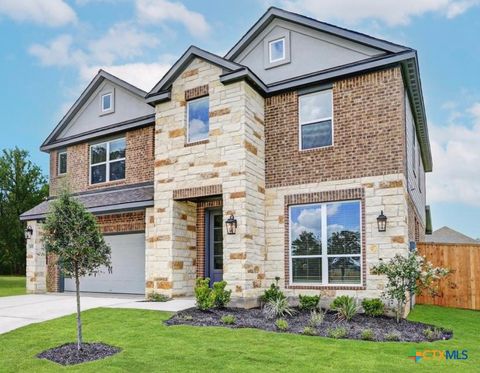
Active
$285,000
3
bds
|
2
ba
|
1,738
sqft
|
built
1980
616 Conway Dr, San Marcos, TX 78666
$-694
Cash flow
-12.7%
Cash-on-Cash Return
3.3%
Cap rate
0.7%
Rent to Value Ratio
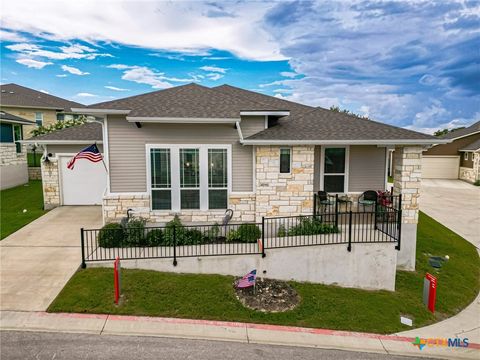
Active
$365,000
2
bds
|
2
ba
|
1,372
sqft
|
built
2021
209 Eagle Dr, San Marcos, TX 78666
$-830
Cash flow
-11.9%
Cash-on-Cash Return
2.9%
Cap rate
0.6%
Rent to Value Ratio
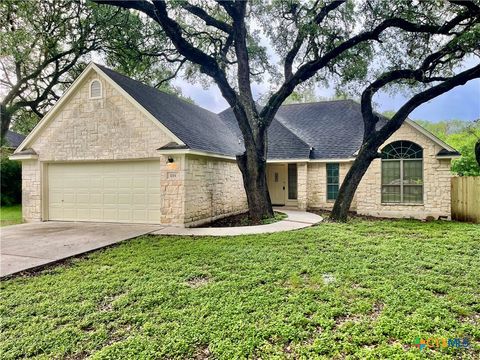
Active
$279,000
3
bds
|
2
ba
|
1,259
sqft
|
built
1998
1715 Ramona Cir, San Marcos, TX 78666
$-503
Cash flow
-9.4%
Cash-on-Cash Return
3.5%
Cap rate
0.6%
Rent to Value Ratio
Active
$1,600,000
2
bds
|
0
ba
|
5,012
sqft
|
built
1981
101 Hunters Glen Dr, San Marcos, TX 78666
$-6,167
Cash flow
-20.1%
Cash-on-Cash Return
1.1%
Cap rate
0.2%
Rent to Value Ratio
Active
$285,000
3
bds
|
3
ba
|
1,839
sqft
|
built
2017
104 Blair Ct, San Marcos, TX 78666
$-627
Cash flow
-11.5%
Cash-on-Cash Return
3.0%
Cap rate
0.6%
Rent to Value Ratio
Active
$1,999,000
5
bds
|
5
ba
|
3,926
sqft
|
built
1999
1660 W Mc Carty Ln, San Marcos, TX 78666
$-6,403
Cash flow
-16.7%
Cash-on-Cash Return
2.4%
Cap rate
0.4%
Rent to Value Ratio
Active
$649,000
2
bds
|
4
ba
|
2,242
sqft
|
built
2001
1795 Falconwood Dr, San Marcos, TX 78666
$-1,512
Cash flow
-12.2%
Cash-on-Cash Return
2.9%
Cap rate
0.5%
Rent to Value Ratio
Active
$429,995
4
bds
|
3
ba
|
2,386
sqft
|
built
2022
135 Lt John Decker Dr, San Marcos, TX 78666
$-1,017
Cash flow
-12.3%
Cash-on-Cash Return
2.8%
Cap rate
0.6%
Rent to Value Ratio
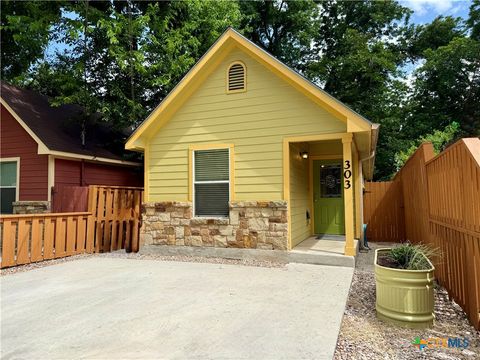
Active
$234,900
3
bds
|
2
ba
|
939
sqft
|
built
2011
303 Armstrong St, San Marcos, TX 78666
$-358
Cash flow
-8.0%
Cash-on-Cash Return
3.9%
Cap rate
0.7%
Rent to Value Ratio
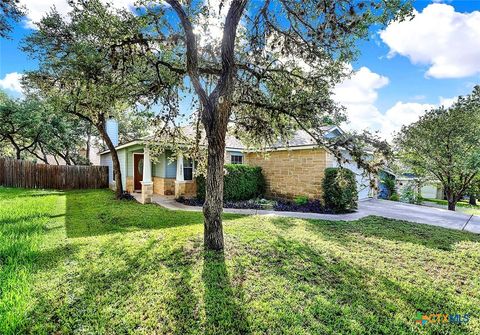
Active
$349,000
4
bds
|
2
ba
|
1,724
sqft
|
built
2004
2029 Northview Dr, San Marcos, TX 78666
$-792
Cash flow
-11.8%
Cash-on-Cash Return
3.0%
Cap rate
0.6%
Rent to Value Ratio
Active
$305,000
3
bds
|
3
ba
|
1,628
sqft
|
built
2015
340 Trestle Tree, San Marcos, TX 78666
$-1,046
Cash flow
-17.9%
Cash-on-Cash Return
1.6%
Cap rate
0.6%
Rent to Value Ratio
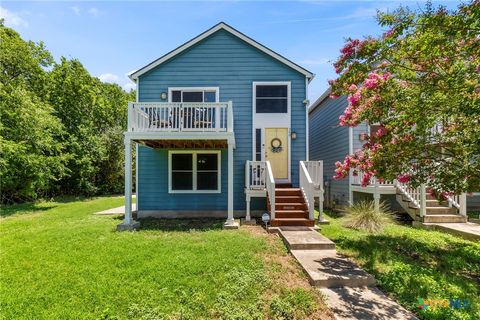
Active
$335,000
3
bds
|
2
ba
|
1,175
sqft
|
built
1983
500 Park Pl, San Marcos, TX 78666
$-802
Cash flow
-12.5%
Cash-on-Cash Return
2.8%
Cap rate
0.5%
Rent to Value Ratio
Active
$599,900
4
bds
|
3
ba
|
2,916
sqft
|
built
2022
412 Pin Cherry Pass, San Marcos, TX 78666
$-1,401
Cash flow
-12.2%
Cash-on-Cash Return
2.9%
Cap rate
0.6%
Rent to Value Ratio
Active
$178,000
2
bds
|
1
ba
|
720
sqft
|
built
1981
410 Railroad St, San Marcos, TX 78666
$-101
Cash flow
-3.0%
Cash-on-Cash Return
5.0%
Cap rate
0.8%
Rent to Value Ratio
Active
$399,999
5
bds
|
3
ba
|
2,586
sqft
|
built
2017
229 Mary Max Cir, San Marcos, TX 78666
$-820
Cash flow
-10.7%
Cash-on-Cash Return
3.2%
Cap rate
0.6%
Rent to Value Ratio

Active
$680,000
5
bds
|
4
ba
|
2,527
sqft
|
built
2000
1600 Alpine Trl, San Marcos, TX 78666
$-1,936
Cash flow
-14.9%
Cash-on-Cash Return
2.8%
Cap rate
0.5%
Rent to Value Ratio
Active
$369,000
3
bds
|
2
ba
|
1,768
sqft
|
built
1986
1157 Lago Vista St, San Marcos, TX 78666
$-1,118
Cash flow
-15.8%
Cash-on-Cash Return
2.0%
Cap rate
0.4%
Rent to Value Ratio
Active
$609,929
4
bds
|
4
ba
|
3,326
sqft
|
built
2015
913 Overcup Dr, San Marcos, TX 78666
$-2,074
Cash flow
-17.7%
Cash-on-Cash Return
1.6%
Cap rate
0.4%
Rent to Value Ratio
Active
$269,990
3
bds
|
2
ba
|
1,424
sqft
|
built
2020
1157 Esplanade Pkwy, San Marcos, TX 78666
$-450
Cash flow
-8.7%
Cash-on-Cash Return
3.7%
Cap rate
0.7%
Rent to Value Ratio
Active
$2,400,000
4
bds
|
2
ba
|
2,838
sqft
|
built
2011
1750 Craddock Ave, San Marcos, TX 78666
$-8,845
Cash flow
-19.2%
Cash-on-Cash Return
1.3%
Cap rate
0.2%
Rent to Value Ratio
Active
$605,000
2
bds
|
3
ba
|
2,084
sqft
|
built
2017
249 Hopping Peach St, San Marcos, TX 78666
$-1,742
Cash flow
-15.0%
Cash-on-Cash Return
2.2%
Cap rate
0.5%
Rent to Value Ratio

Active
$258,500
2
bds
|
1
ba
|
858
sqft
|
built
1984
402 N Fredericksburg St, San Marcos, TX 78666
$-718
Cash flow
-14.5%
Cash-on-Cash Return
2.9%
Cap rate
0.5%
Rent to Value Ratio
Active
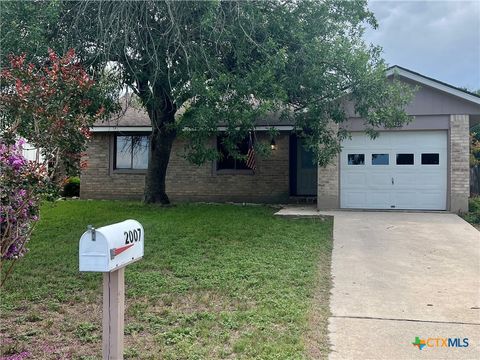
$269,500
3
bds
|
2
ba
|
1,128
sqft
|
built
1988
2007 Castle Gate Cir, San Marcos, TX 78666
$-612
Cash flow
-11.8%
Cash-on-Cash Return
3.5%
Cap rate
0.7%
Rent to Value Ratio

Active
$1,019,000
2
bds
|
3
ba
|
2,802
sqft
|
built
2018
316 Leaping Holly St, San Marcos, TX 78666
$-4,373
Cash flow
-22.4%
Cash-on-Cash Return
1.1%
Cap rate
0.3%
Rent to Value Ratio
Active
$299,000
4
bds
|
3
ba
|
2,096
sqft
|
built
2016
323 Rachel St, San Marcos, TX 78666
$-611
Cash flow
-10.7%
Cash-on-Cash Return
3.8%
Cap rate
0.7%
Rent to Value Ratio

Active
$324,900
3
bds
|
3
ba
|
1,471
sqft
|
built
2006
2009 Meadow View Dr, San Marcos, TX 78666
$-1,093
Cash flow
-17.6%
Cash-on-Cash Return
2.2%
Cap rate
0.6%
Rent to Value Ratio
Active
$405,000
3
bds
|
3
ba
|
2,303
sqft
|
built
2011
462 Stagecoach Trl, San Marcos, TX 78666
$-1,091
Cash flow
-14.1%
Cash-on-Cash Return
3.0%
Cap rate
0.6%
Rent to Value Ratio

Active
$295,000
3
bds
|
2
ba
|
1,587
sqft
|
built
2010
306 Wild Plum, San Marcos, TX 78666
$-736
Cash flow
-13.0%
Cash-on-Cash Return
3.3%
Cap rate
0.6%
Rent to Value Ratio

Active
$369,000
4
bds
|
2
ba
|
1,883
sqft
|
built
2017
124 Mary Max Cir, San Marcos, TX 78666
$-944
Cash flow
-13.3%
Cash-on-Cash Return
3.2%
Cap rate
0.6%
Rent to Value Ratio
Active
$1,300,000
4
bds
|
4
ba
|
3,546
sqft
|
built
1999
421 Thurman Rd, San Marcos, TX 78666
$-5,174
Cash flow
-20.8%
Cash-on-Cash Return
1.5%
Cap rate
0.3%
Rent to Value Ratio
Active
$349,900
4
bds
|
3
ba
|
2,196
sqft
|
built
2020
225 Horsemint Way, San Marcos, TX 78666
$-1,144
Cash flow
-17.1%
Cash-on-Cash Return
2.3%
Cap rate
0.6%
Rent to Value Ratio
Active
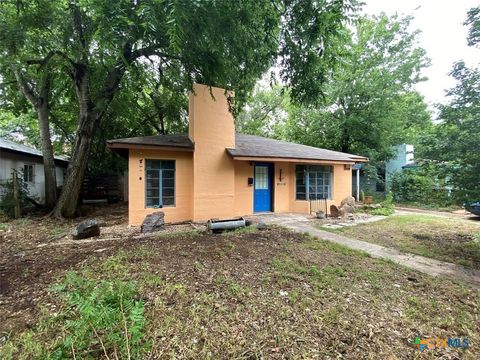
$198,900
2
bds
|
1
ba
|
853
sqft
|
built
1949
948 Sycamore St, San Marcos, TX 78666
$-311
Cash flow
-8.2%
Cash-on-Cash Return
4.4%
Cap rate
0.7%
Rent to Value Ratio

Active
$349,000
3
bds
|
2
ba
|
1,713
sqft
|
built
1994
2203 Lancaster St, San Marcos, TX 78666
$-942
Cash flow
-14.1%
Cash-on-Cash Return
3.0%
Cap rate
0.6%
Rent to Value Ratio
Active
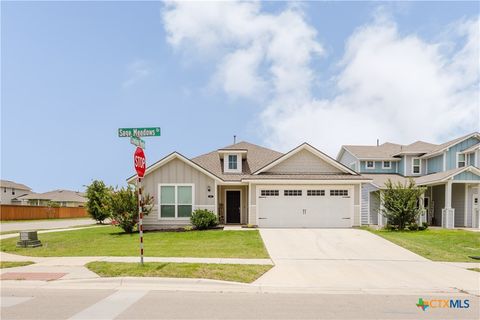
$294,000
3
bds
|
2
ba
|
1,544
sqft
|
built
2020
228 Sage Meadows Dr, San Marcos, TX 78666
$-699
Cash flow
-12.4%
Cash-on-Cash Return
3.4%
Cap rate
0.7%
Rent to Value Ratio
Active
$117,000
1
bds
|
1
ba
|
441
sqft
|
built
1982
1624 Aquarena Springs Dr, San Marcos, TX 78666
$-242
Cash flow
-10.8%
Cash-on-Cash Return
3.8%
Cap rate
0.9%
Rent to Value Ratio

Active
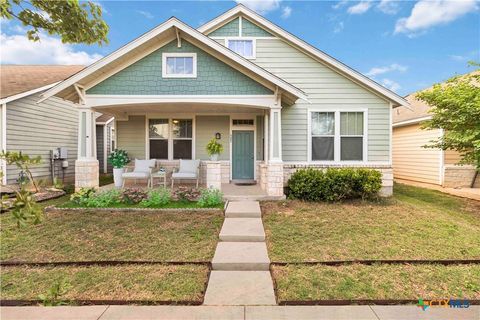
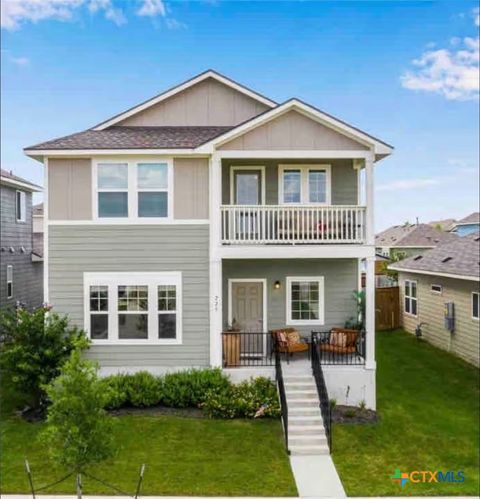
$344,900
3
bds
|
2
ba
|
1,723
sqft
|
built
2024
123 Paul Pena Dr, San Marcos, TX 78666
$-526
Cash flow
-8.0%
Cash-on-Cash Return
4.4%
Cap rate
0.6%
Rent to Value Ratio

Active
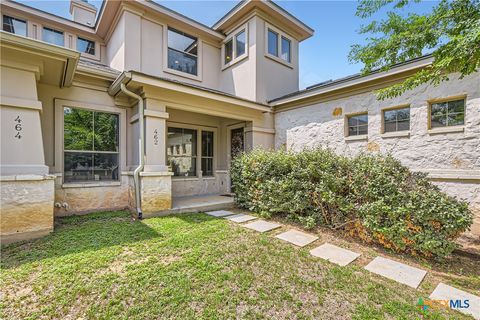
$272,900
3
bds
|
2
ba
|
1,509
sqft
|
built
2022
101 Calgary Ln, San Marcos, TX 78666
$-618
Cash flow
-11.8%
Cash-on-Cash Return
3.5%
Cap rate
0.7%
Rent to Value Ratio

Active
$495,000
4
bds
|
4
ba
|
3,028
sqft
|
built
2017
3621 Cinkapin Dr, San Marcos, TX 78666
$-1,876
Cash flow
-19.8%
Cash-on-Cash Return
1.7%
Cap rate
0.5%
Rent to Value Ratio

Active
$355,000
3
bds
|
2
ba
|
1,565
sqft
|
built
2014
234 Rock Bluff Ln, San Marcos, TX 78666
$-1,060
Cash flow
-15.6%
Cash-on-Cash Return
2.7%
Cap rate
0.6%
Rent to Value Ratio

Active
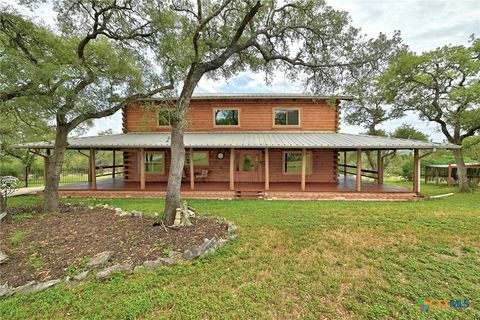
$597,500
4
bds
|
4
ba
|
2,583
sqft
|
built
1992
514 Duncan Dr, San Marcos, TX 78666
$-1,734
Cash flow
-15.1%
Cash-on-Cash Return
2.8%
Cap rate
0.5%
Rent to Value Ratio