Sand Springs, OK Investment Properties for Sale
Browse homes for sale and investment properties in Sand Springs, OK. Refine your search by price, property type, or more.
Best cash flowing properties in Sand Springs, OK

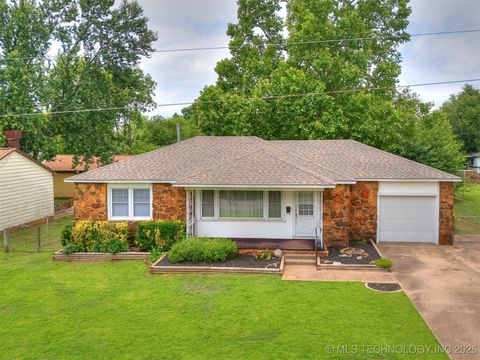
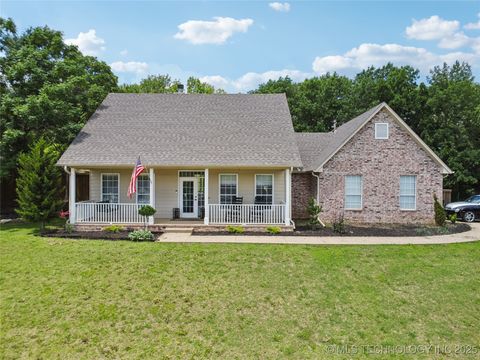
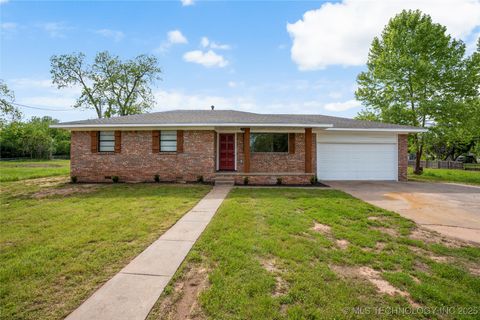
Active
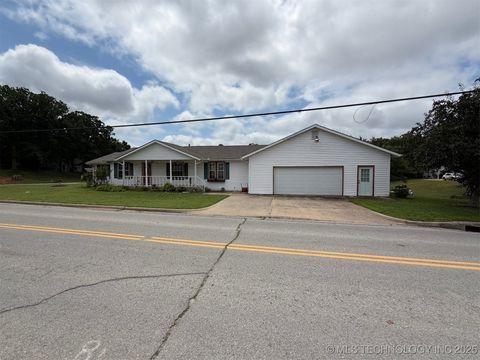
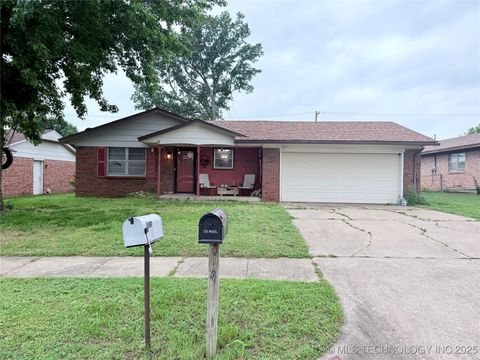
$159,900
3
bds
|
2
ba
|
1,404
sqft
|
built
1968
1604 S 168th West Ave, Sand Springs, OK 74063
$61
Cash flow
2.0%
Cash-on-Cash Return
6.7%
Cap rate
0.9%
Rent to Value Ratio
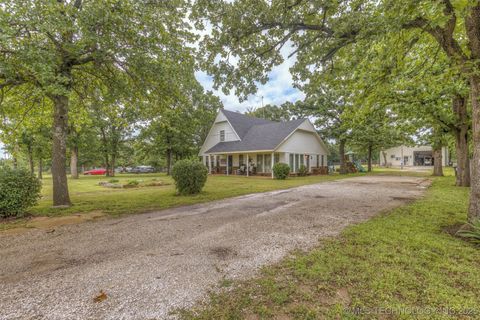
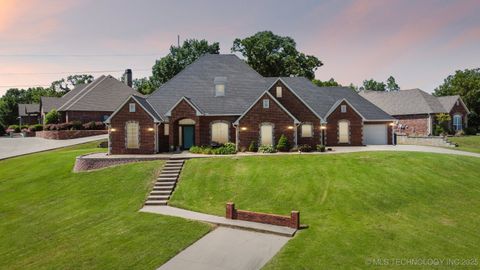
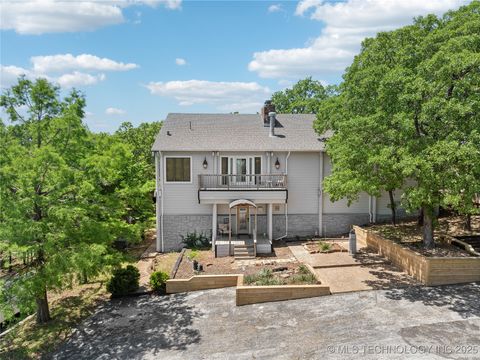
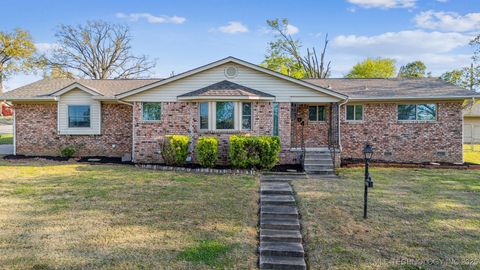
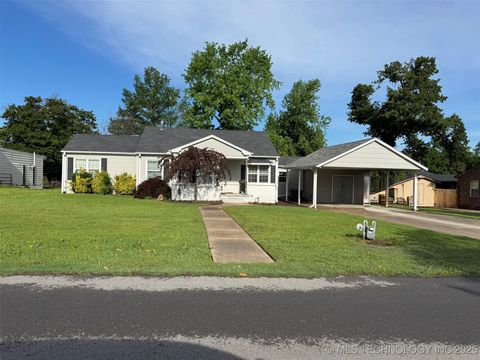
Active
$135,000
3
bds
|
2
ba
|
1,388
sqft
|
built
1945
926 N Cleveland Ave, Sand Springs, OK 74063
$50
Cash flow
1.9%
Cash-on-Cash Return
6.1%
Cap rate
1.0%
Rent to Value Ratio
60 out of 68 properties for sale in Sand Springs, OK
Limited Results Shown
Create a free account, or log in to reveal all property listings and enjoy the complete experience.

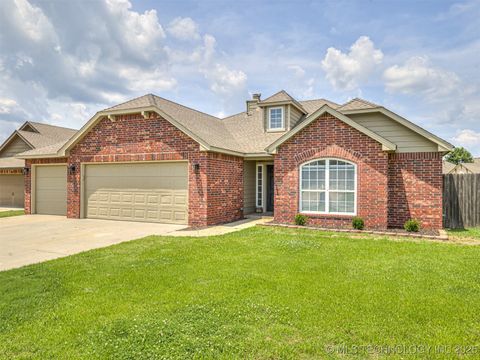
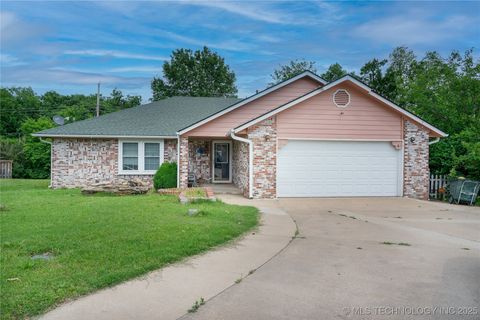
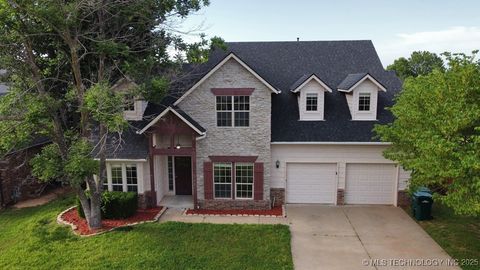
Active
$185,000
3
bds
|
1
ba
|
920
sqft
|
built
1963
114 W 32nd St, Sand Springs, OK 74063
$-127
Cash flow
-3.6%
Cash-on-Cash Return
4.9%
Cap rate
0.7%
Rent to Value Ratio

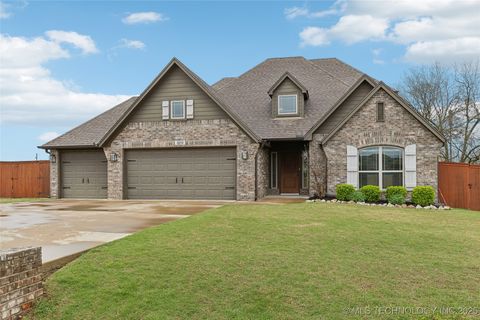
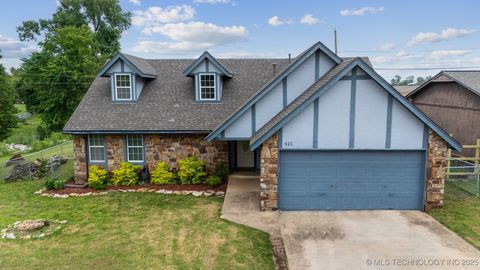
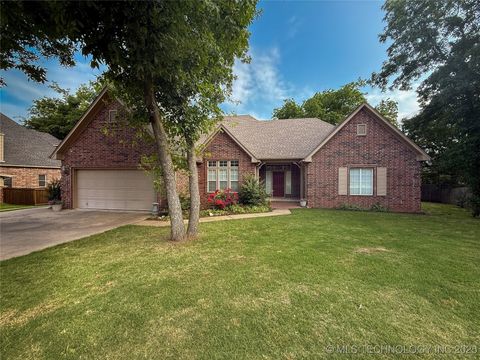
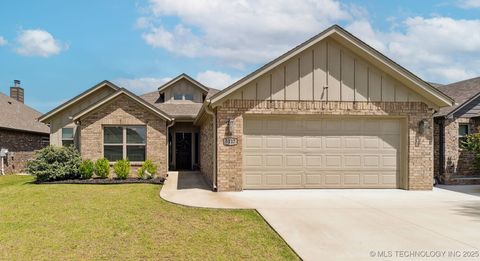
Active
$225,000
4
bds
|
2
ba
|
1,516
sqft
|
built
1966
108 W 31st Pl, Sand Springs, OK 74063
$-296
Cash flow
-6.9%
Cash-on-Cash Return
4.1%
Cap rate
0.6%
Rent to Value Ratio
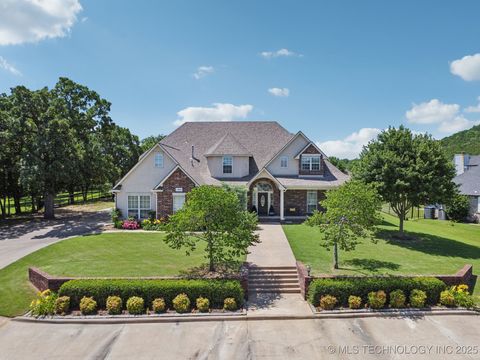
Active
$485,000
4
bds
|
3
ba
|
2,346
sqft
|
built
2019
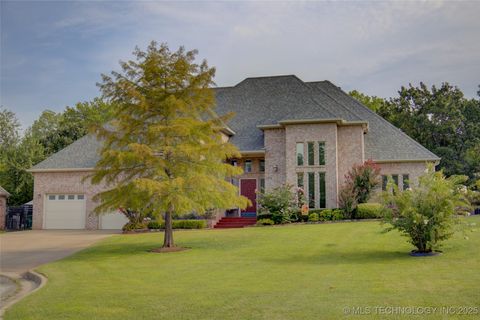
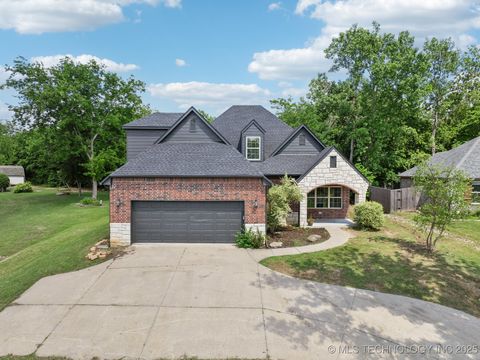
1819 E 43rd Ct, Sand Springs, OK 74063
$-1,206
Cash flow
-13.0%
Cash-on-Cash Return
2.7%
Cap rate
0.5%
Rent to Value Ratio
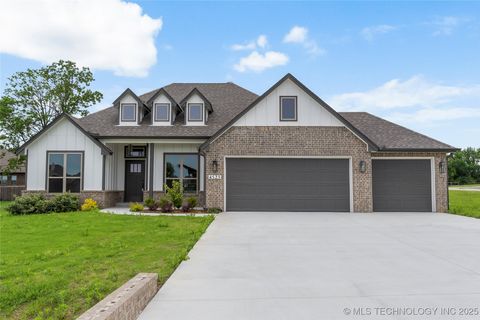
Active
$659,000
5
bds
|
3
ba
|
3,712
sqft
|
built
2002
13614 W 42nd Pl S, Sand Springs, OK 74063
$-1,585
Cash flow
-12.5%
Cash-on-Cash Return
2.8%
Cap rate
0.4%
Rent to Value Ratio
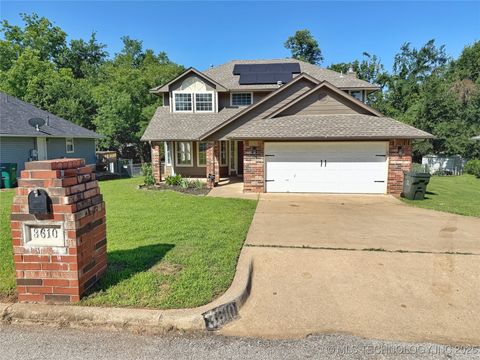
Active
$300,000
3
bds
|
3
ba
|
2,003
sqft
|
built
1992
3610 Magnolia Dr, Sand Springs, OK 74063
$-610
Cash flow
-10.6%
Cash-on-Cash Return
3.8%
Cap rate
0.6%
Rent to Value Ratio

Active
$449,000
3
bds
|
3
ba
|
3,020
sqft
|
built
1992
501 W 35th Pl, Sand Springs, OK 74063
$-532
Cash flow
-6.2%
Cash-on-Cash Return
4.3%
Cap rate
0.6%
Rent to Value Ratio
Active
$225,000
4
bds
|
2
ba
|
1,442
sqft
|
built
1984
1121 S 221st West Ave, Sand Springs, OK 74063
$-87
Cash flow
-2.0%
Cash-on-Cash Return
5.2%
Cap rate
0.7%
Rent to Value Ratio

Active
$315,000
3
bds
|
2
ba
|
2,124
sqft
|
built
1994
420 W 54th St, Sand Springs, OK 74063
$-488
Cash flow
-8.1%
Cash-on-Cash Return
4.4%
Cap rate
0.6%
Rent to Value Ratio
Active
$275,000
3
bds
|
2
ba
|
1,472
sqft
|
built
2020
107 Maple Cir, Sand Springs, OK 74063
$-354
Cash flow
-6.7%
Cash-on-Cash Return
4.1%
Cap rate
0.6%
Rent to Value Ratio
Active
$320,000
3
bds
|
2
ba
|
1,603
sqft
|
built
1975
28265 Forest Ridge Rd, Sand Springs, OK 74063
$-502
Cash flow
-8.2%
Cash-on-Cash Return
3.8%
Cap rate
0.5%
Rent to Value Ratio
Active
$1,199,999
3
bds
|
3
ba
|
4,090
sqft
|
built
2017
4127 New Prue Rd, Sand Springs, OK 74063
$-4,652
Cash flow
-20.2%
Cash-on-Cash Return
1.6%
Cap rate
0.2%
Rent to Value Ratio
Active
$165,000
3
bds
|
2
ba
|
1,159
sqft
|
built
1969
4822 Bermuda Ave, Sand Springs, OK 74063
$-26
Cash flow
-0.8%
Cash-on-Cash Return
5.5%
Cap rate
0.8%
Rent to Value Ratio
Active
$384,500
3
bds
|
2
ba
|
1,830
sqft
|
built
1985
3501 S 177th West Ave, Sand Springs, OK 74063
$-952
Cash flow
-12.9%
Cash-on-Cash Return
3.3%
Cap rate
0.5%
Rent to Value Ratio
Active
$269,900
3
bds
|
2
ba
|
1,477
sqft
|
built
2008
201 W 53rd Ct, Sand Springs, OK 74063
$-304
Cash flow
-5.9%
Cash-on-Cash Return
4.3%
Cap rate
0.6%
Rent to Value Ratio
Active
$279,900
4
bds
|
2
ba
|
2,206
sqft
|
built
1979
321 W 50th Pl, Sand Springs, OK 74063
$-335
Cash flow
-6.2%
Cash-on-Cash Return
4.2%
Cap rate
0.6%
Rent to Value Ratio
Active
$245,000
2
bds
|
2
ba
|
1,884
sqft
|
built
1954
4204 Magnolia Dr, Sand Springs, OK 74063
$-263
Cash flow
-5.6%
Cash-on-Cash Return
4.4%
Cap rate
0.6%
Rent to Value Ratio

Active
$545,900
4
bds
|
4
ba
|
3,517
sqft
|
built
2006
99 Eagle Dr, Sand Springs, OK 74063
$-867
Cash flow
-8.3%
Cash-on-Cash Return
3.8%
Cap rate
0.5%
Rent to Value Ratio
Active
$549,000
4
bds
|
5
ba
|
3,319
sqft
|
built
2003
316 E 44th St, Sand Springs, OK 74063
$-1,177
Cash flow
-11.2%
Cash-on-Cash Return
3.1%
Cap rate
0.5%
Rent to Value Ratio

Active
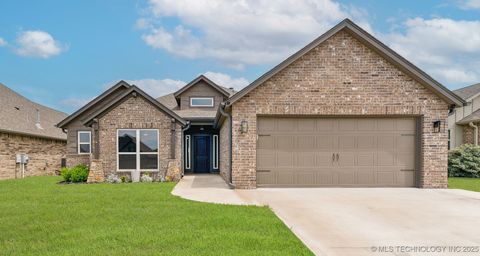
$295,000
2
bds
|
2
ba
|
1,426
sqft
|
built
2019
248 W Juanita Dr, Sand Springs, OK 74063
$-229
Cash flow
-4.1%
Cash-on-Cash Return
4.7%
Cap rate
0.6%
Rent to Value Ratio

Active
$275,000
3
bds
|
2
ba
|
1,680
sqft
|
built
1998
5202 Greenan Dr, Sand Springs, OK 74063
$-243
Cash flow
-4.6%
Cash-on-Cash Return
4.6%
Cap rate
0.7%
Rent to Value Ratio
Active
$245,000
3
bds
|
2
ba
|
1,621
sqft
|
built
1991
4605 Skylane Dr, Sand Springs, OK 74063
$-252
Cash flow
-5.4%
Cash-on-Cash Return
4.4%
Cap rate
0.6%
Rent to Value Ratio
Active
$290,000
3
bds
|
2
ba
|
2,262
sqft
|
built
2002
603 W 37th Pl, Sand Springs, OK 74063
$-213
Cash flow
-3.8%
Cash-on-Cash Return
4.8%
Cap rate
0.7%
Rent to Value Ratio
Active
$285,000
3
bds
|
2
ba
|
1,608
sqft
|
built
1999
4602 S Linwood Dr, Sand Springs, OK 74063
$-475
Cash flow
-8.7%
Cash-on-Cash Return
3.7%
Cap rate
0.6%
Rent to Value Ratio

Active
$415,000
3
bds
|
3
ba
|
2,412
sqft
|
built
2000
4157 New Prue Rd, Sand Springs, OK 74063
$-578
Cash flow
-7.3%
Cash-on-Cash Return
4.0%
Cap rate
0.6%
Rent to Value Ratio

Active
$336,000
3
bds
|
3
ba
|
2,322
sqft
|
built
1988
239 Seneca Dr, Sand Springs, OK 74063
$-530
Cash flow
-8.2%
Cash-on-Cash Return
3.8%
Cap rate
0.5%
Rent to Value Ratio

Active
$275,000
3
bds
|
3
ba
|
2,756
sqft
|
built
1972
2450 N Mc Kinley Ave, Sand Springs, OK 74063
$-83
Cash flow
-1.6%
Cash-on-Cash Return
5.3%
Cap rate
0.7%
Rent to Value Ratio
Active
$889,900
9
bds
|
6
ba
|
4,756
sqft
|
built
1989
2 Diamond Head Dr, Sand Springs, OK 74063
$-2,175
Cash flow
-12.8%
Cash-on-Cash Return
2.7%
Cap rate
0.4%
Rent to Value Ratio
Active
$381,400
4
bds
|
3
ba
|
2,702
sqft
|
built
2006
717 W 39th St, Sand Springs, OK 74063
$-586
Cash flow
-8.0%
Cash-on-Cash Return
3.8%
Cap rate
0.6%
Rent to Value Ratio
Active
$349,999
3
bds
|
2
ba
|
1,734
sqft
|
built
2021
5117 S Walnut Creek Dr, Sand Springs, OK 74063
$-699
Cash flow
-10.4%
Cash-on-Cash Return
3.3%
Cap rate
0.6%
Rent to Value Ratio
Active
$270,000
3
bds
|
2
ba
|
1,571
sqft
|
built
1965
1800 S 165th West Ave, Sand Springs, OK 74063
$-626
Cash flow
-12.1%
Cash-on-Cash Return
2.9%
Cap rate
0.4%
Rent to Value Ratio
Active
$548,500
5
bds
|
4
ba
|
4,127
sqft
|
built
2008
1310 N Northridge Ct, Sand Springs, OK 74063
$-573
Cash flow
-5.5%
Cash-on-Cash Return
4.4%
Cap rate
0.7%
Rent to Value Ratio
Active
$279,900
3
bds
|
3
ba
|
2,147
sqft
|
built
1961
204 E Saddle Rock Rd, Sand Springs, OK 74063
$-429
Cash flow
-8.0%
Cash-on-Cash Return
3.8%
Cap rate
0.5%
Rent to Value Ratio
Active
$225,000
3
bds
|
2
ba
|
1,569
sqft
|
built
1969
1601 S 165th West Ave, Sand Springs, OK 74063
$-39
Cash flow
-0.9%
Cash-on-Cash Return
5.5%
Cap rate
0.7%
Rent to Value Ratio
Active
$369,900
4
bds
|
3
ba
|
2,382
sqft
|
built
2001
4805 S Mc Kinley Ave, Sand Springs, OK 74063
$-752
Cash flow
-10.6%
Cash-on-Cash Return
3.2%
Cap rate
0.5%
Rent to Value Ratio
Active
$455,000
4
bds
|
3
ba
|
2,150
sqft
|
built
2024
4525 S Holly Ave, Sand Springs, OK 74063
$-246
Cash flow
-2.8%
Cash-on-Cash Return
5.0%
Cap rate
0.6%
Rent to Value Ratio
Active
$339,999
3
bds
|
2
ba
|
1,719
sqft
|
built
2021
5113 S Walnut Creek Dr, Sand Springs, OK 74063
$-672
Cash flow
-10.3%
Cash-on-Cash Return
3.3%
Cap rate
0.5%
Rent to Value Ratio
Active
$258,000
3
bds
|
2
ba
|
2,143
sqft
|
built
1960
3210 Summit Blvd, Sand Springs, OK 74063
$-238
Cash flow
-4.8%
Cash-on-Cash Return
4.6%
Cap rate
0.7%
Rent to Value Ratio
Active
$975,000
3
bds
|
3
ba
|
3,192
sqft
|
built
1970
26555 W 55th St S, Sand Springs, OK 74063
$-1,919
Cash flow
-10.3%
Cash-on-Cash Return
3.3%
Cap rate
0.4%
Rent to Value Ratio