Sandy Springs, GA Investment Properties for Sale
Browse homes for sale and investment properties in Sandy Springs, GA. Refine your search by price, property type, or more.
Best cash flowing properties in Sandy Springs, GA
Active
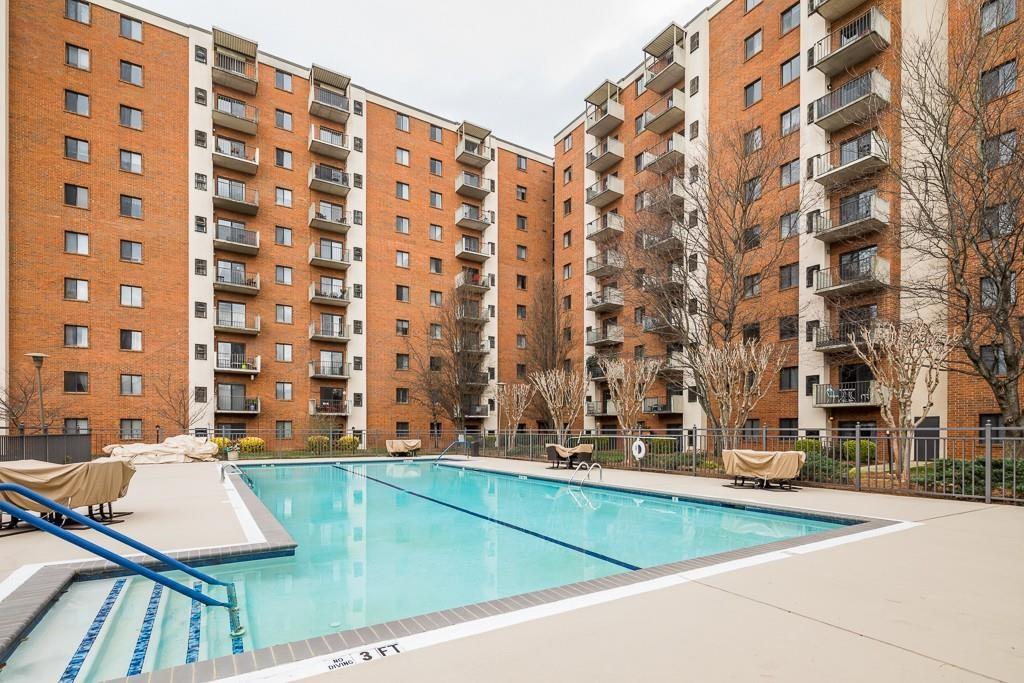
$169,900
1
bds
|
1
ba
|
0
sqft
|
built
1964
6851 Roswell Rd, Sandy Springs, GA 30328
$206
Cash flow
6.3%
Cash-on-Cash Return
7.6%
Cap rate
1.3%
Rent to Value Ratio
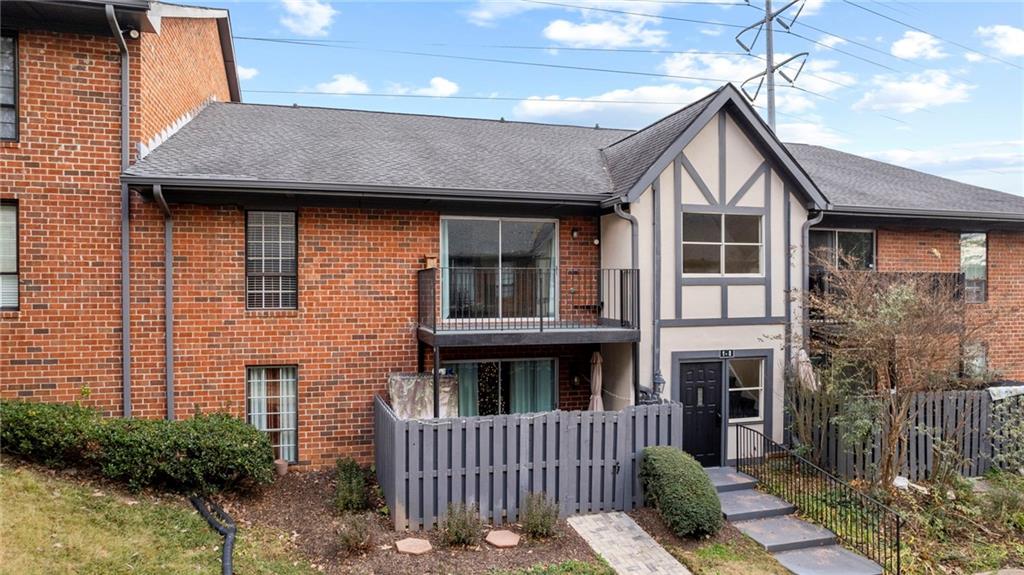
Active under contract
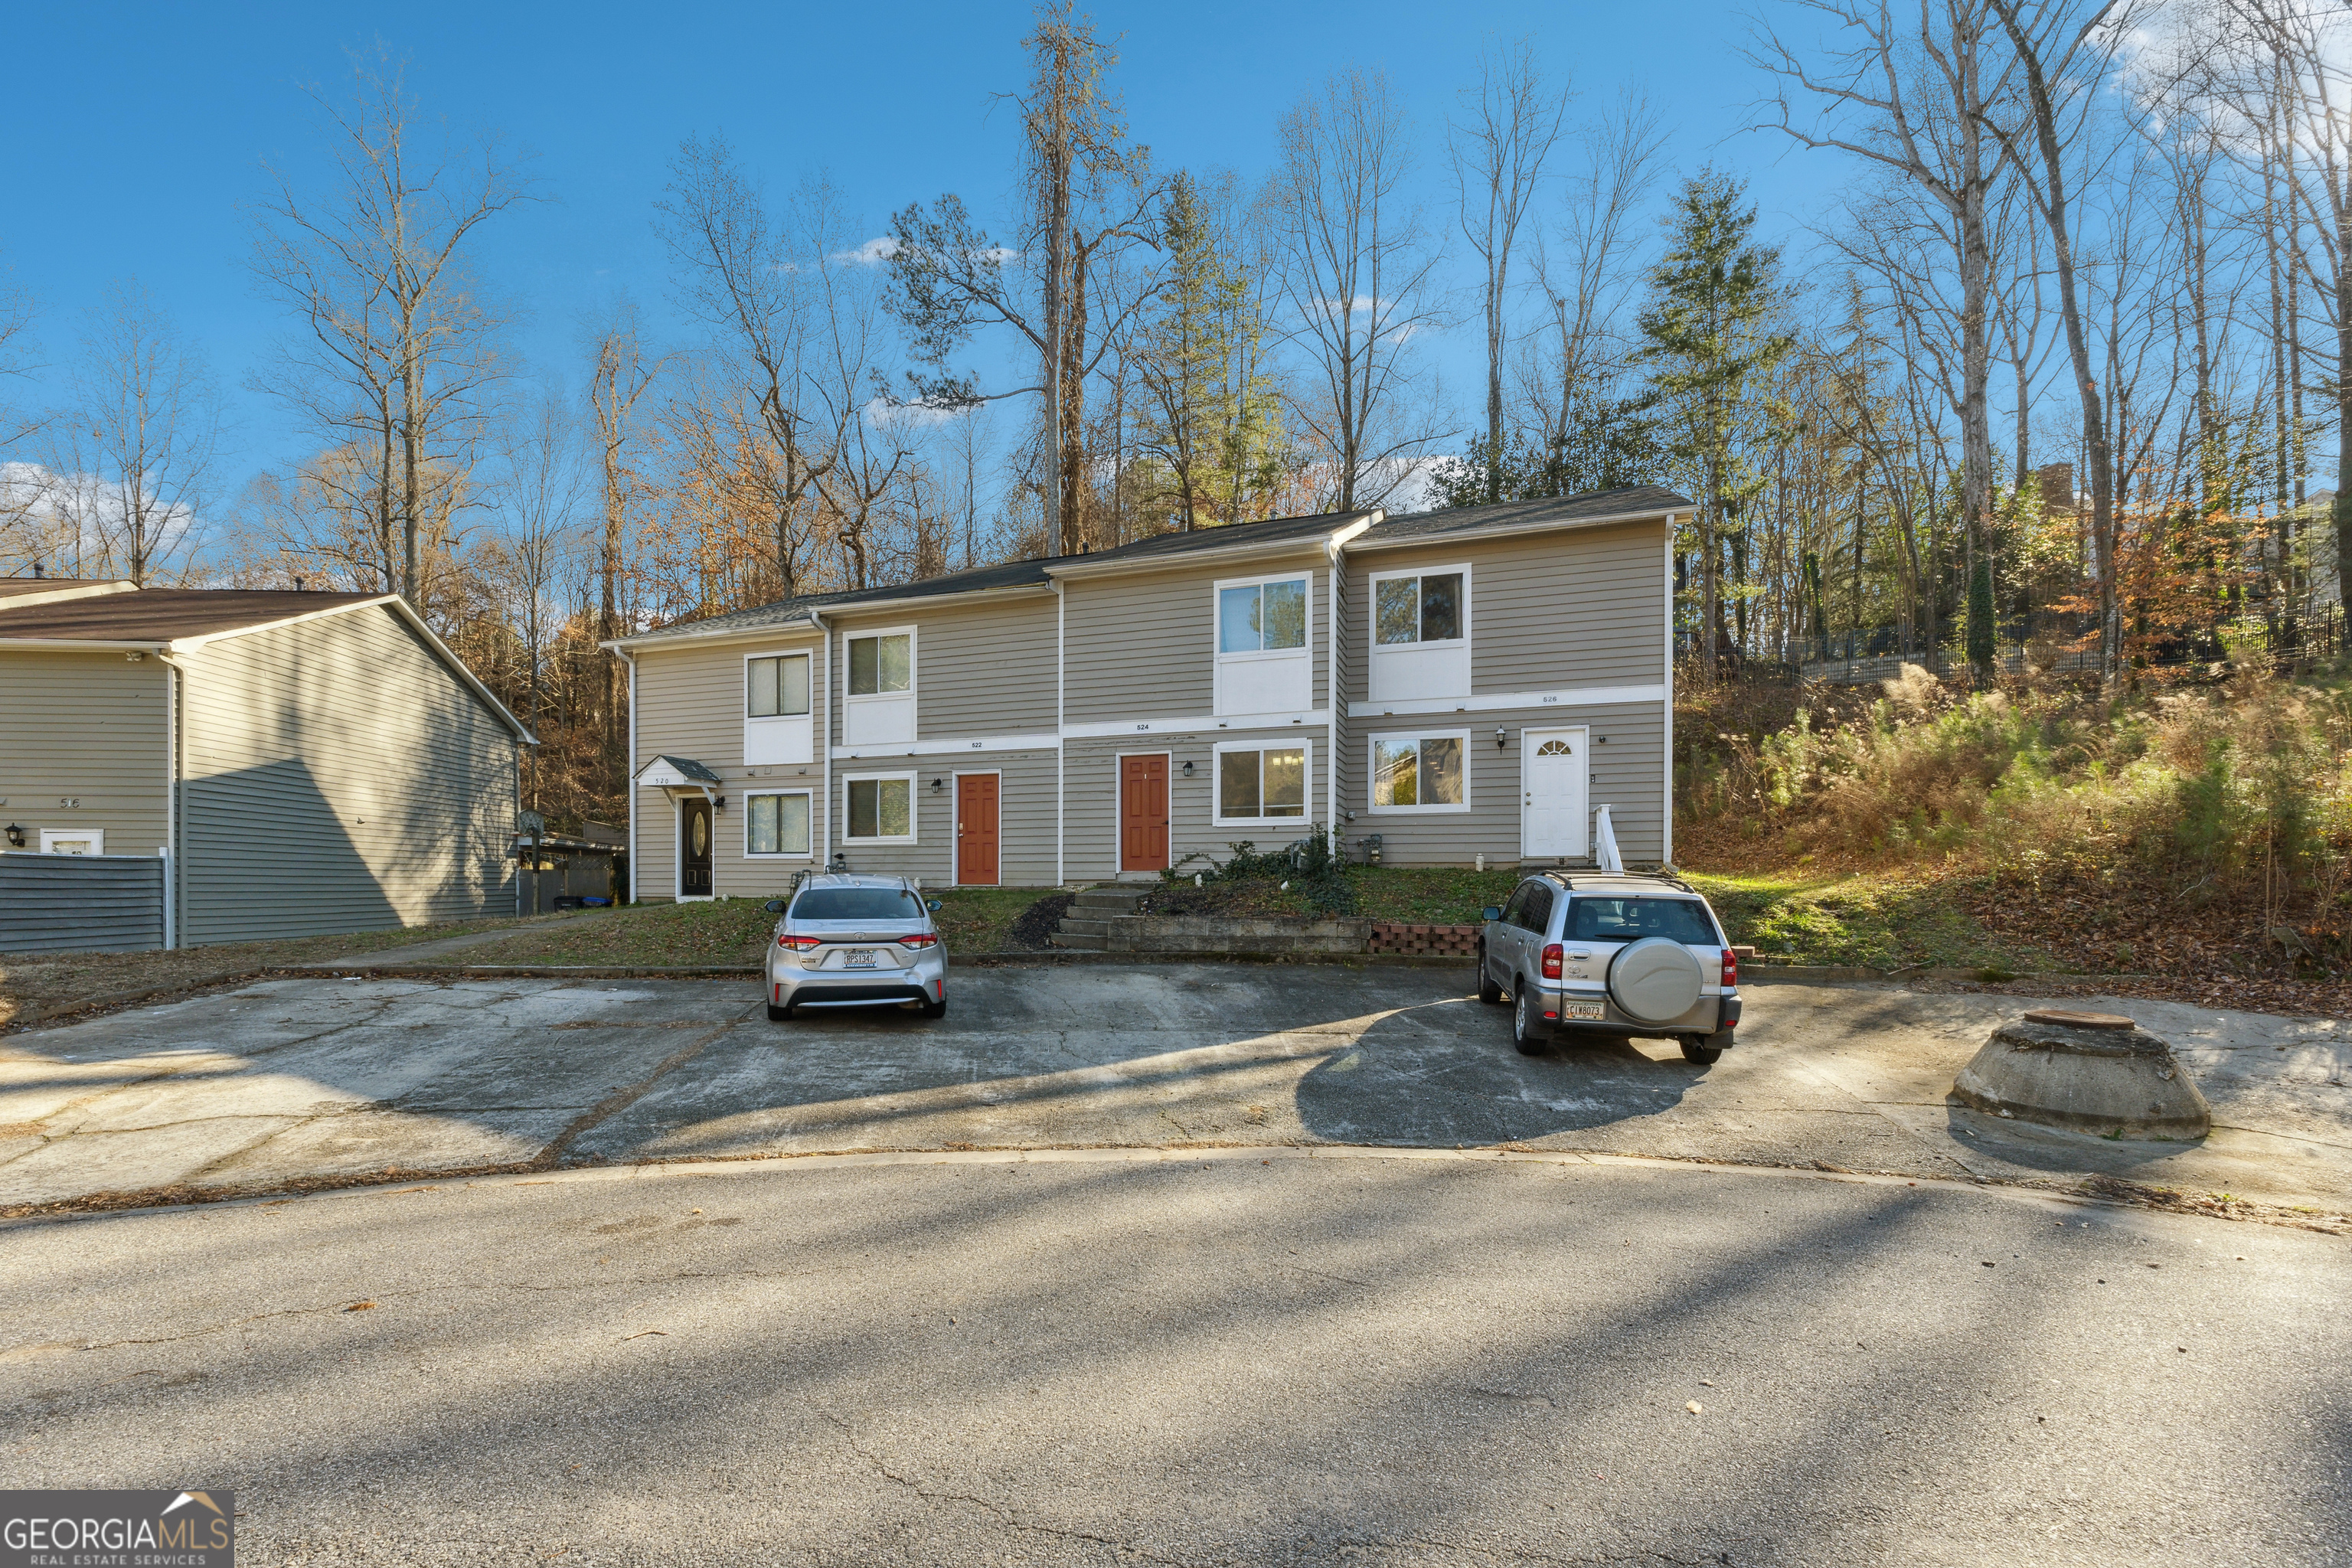
$189,900
2
bds
|
0
ba
|
1,380
sqft
|
built
1986
524 Northridge Crossing Dr, Sandy Springs, GA 30350
$111
Cash flow
3.0%
Cash-on-Cash Return
6.8%
Cap rate
0.8%
Rent to Value Ratio
165 out of 200 properties for sale in Sandy Springs, GA
Limited Results Shown
Create a free account, or log in to reveal all property listings and enjoy the complete experience.
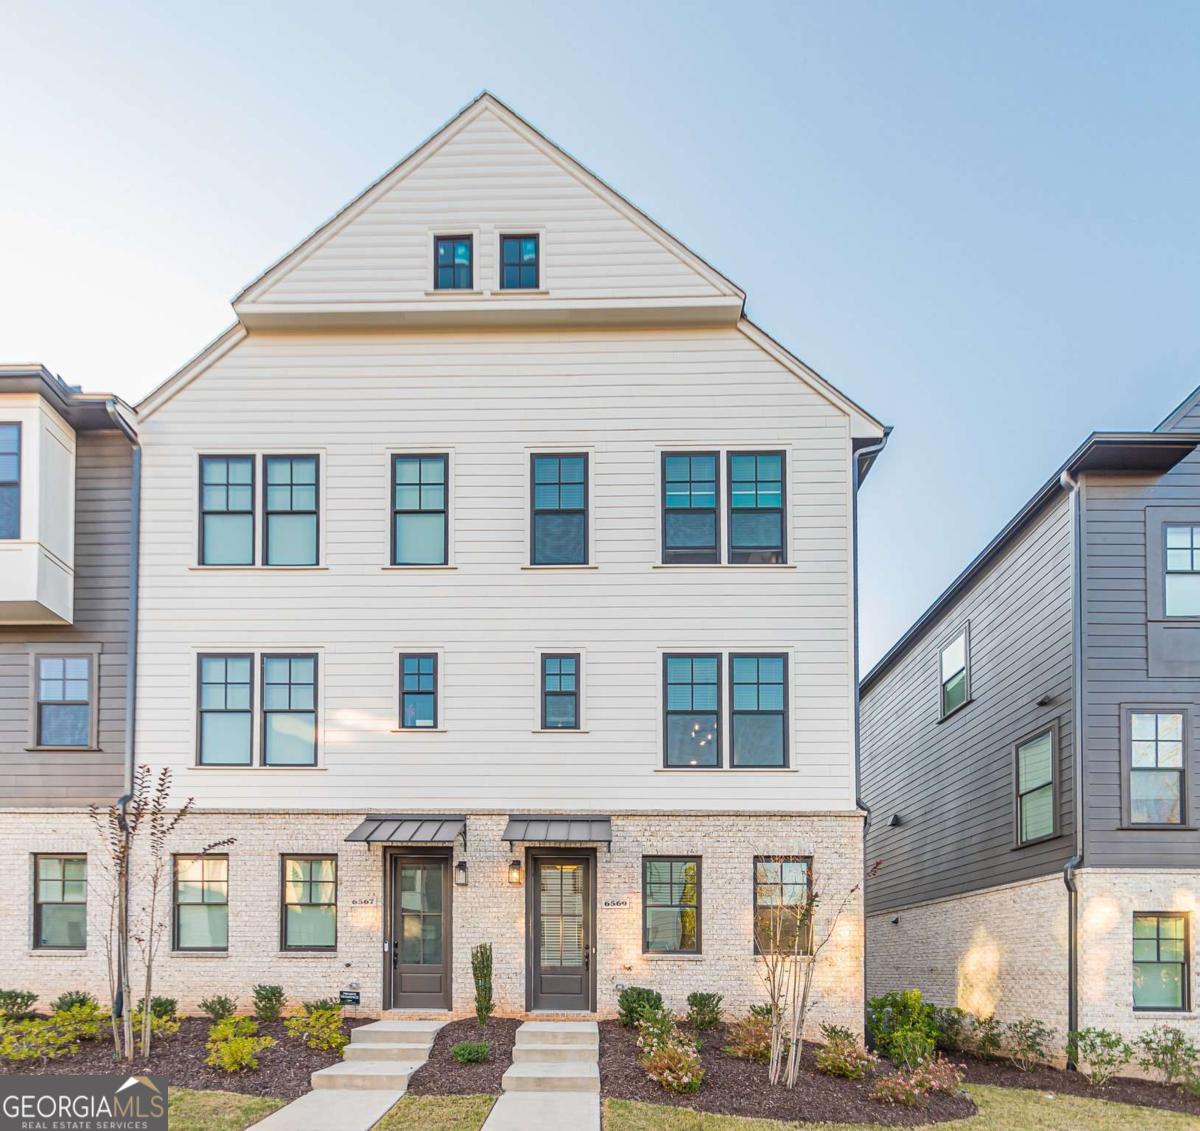
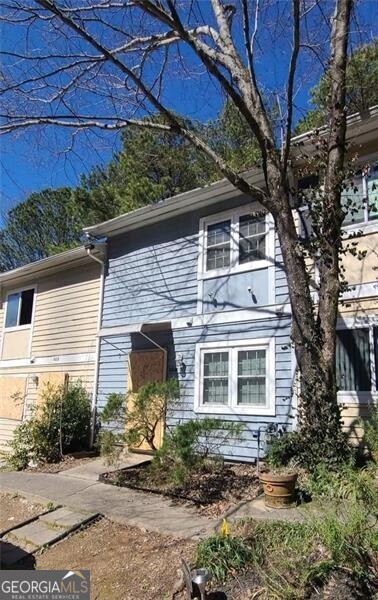
Active under contract
$624,900
3
bds
|
0
ba
|
2,009
sqft
|
built
2022
6569 Beacon Dr, Sandy Springs, GA 30328
$-1,709
Cash flow
-14.3%
Cash-on-Cash Return
2.9%
Cap rate
0.6%
Rent to Value Ratio

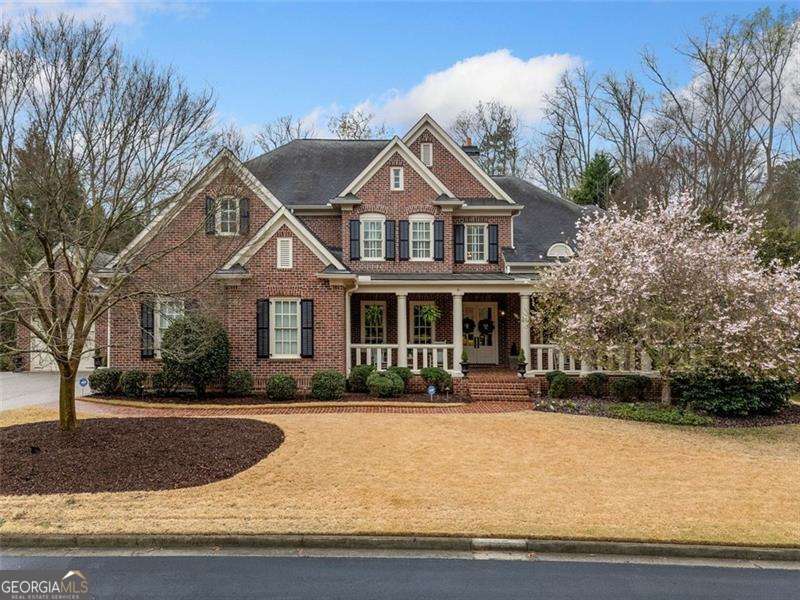
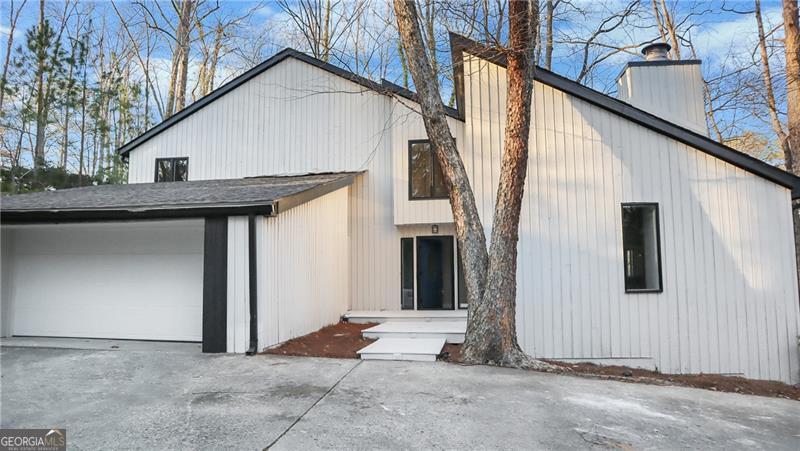
Active
$599,900
3
bds
|
4
ba
|
2,958
sqft
|
built
1972
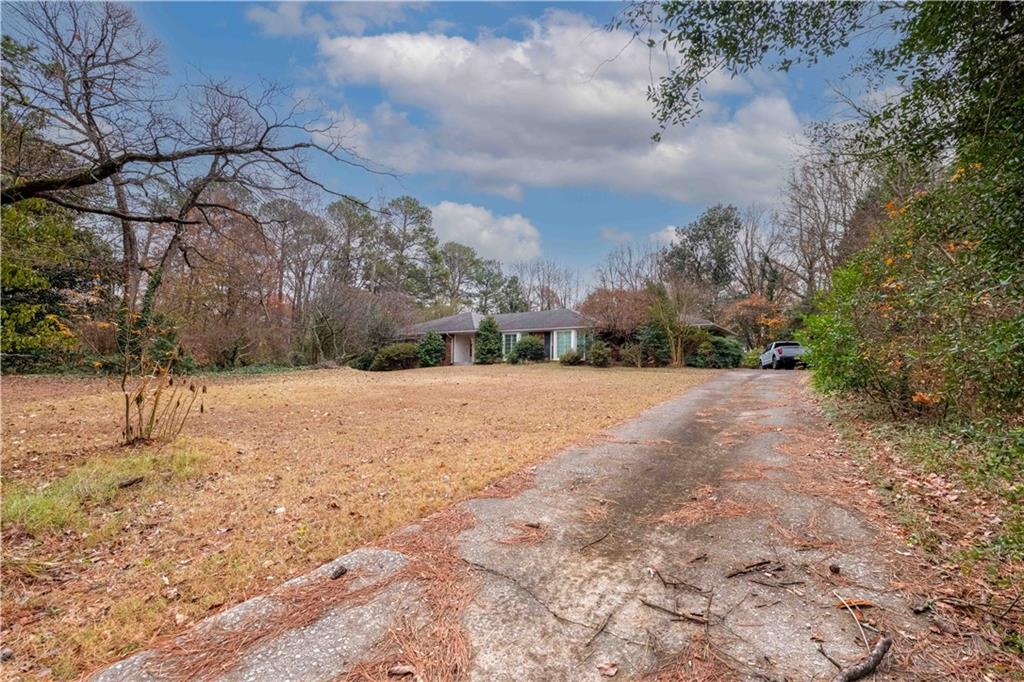
5273 Glenridge Drive, Sandy Springs, GA 30342
n/a
Cash flow
n/a
Cash-on-Cash Return
n/a
Cap rate
n/a
Rent to Value Ratio
Active
$2,100,000
5
bds
|
0
ba
|
8,389
sqft
|
built
2009
3821 Teesdale Ct, Sandy Springs, GA 30350
$-7,750
Cash flow
-19.3%
Cash-on-Cash Return
1.7%
Cap rate
0.3%
Rent to Value Ratio
Active under contract
$560,000
3
bds
|
0
ba
|
1,840
sqft
|
built
1950
46 W Belle Isle Rd, Sandy Springs, GA 30342
$-1,204
Cash flow
-11.2%
Cash-on-Cash Return
3.6%
Cap rate
0.5%
Rent to Value Ratio

Active
$400,000
1
bds
|
2
ba
|
0
sqft
|
built
2018
6812 Cadence Blvd, Sandy Springs, GA 30328
$-833
Cash flow
-10.9%
Cash-on-Cash Return
3.6%
Cap rate
0.7%
Rent to Value Ratio
Active
$989,000
3
bds
|
0
ba
|
0
sqft
|
built
2017
6601 Aria Blvd, Sandy Springs, GA 30328
$-3,760
Cash flow
-19.8%
Cash-on-Cash Return
1.6%
Cap rate
0.4%
Rent to Value Ratio
Active
$179,000
1
bds
|
0
ba
|
797
sqft
|
built
1964
6851 Roswell Rd, Sandy Springs, GA 30328
$-265
Cash flow
-7.7%
Cash-on-Cash Return
4.4%
Cap rate
0.9%
Rent to Value Ratio
Active
$729,000
4
bds
|
0
ba
|
4,079
sqft
|
built
1989
31 Greenland Trce, Sandy Springs, GA 30342
$-1,227
Cash flow
-8.8%
Cash-on-Cash Return
4.1%
Cap rate
0.7%
Rent to Value Ratio
Active
$1,900,000
5
bds
|
0
ba
|
3,871
sqft
|
built
1973
4830 Rebel Trl, Sandy Springs, GA 30327
$-6,433
Cash flow
-17.7%
Cash-on-Cash Return
2.1%
Cap rate
0.3%
Rent to Value Ratio
Active
$2,600,000
4
bds
|
0
ba
|
0
sqft
|
built
1981
6090 River Chase Cir, Sandy Springs, GA 30328
$-6,687
Cash flow
-13.4%
Cash-on-Cash Return
3.1%
Cap rate
0.4%
Rent to Value Ratio
Active under contract
$189,900
2
bds
|
0
ba
|
1,380
sqft
|
built
1986
524 Northridge Crossing Dr, Sandy Springs, GA 30350
$111
Cash flow
3.0%
Cash-on-Cash Return
6.8%
Cap rate
0.8%
Rent to Value Ratio
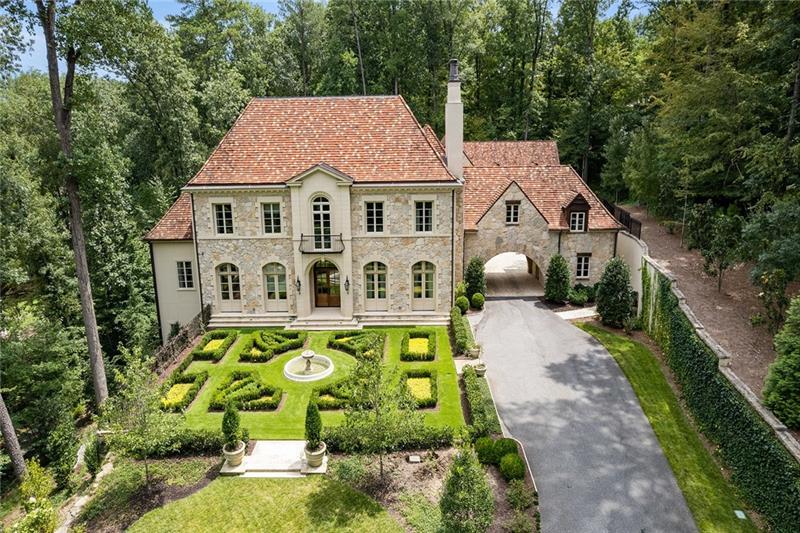
Active
$6,900,000
5
bds
|
8
ba
|
10,943
sqft
|
built
2016
4975 Rebel Trl, Sandy Springs, GA 30327
$-33,612
Cash flow
-25.4%
Cash-on-Cash Return
0.3%
Cap rate
0.1%
Rent to Value Ratio

Active
$238,500
2
bds
|
2
ba
|
0
sqft
|
built
1970
235 Winding River Dr, Sandy Springs, GA 30350
$-426
Cash flow
-9.3%
Cash-on-Cash Return
4.0%
Cap rate
0.8%
Rent to Value Ratio
Active
$2,200,000
6
bds
|
8
ba
|
0
sqft
|
built
2015
200 Rivermere Way, Sandy Springs, GA 30350
$-7,074
Cash flow
-16.8%
Cash-on-Cash Return
2.3%
Cap rate
0.4%
Rent to Value Ratio
Active
$4,850,000
6
bds
|
8
ba
|
0
sqft
|
built
2019
700 N Island Dr, Sandy Springs, GA 30327
$-17,944
Cash flow
-19.3%
Cash-on-Cash Return
1.7%
Cap rate
0.2%
Rent to Value Ratio
Active
$269,900
2
bds
|
2
ba
|
0
sqft
|
built
2004
799 Hammond Dr, Sandy Springs, GA 30328
$-641
Cash flow
-12.4%
Cash-on-Cash Return
3.3%
Cap rate
0.9%
Rent to Value Ratio
Active
$228,500
2
bds
|
0
ba
|
1,100
sqft
|
built
1988
1205 Gettysburg Pl, Sandy Springs, GA 30350
$-353
Cash flow
-8.1%
Cash-on-Cash Return
4.3%
Cap rate
0.7%
Rent to Value Ratio
Active
$259,000
2
bds
|
2
ba
|
0
sqft
|
built
1967
6700 Roswell Rd, Sandy Springs, GA 30328
$-259
Cash flow
-5.2%
Cash-on-Cash Return
4.9%
Cap rate
0.8%
Rent to Value Ratio
Active
$1,250,000
4
bds
|
0
ba
|
4,270
sqft
|
built
1986
9570 Huntcliff Trce, Sandy Springs, GA 30350
$-2,560
Cash flow
-10.7%
Cash-on-Cash Return
3.7%
Cap rate
0.5%
Rent to Value Ratio
Active
$3,495,000
6
bds
|
0
ba
|
0
sqft
|
built
2010
440 Belada Blvd, Sandy Springs, GA 30342
$-13,442
Cash flow
-20.1%
Cash-on-Cash Return
1.5%
Cap rate
0.3%
Rent to Value Ratio
Active
$1,249,000
4
bds
|
0
ba
|
4,810
sqft
|
built
1964
505 River Valley Rd, Sandy Springs, GA 30328
$-2,809
Cash flow
-11.7%
Cash-on-Cash Return
3.4%
Cap rate
0.5%
Rent to Value Ratio
Active
$225,000
2
bds
|
2
ba
|
1,206
sqft
|
built
1964
6851 Roswell Rd, Sandy Springs, GA 30328
$-251
Cash flow
-5.8%
Cash-on-Cash Return
4.8%
Cap rate
0.9%
Rent to Value Ratio
Active
$495,000
3
bds
|
0
ba
|
1,404
sqft
|
built
2012
7420 Glisten Ave, Sandy Springs, GA 30328
$-994
Cash flow
-10.5%
Cash-on-Cash Return
3.7%
Cap rate
0.6%
Rent to Value Ratio
Active
$649,000
3
bds
|
3
ba
|
2,266
sqft
|
built
1959
355 Ridgeview Trl, Sandy Springs, GA 30328
$-1,426
Cash flow
-11.5%
Cash-on-Cash Return
3.5%
Cap rate
0.6%
Rent to Value Ratio
Active
$3,750,000
7
bds
|
8
ba
|
7,611
sqft
|
built
2023
5060 Lake Forrest Dr, Sandy Springs, GA 30342
$-15,739
Cash flow
-21.9%
Cash-on-Cash Return
1.1%
Cap rate
0.2%
Rent to Value Ratio

Active
$178,000
2
bds
|
1
ba
|
0
sqft
|
built
1982
204 Natchez Trce, Sandy Springs, GA 30350
$-495
Cash flow
-14.5%
Cash-on-Cash Return
2.8%
Cap rate
0.9%
Rent to Value Ratio
Active
$224,900
2
bds
|
0
ba
|
1,178
sqft
|
built
1980
5678 Kingsport Dr, Sandy Springs, GA 30342
$-255
Cash flow
-5.9%
Cash-on-Cash Return
4.8%
Cap rate
0.8%
Rent to Value Ratio
Active
$1,695,000
7
bds
|
0
ba
|
7,469
sqft
|
built
2002
9070 Huntcliff Trce, Sandy Springs, GA 30350
$-5,448
Cash flow
-16.8%
Cash-on-Cash Return
2.3%
Cap rate
0.4%
Rent to Value Ratio

Active
$4,800,000
1
bds
|
0
ba
|
0
sqft
|
built
1952
251 Mount Vernon Hwy NW, Sandy Springs, GA 30328
$-21,853
Cash flow
-23.8%
Cash-on-Cash Return
0.7%
Cap rate
0.1%
Rent to Value Ratio
Active
$899,000
3
bds
|
0
ba
|
2,539
sqft
|
built
1958
4872 Northland Dr, Sandy Springs, GA 30342
$-1,981
Cash flow
-11.5%
Cash-on-Cash Return
3.5%
Cap rate
0.5%
Rent to Value Ratio
Active
$252,400
2
bds
|
0
ba
|
0
sqft
|
built
1983
524 Granite Ridge Pl, Sandy Springs, GA 30350
$-160
Cash flow
-3.3%
Cash-on-Cash Return
5.4%
Cap rate
0.8%
Rent to Value Ratio
Active
$1,850,000
5
bds
|
0
ba
|
9,070
sqft
|
built
1983
1120 Heards Ferry Rd, Sandy Springs, GA 30328
$-5,502
Cash flow
-15.5%
Cash-on-Cash Return
2.6%
Cap rate
0.4%
Rent to Value Ratio
Active
$140,000
1
bds
|
1
ba
|
0
sqft
|
built
1986
300 Johnson Ferry Rd NE, Sandy Springs, GA 30328
$-877
Cash flow
-32.7%
Cash-on-Cash Return
-1.4%
Cap rate
1.3%
Rent to Value Ratio
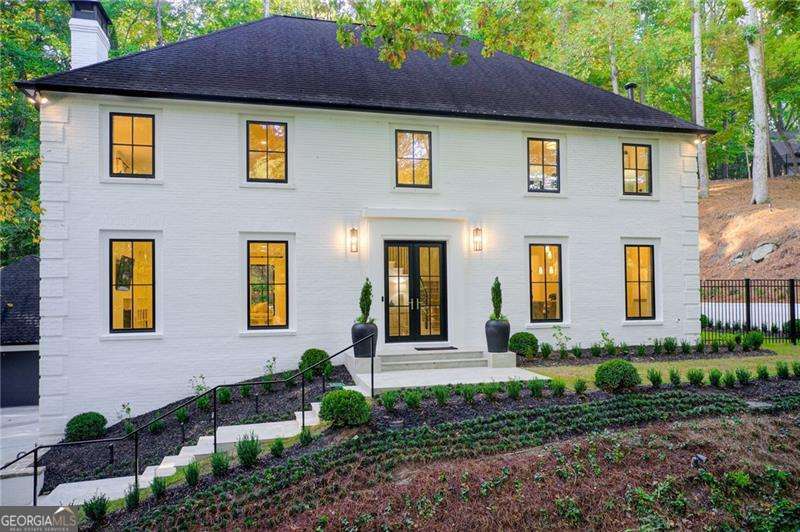
Pending
$1,950,000
4
bds
|
3
ba
|
2,152
sqft
|
built
1970
750 Mount Vernon Hwy, Sandy Springs, GA 30327
$-8,211
Cash flow
-22.0%
Cash-on-Cash Return
1.1%
Cap rate
0.2%
Rent to Value Ratio
Active
$237,000
3
bds
|
0
ba
|
1,380
sqft
|
built
1982
504 Vicksburg Pl, Sandy Springs, GA 30350
$-89
Cash flow
-2.0%
Cash-on-Cash Return
5.7%
Cap rate
0.8%
Rent to Value Ratio
Active
$214,800
1
bds
|
0
ba
|
746
sqft
|
built
2004
799 Hammond Dr, Sandy Springs, GA 30328
$-392
Cash flow
-9.5%
Cash-on-Cash Return
4.0%
Cap rate
0.8%
Rent to Value Ratio
Active
$179,000
1
bds
|
1
ba
|
0
sqft
|
built
1964
6851 Roswell Rd, Sandy Springs, GA 30328
$-299
Cash flow
-8.7%
Cash-on-Cash Return
4.1%
Cap rate
0.9%
Rent to Value Ratio

Active
$275,900
3
bds
|
2
ba
|
0
sqft
|
built
1968
6520 Roswell Rd, Sandy Springs, GA 30328
$-316
Cash flow
-6.0%
Cash-on-Cash Return
4.8%
Cap rate
1.0%
Rent to Value Ratio
Active
$169,900
1
bds
|
1
ba
|
0
sqft
|
built
1964
6851 Roswell Rd, Sandy Springs, GA 30328
$206
Cash flow
6.3%
Cash-on-Cash Return
7.6%
Cap rate
1.3%
Rent to Value Ratio
Active
$310,000
3
bds
|
0
ba
|
2,240
sqft
|
built
1974
502 Brandywine Cir, Sandy Springs, GA 30350
$-664
Cash flow
-11.2%
Cash-on-Cash Return
3.6%
Cap rate
0.7%
Rent to Value Ratio