Sandy Springs, GA Investment Properties for Sale
Browse homes for sale and investment properties in Sandy Springs, GA. Refine your search by price, property type, or more.
Best cash flowing properties in Sandy Springs, GA
Active
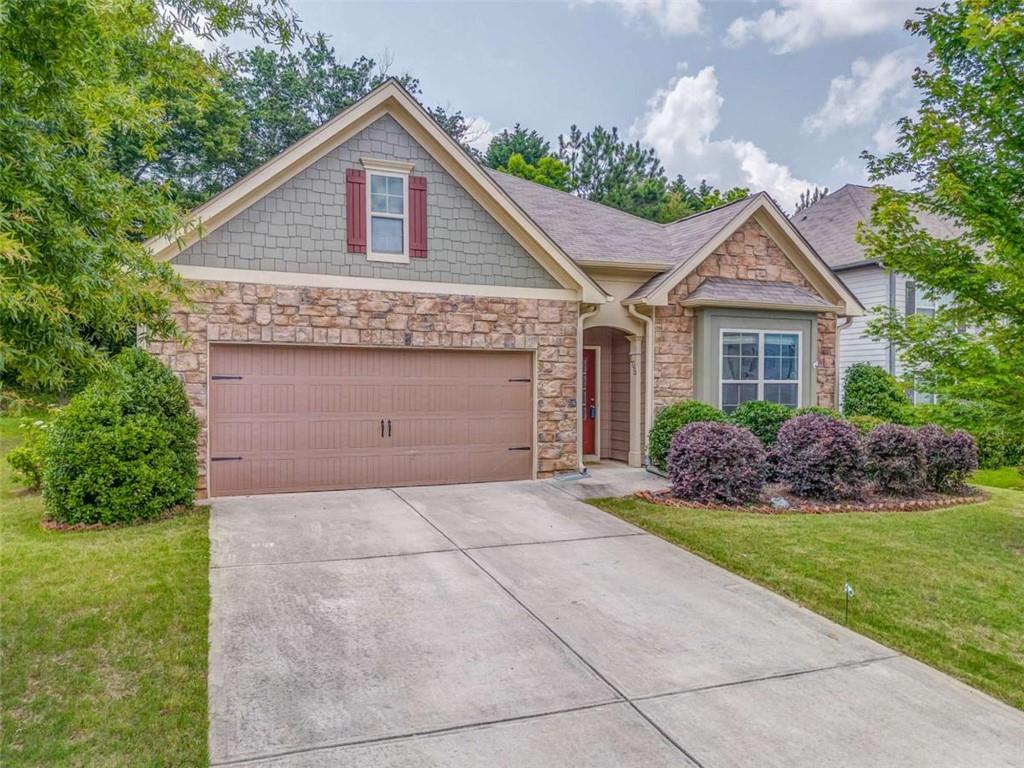
$359,000
4
bds
|
2
ba
|
1,780
sqft
|
built
2018
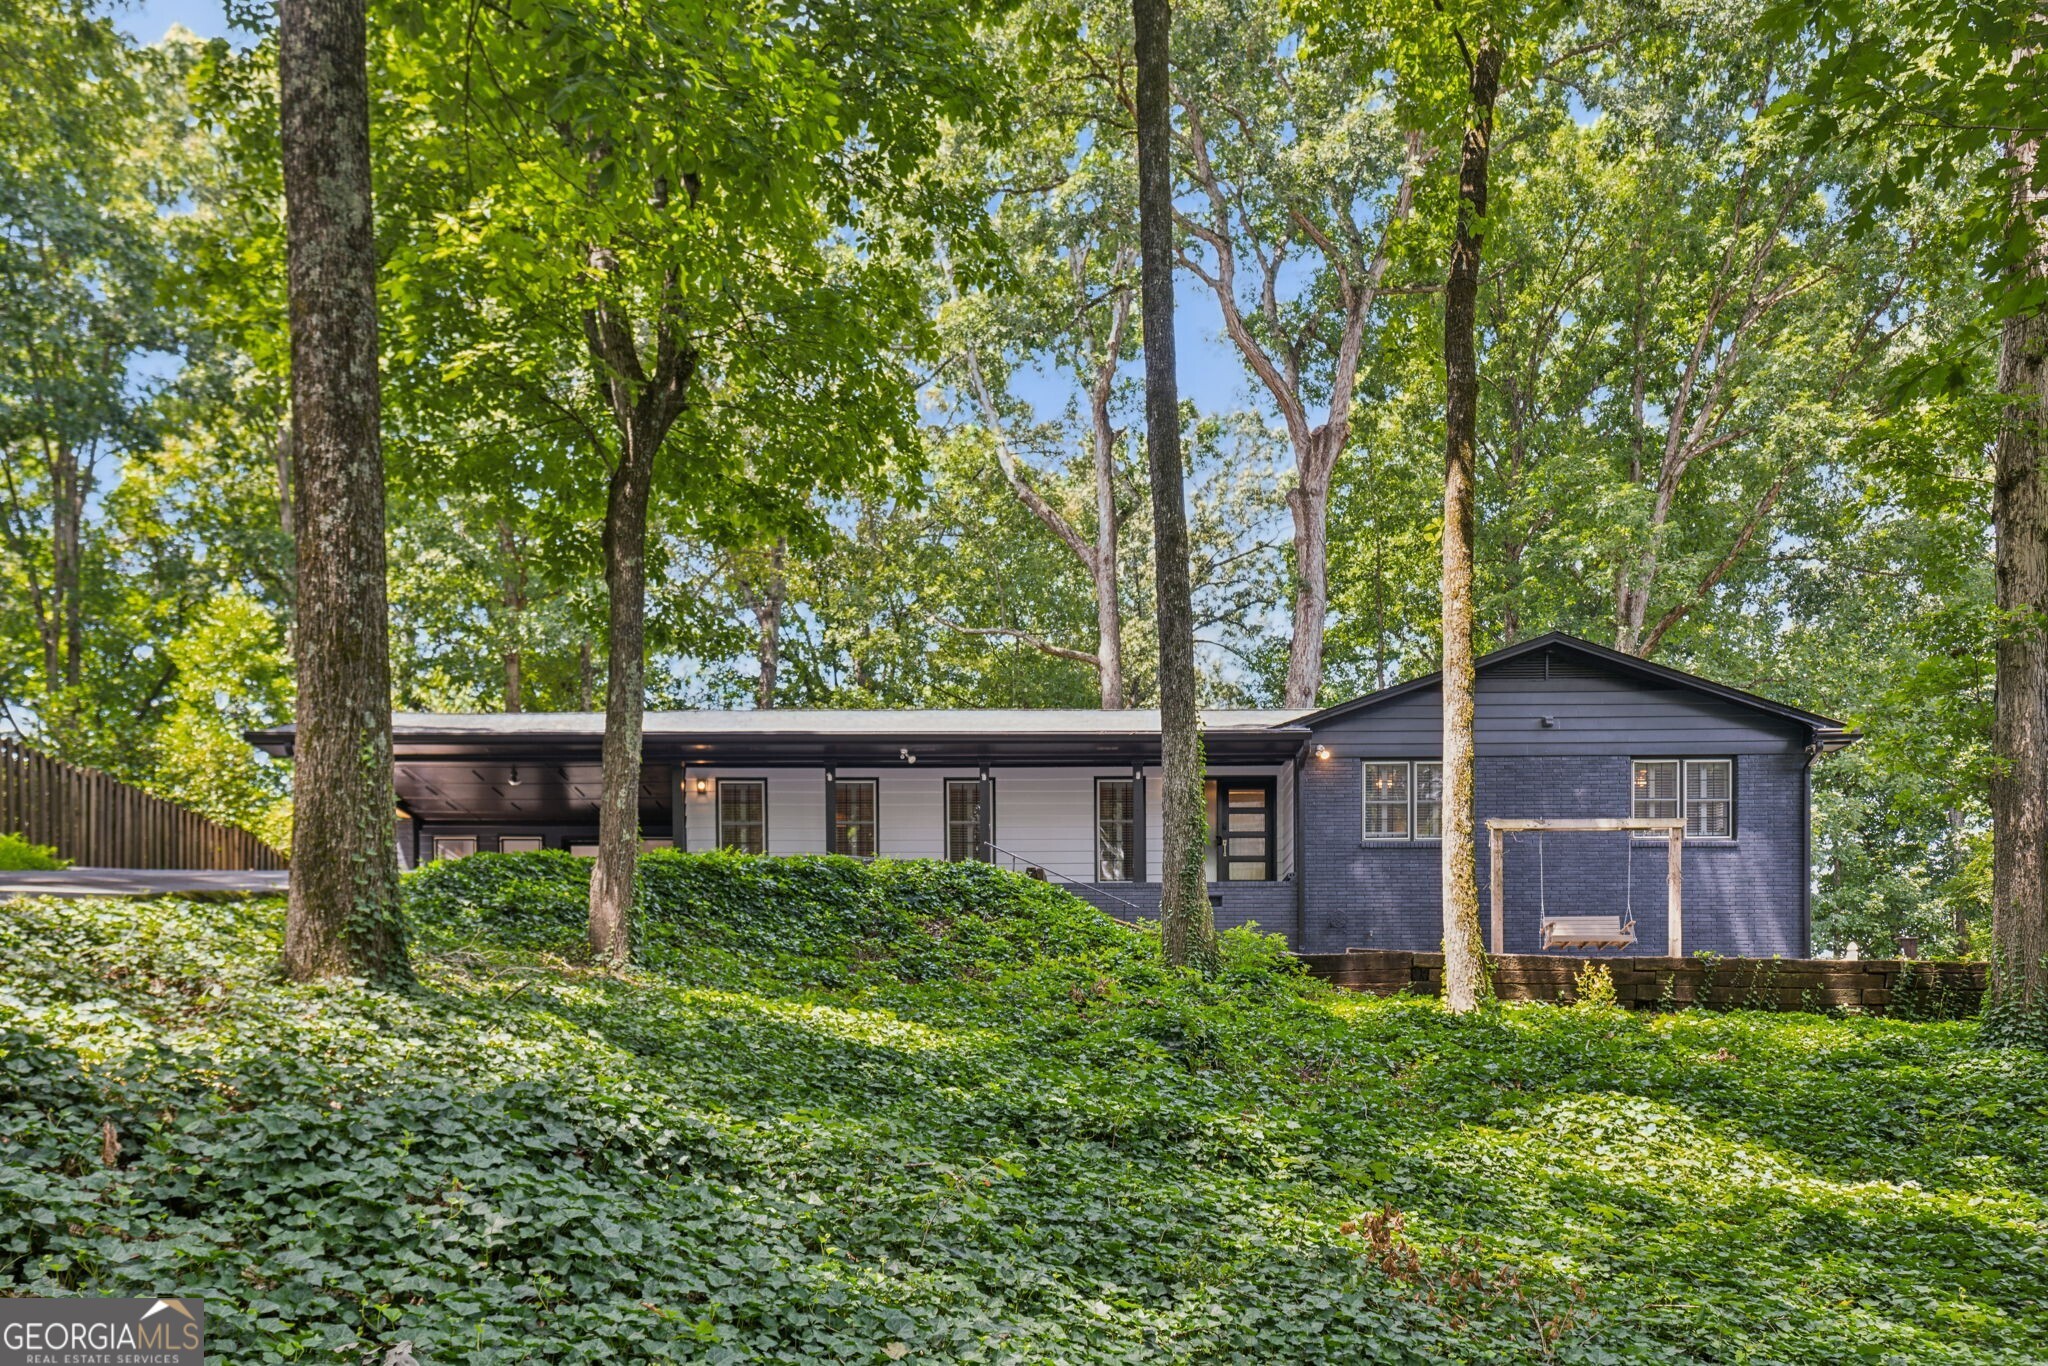
105 Jefferson Cir, Sandy Springs, GA 30328
$468
Cash flow
6.8%
Cash-on-Cash Return
7.7%
Cap rate
1.1%
Rent to Value Ratio
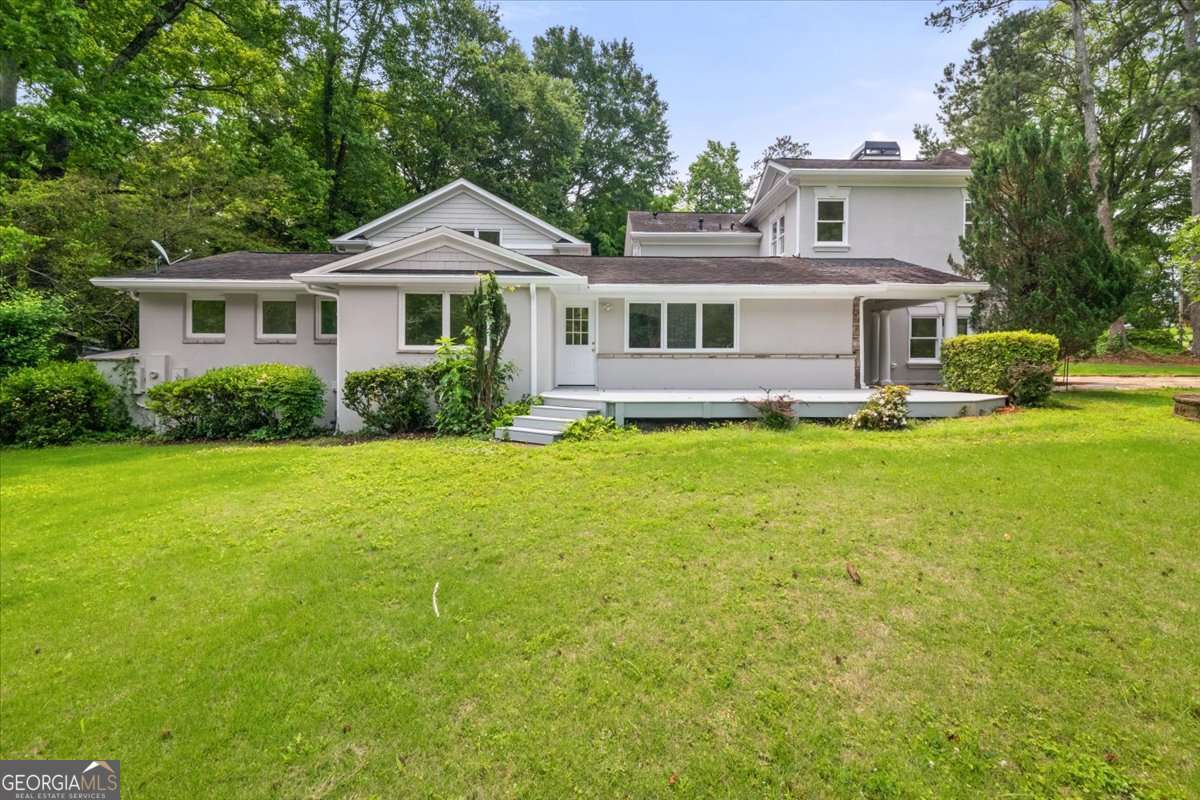
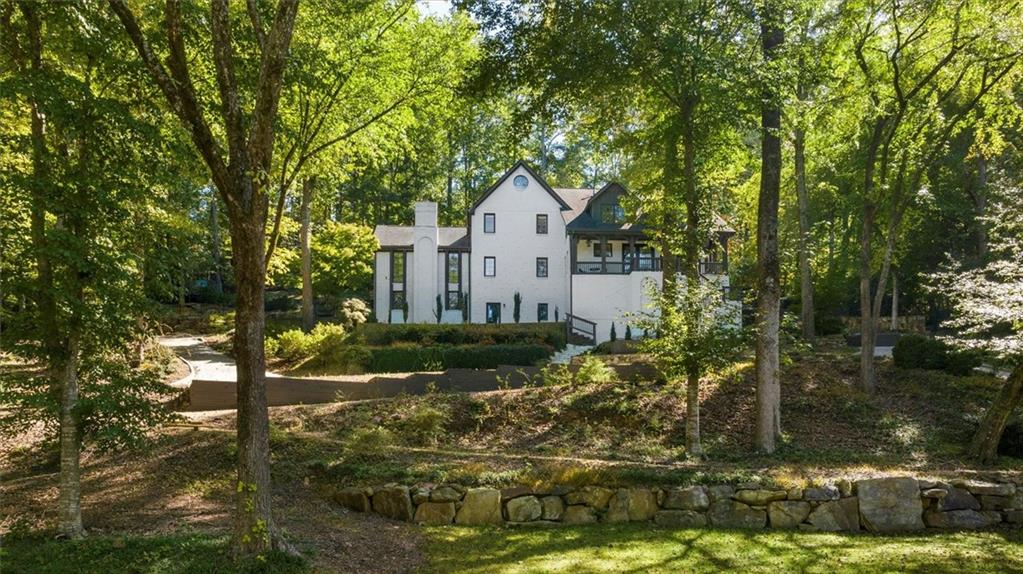
Active
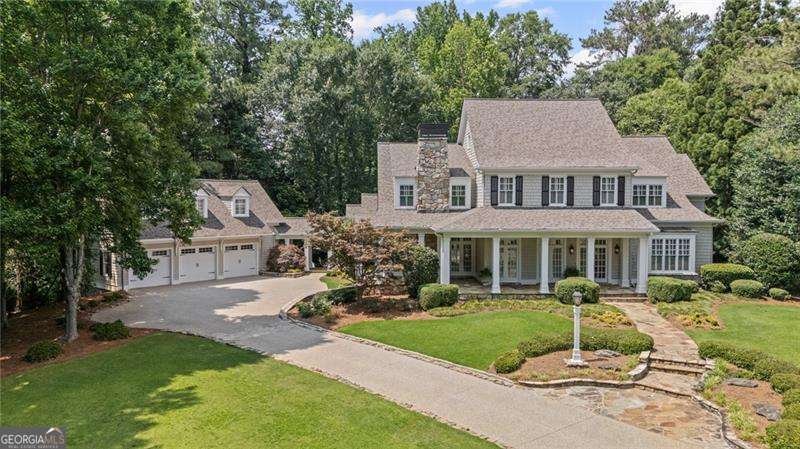
$775,000
6
bds
|
0
ba
|
4,134
sqft
|
built
1956
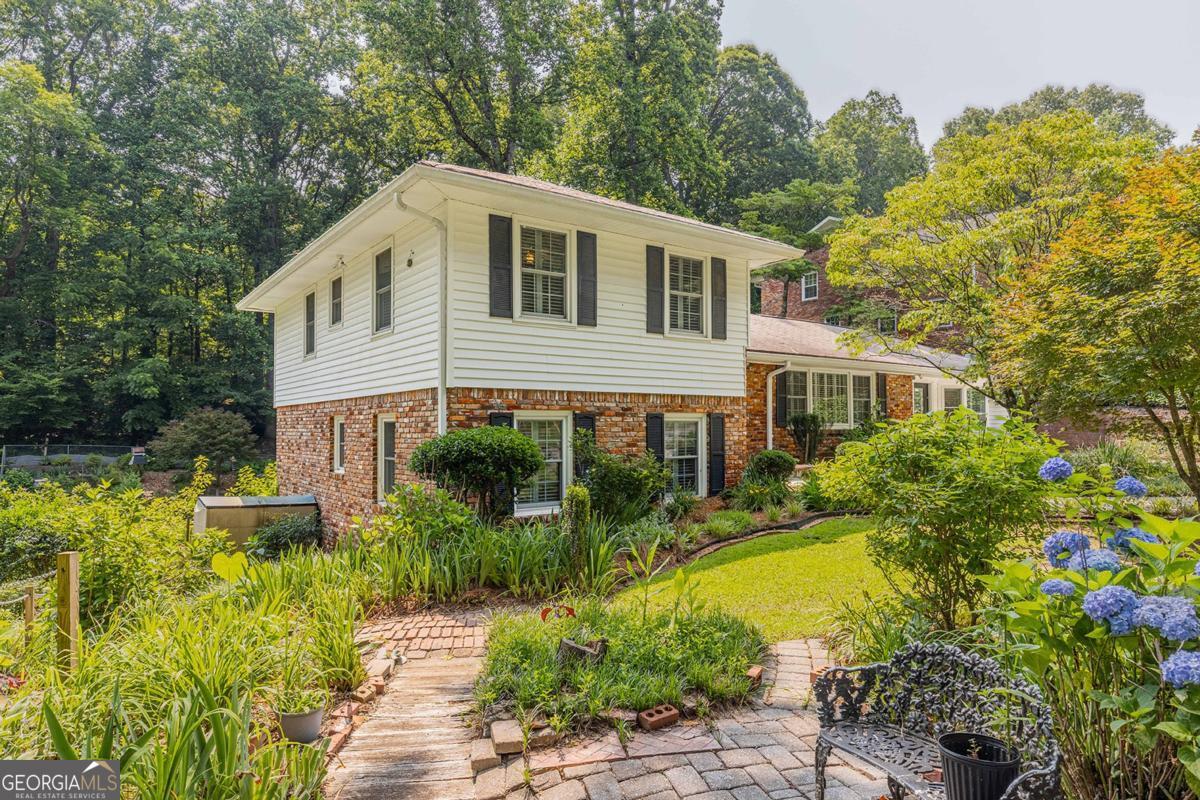
6771 Sunny Brook Ln, Sandy Springs, GA 30328
$-71
Cash flow
-0.5%
Cash-on-Cash Return
6.0%
Cap rate
0.8%
Rent to Value Ratio
165 out of 200 properties for sale in Sandy Springs, GA
Limited Results Shown
Create a free account, or log in to reveal all property listings and enjoy the complete experience.
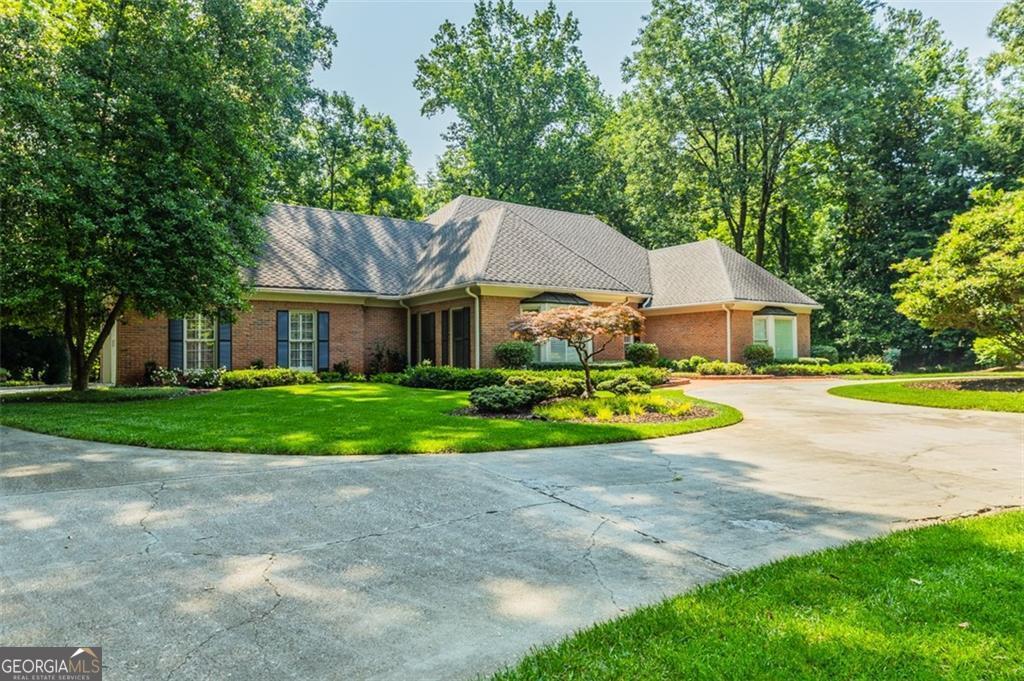
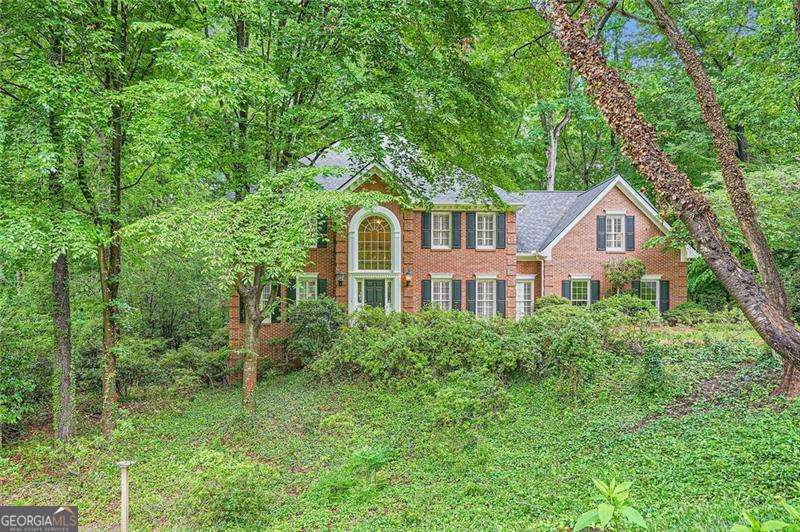
Active
$989,000
3
bds
|
0
ba
|
5,615
sqft
|
built
1981
3030 Spalding Dr, Sandy Springs, GA 30350
$-2,153
Cash flow
-11.4%
Cash-on-Cash Return
3.5%
Cap rate
0.5%
Rent to Value Ratio
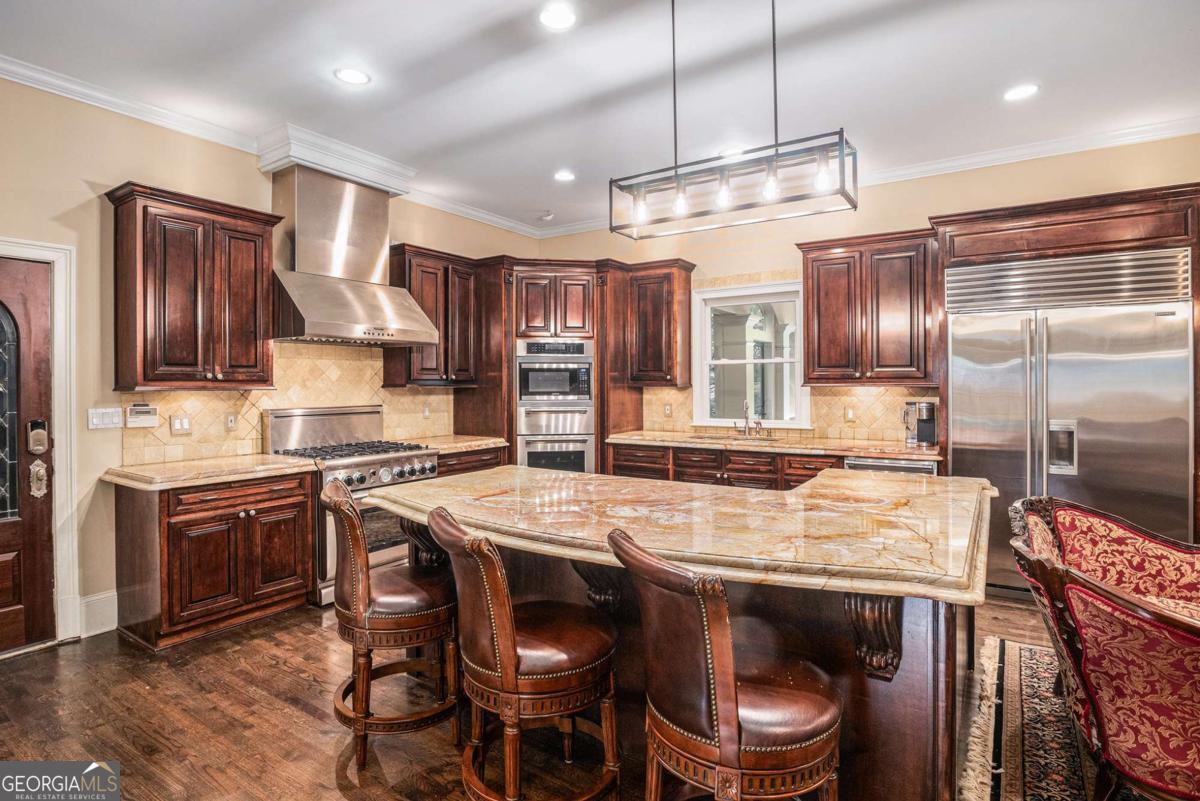
Active
$1,749,000
6
bds
|
0
ba
|
8,221
sqft
|
built
1982
7660 Treeridge Ct, Sandy Springs, GA 30350
$-5,181
Cash flow
-15.5%
Cash-on-Cash Return
2.6%
Cap rate
0.4%
Rent to Value Ratio
Active
$2,599,000
6
bds
|
0
ba
|
0
sqft
|
built
1997
585 Old Cobblestone Dr, Sandy Springs, GA 30350
$-10,308
Cash flow
-20.7%
Cash-on-Cash Return
1.4%
Cap rate
0.2%
Rent to Value Ratio
Pending
$995,000
3
bds
|
4
ba
|
2,842
sqft
|
built
1965
80 Maryeanna Dr, Sandy Springs, GA 30342
$-3,066
Cash flow
-16.1%
Cash-on-Cash Return
2.4%
Cap rate
0.4%
Rent to Value Ratio
Active
$2,900,000
6
bds
|
0
ba
|
8,091
sqft
|
built
2006
5284 Vernon Springs Trl, Sandy Springs, GA 30327
$-11,298
Cash flow
-20.3%
Cash-on-Cash Return
1.5%
Cap rate
0.3%
Rent to Value Ratio
Active
$675,000
3
bds
|
0
ba
|
2,152
sqft
|
built
1961
620 Amberidge Trl, Sandy Springs, GA 30328
$-1,483
Cash flow
-11.5%
Cash-on-Cash Return
3.5%
Cap rate
0.5%
Rent to Value Ratio
Active under contract
$875,000
4
bds
|
0
ba
|
3,934
sqft
|
built
1985
8480 Valemont Dr, Sandy Springs, GA 30350
$-2,016
Cash flow
-12.0%
Cash-on-Cash Return
3.4%
Cap rate
0.5%
Rent to Value Ratio
Active
$1,650,000
5
bds
|
0
ba
|
3,968
sqft
|
built
1972
805 Wesley Oak Rd, Sandy Springs, GA 30328
$-3,625
Cash flow
-11.5%
Cash-on-Cash Return
3.5%
Cap rate
0.5%
Rent to Value Ratio
Active under contract
$1,265,000
5
bds
|
0
ba
|
5,094
sqft
|
built
1972
1510 Chevron Dr, Sandy Springs, GA 30350
$-2,532
Cash flow
-10.4%
Cash-on-Cash Return
3.7%
Cap rate
0.6%
Rent to Value Ratio
Active
$875,000
4
bds
|
0
ba
|
3,850
sqft
|
built
1983
7110 Northgreen Dr, Sandy Springs, GA 30328
$-2,445
Cash flow
-14.6%
Cash-on-Cash Return
2.8%
Cap rate
0.4%
Rent to Value Ratio
Active
$650,000
4
bds
|
0
ba
|
3,081
sqft
|
built
1978
5065 Nesbit Ferry Ln, Sandy Springs, GA 30350
$-1,174
Cash flow
-9.4%
Cash-on-Cash Return
4.0%
Cap rate
0.6%
Rent to Value Ratio
Active
$215,000
2
bds
|
2
ba
|
1,039
sqft
|
built
1966
5400 Roswell Rd, Sandy Springs, GA 30342
$-631
Cash flow
-15.3%
Cash-on-Cash Return
2.6%
Cap rate
0.8%
Rent to Value Ratio
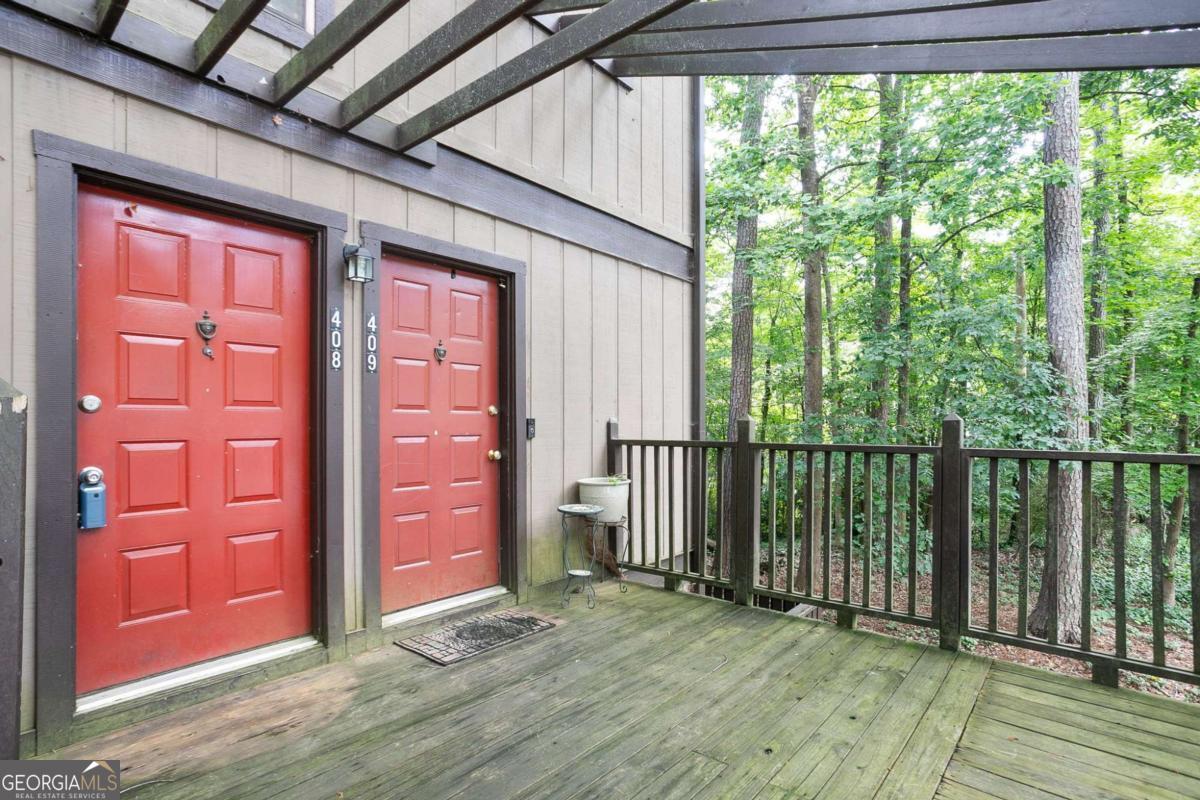
Active
$185,000
1
bds
|
0
ba
|
0
sqft
|
built
1983
408 River Run Dr, Sandy Springs, GA 30350
$-435
Cash flow
-12.3%
Cash-on-Cash Return
3.3%
Cap rate
0.9%
Rent to Value Ratio
Active
$285,000
3
bds
|
0
ba
|
0
sqft
|
built
1964
6851 Roswell Rd, Sandy Springs, GA 30328
$-653
Cash flow
-12.0%
Cash-on-Cash Return
3.4%
Cap rate
0.8%
Rent to Value Ratio
Active
$619,900
4
bds
|
0
ba
|
2,731
sqft
|
built
1981
405 Forest Valley Rd, Sandy Springs, GA 30342
$-771
Cash flow
-6.5%
Cash-on-Cash Return
4.7%
Cap rate
0.6%
Rent to Value Ratio
Active
$3,300,000
8
bds
|
10
ba
|
13,092
sqft
|
built
1985
70 Finch Forest Trl, Sandy Springs, GA 30327
$-14,920
Cash flow
-23.6%
Cash-on-Cash Return
0.7%
Cap rate
0.2%
Rent to Value Ratio
Active
$800,000
6
bds
|
0
ba
|
0
sqft
|
built
1981
8120 Ball Mill Rd, Sandy Springs, GA 30350
$-1,519
Cash flow
-9.9%
Cash-on-Cash Return
3.9%
Cap rate
0.5%
Rent to Value Ratio
Active
$709,500
5
bds
|
0
ba
|
2,925
sqft
|
built
1978
6100 Blackwater Trl, Sandy Springs, GA 30328
$-1,417
Cash flow
-10.4%
Cash-on-Cash Return
3.7%
Cap rate
0.6%
Rent to Value Ratio
Active under contract
$729,000
4
bds
|
0
ba
|
2,800
sqft
|
built
1958
6878 Brandon Mill Rd, Sandy Springs, GA 30328
$-2,441
Cash flow
-17.5%
Cash-on-Cash Return
2.1%
Cap rate
0.3%
Rent to Value Ratio
Active
$900,000
6
bds
|
0
ba
|
0
sqft
|
built
2013
7790 Stratford Ln, Sandy Springs, GA 30350
$-2,103
Cash flow
-12.2%
Cash-on-Cash Return
3.3%
Cap rate
0.6%
Rent to Value Ratio
Active
$699,900
4
bds
|
0
ba
|
3,848
sqft
|
built
1958
6825 Castleton Dr, Sandy Springs, GA 30328
$-999
Cash flow
-7.4%
Cash-on-Cash Return
4.4%
Cap rate
0.6%
Rent to Value Ratio
Active
$950,000
6
bds
|
0
ba
|
6,360
sqft
|
built
1982
8255 Habersham Waters Rd, Sandy Springs, GA 30350
$-1,859
Cash flow
-10.2%
Cash-on-Cash Return
3.8%
Cap rate
0.6%
Rent to Value Ratio
Active
$935,000
7
bds
|
5
ba
|
0
sqft
|
built
1984
410 Glenmont Ct, Sandy Springs, GA 30350
$-1,922
Cash flow
-10.7%
Cash-on-Cash Return
3.7%
Cap rate
0.6%
Rent to Value Ratio
Active
$800,000
3
bds
|
0
ba
|
2,148
sqft
|
built
2019
6613 Encore Blvd, Sandy Springs, GA 30328
$-1,653
Cash flow
-10.8%
Cash-on-Cash Return
3.7%
Cap rate
0.6%
Rent to Value Ratio
Active
$1,795,000
4
bds
|
0
ba
|
0
sqft
|
built
1989
115 Cross Roads Ct, Sandy Springs, GA 30327
$-5,444
Cash flow
-15.8%
Cash-on-Cash Return
2.5%
Cap rate
0.4%
Rent to Value Ratio
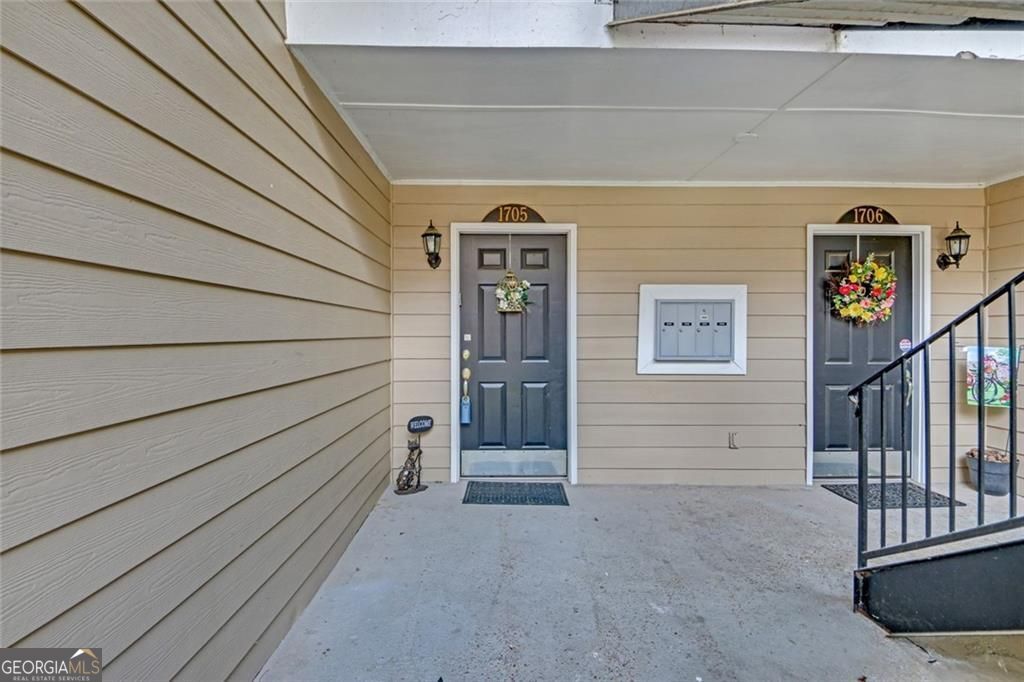
Active
$318,900
3
bds
|
0
ba
|
1,425
sqft
|
built
1978
1705 Brighton Pt, Sandy Springs, GA 30328
$-150
Cash flow
-2.5%
Cash-on-Cash Return
5.6%
Cap rate
0.7%
Rent to Value Ratio
Active
$1,750,000
3
bds
|
3
ba
|
0
sqft
|
built
1974
5680 Whitner Dr, Sandy Springs, GA 30327
$-5,756
Cash flow
-17.2%
Cash-on-Cash Return
2.2%
Cap rate
0.3%
Rent to Value Ratio
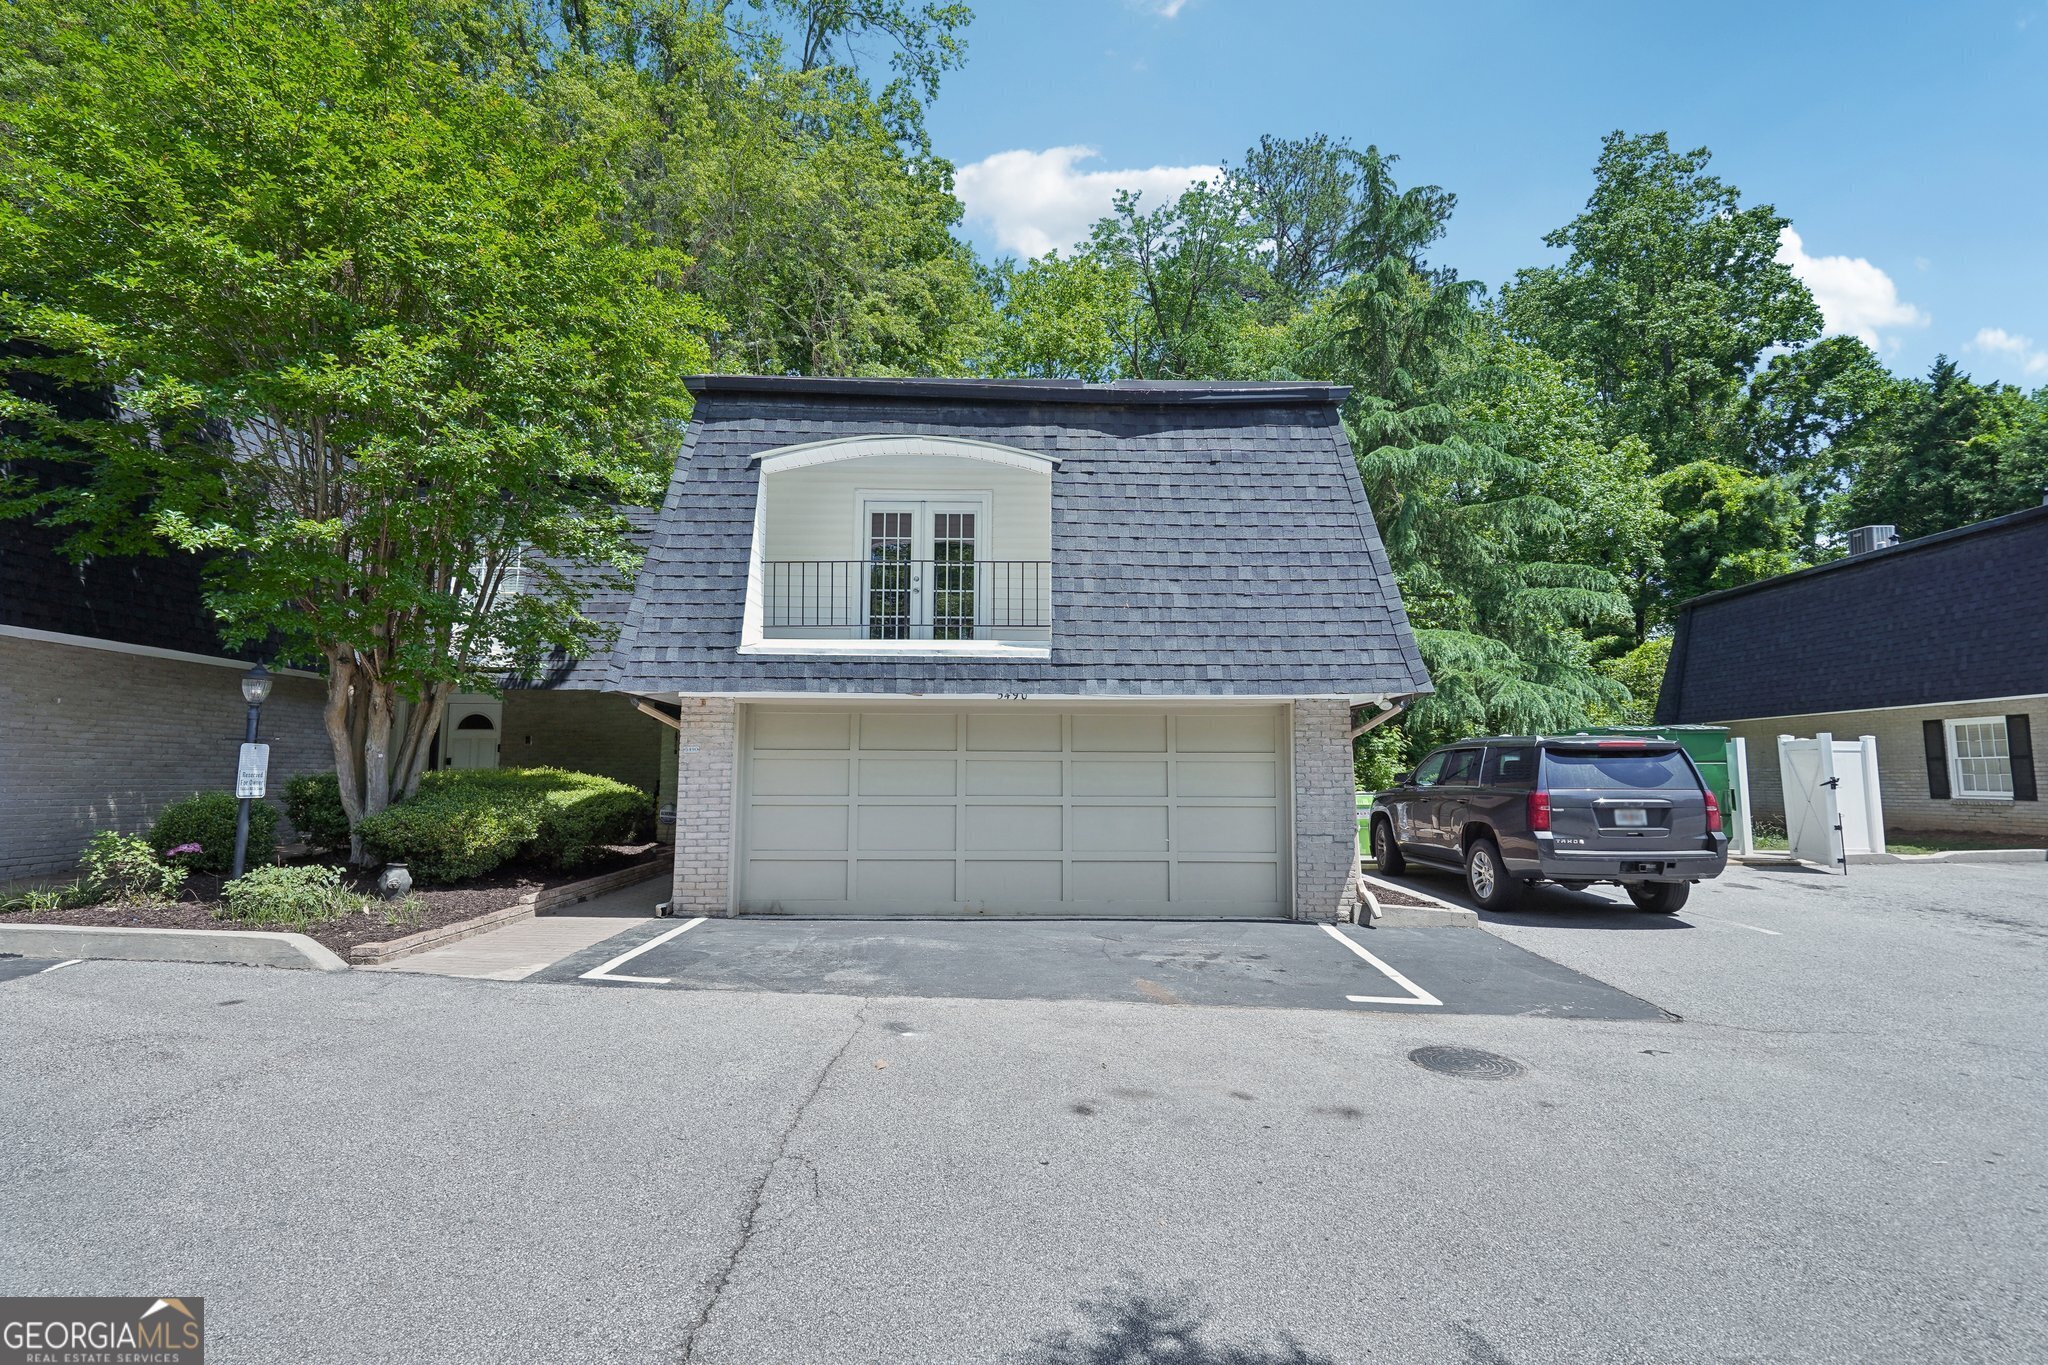
Active
$419,900
3
bds
|
0
ba
|
2,138
sqft
|
built
1975
5490 Chemin De Vie, Sandy Springs, GA 30342
$-1,217
Cash flow
-15.1%
Cash-on-Cash Return
2.7%
Cap rate
0.6%
Rent to Value Ratio
Active
$775,000
6
bds
|
0
ba
|
4,134
sqft
|
built
1956
6771 Sunny Brook Ln, Sandy Springs, GA 30328
$-71
Cash flow
-0.5%
Cash-on-Cash Return
6.0%
Cap rate
0.8%
Rent to Value Ratio
Active under contract
$1,900,000
7
bds
|
0
ba
|
7,675
sqft
|
built
1965
860 Crest Valley Dr, Sandy Springs, GA 30327
$-6,523
Cash flow
-17.9%
Cash-on-Cash Return
2.0%
Cap rate
0.4%
Rent to Value Ratio
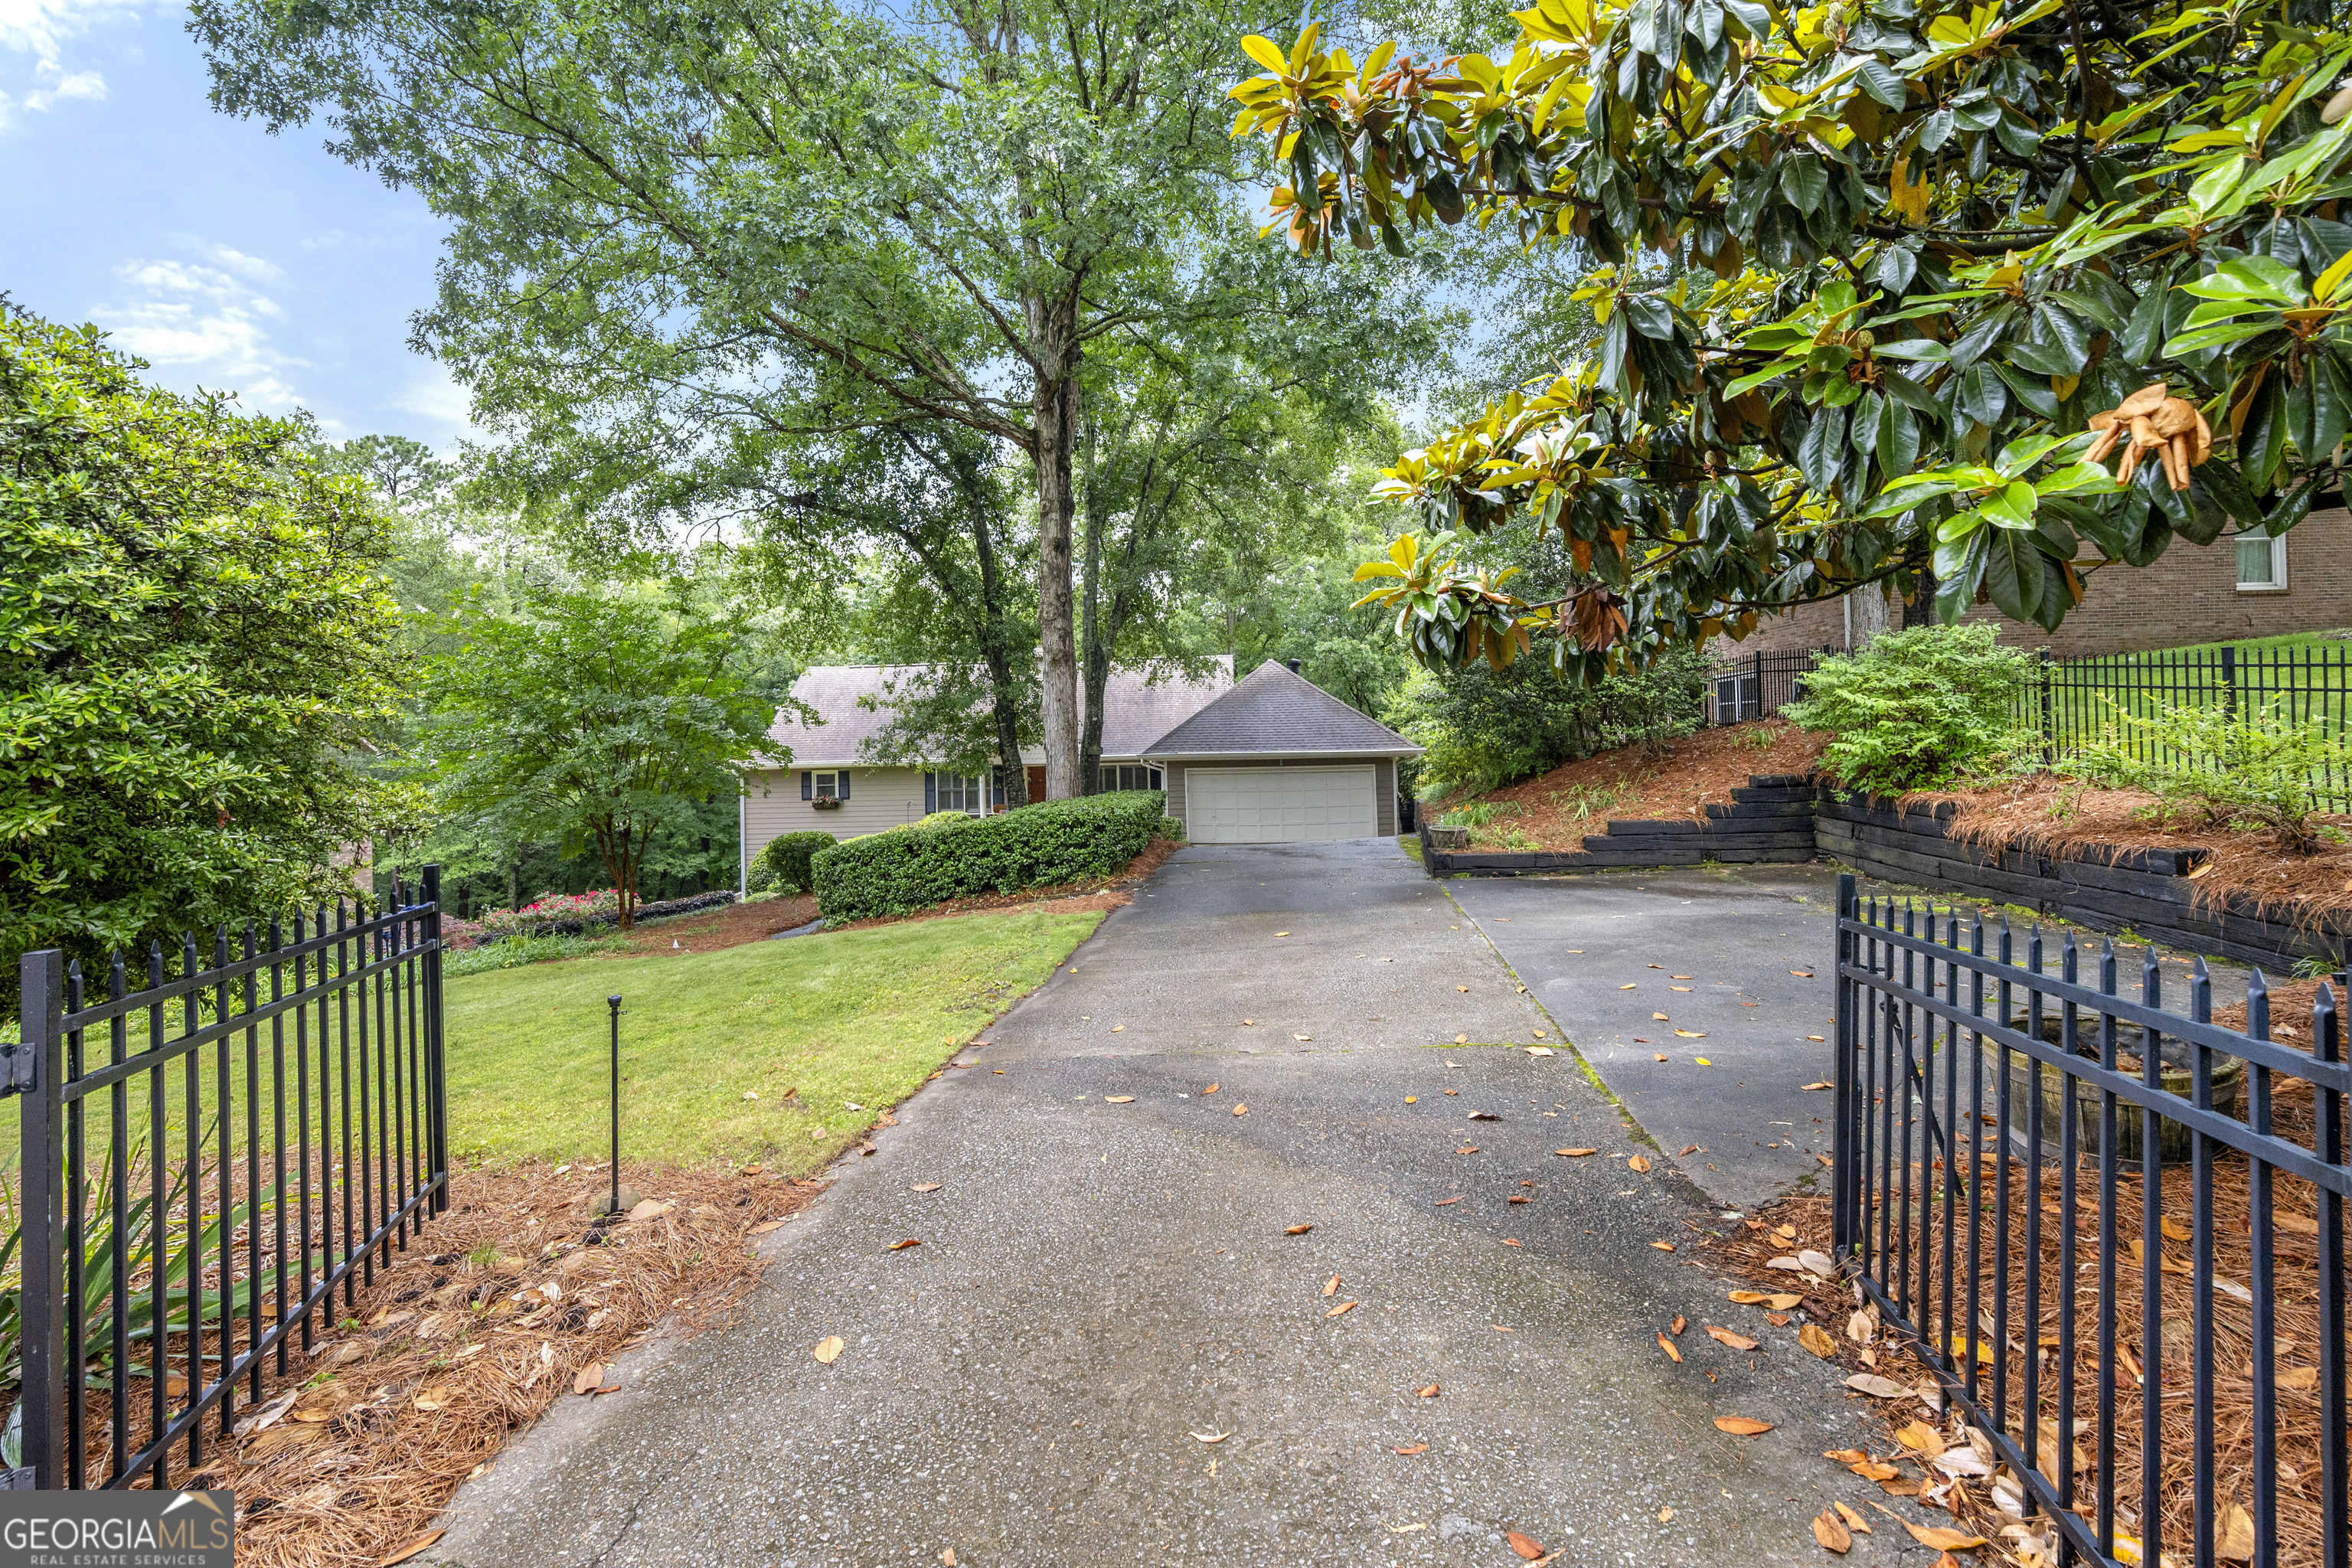
Active
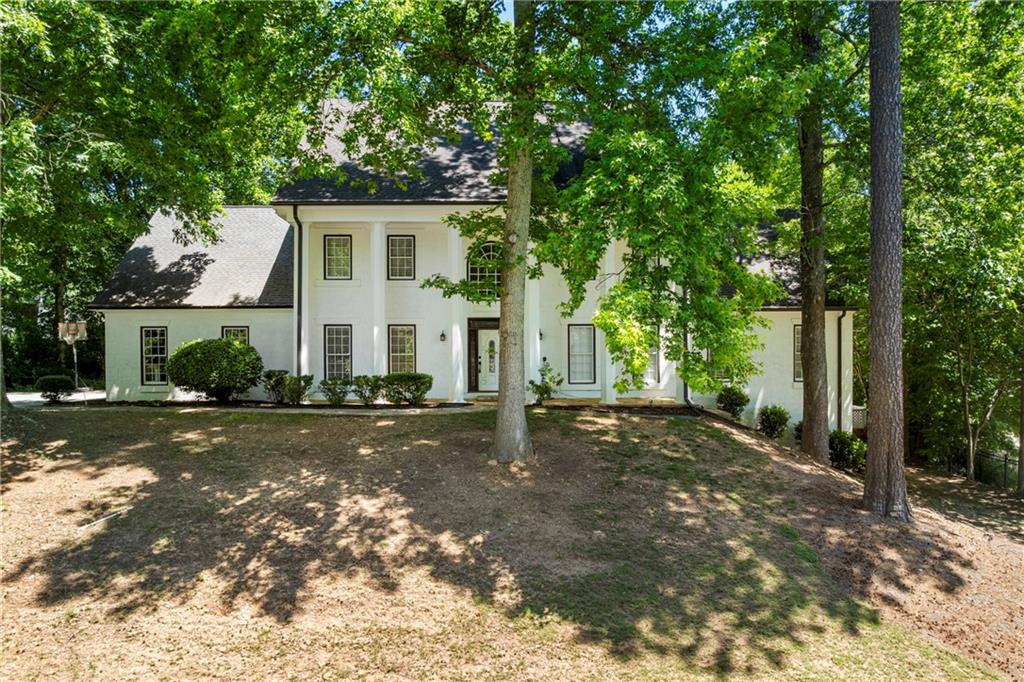
$359,000
4
bds
|
2
ba
|
1,780
sqft
|
built
2018
105 Jefferson Cir, Sandy Springs, GA 30328
$468
Cash flow
6.8%
Cash-on-Cash Return
7.7%
Cap rate
1.1%
Rent to Value Ratio
Active
$1,875,000
6
bds
|
0
ba
|
8,194
sqft
|
built
1997
314 Caruso Ct, Sandy Springs, GA 30350
$-6,991
Cash flow
-19.5%
Cash-on-Cash Return
1.7%
Cap rate
0.3%
Rent to Value Ratio
Active
$2,400,000
4
bds
|
6
ba
|
0
sqft
|
built
1980
6305 River Chase Cir, Sandy Springs, GA 30328
$-7,508
Cash flow
-16.3%
Cash-on-Cash Return
2.4%
Cap rate
0.4%
Rent to Value Ratio
Active under contract
$899,900
4
bds
|
3
ba
|
4,247
sqft
|
built
1971
965 Heards Ferry Rd, Sandy Springs, GA 30328
$-2,001
Cash flow
-11.6%
Cash-on-Cash Return
3.5%
Cap rate
0.5%
Rent to Value Ratio
Active
$899,900
5
bds
|
0
ba
|
4,400
sqft
|
built
1982
8470 Valemont Dr, Sandy Springs, GA 30350
$-2,157
Cash flow
-12.5%
Cash-on-Cash Return
3.3%
Cap rate
0.5%
Rent to Value Ratio
Active
$650,000
4
bds
|
0
ba
|
1,929
sqft
|
built
1967
220 N Springs Ct, Sandy Springs, GA 30328
$-1,229
Cash flow
-9.9%
Cash-on-Cash Return
3.9%
Cap rate
0.6%
Rent to Value Ratio
Active
$995,000
6
bds
|
0
ba
|
5,956
sqft
|
built
1973
9995 Huntcliff Trce, Sandy Springs, GA 30350
$-2,646
Cash flow
-13.9%
Cash-on-Cash Return
3.0%
Cap rate
0.5%
Rent to Value Ratio
Active
$815,000
3
bds
|
0
ba
|
3,450
sqft
|
built
2002
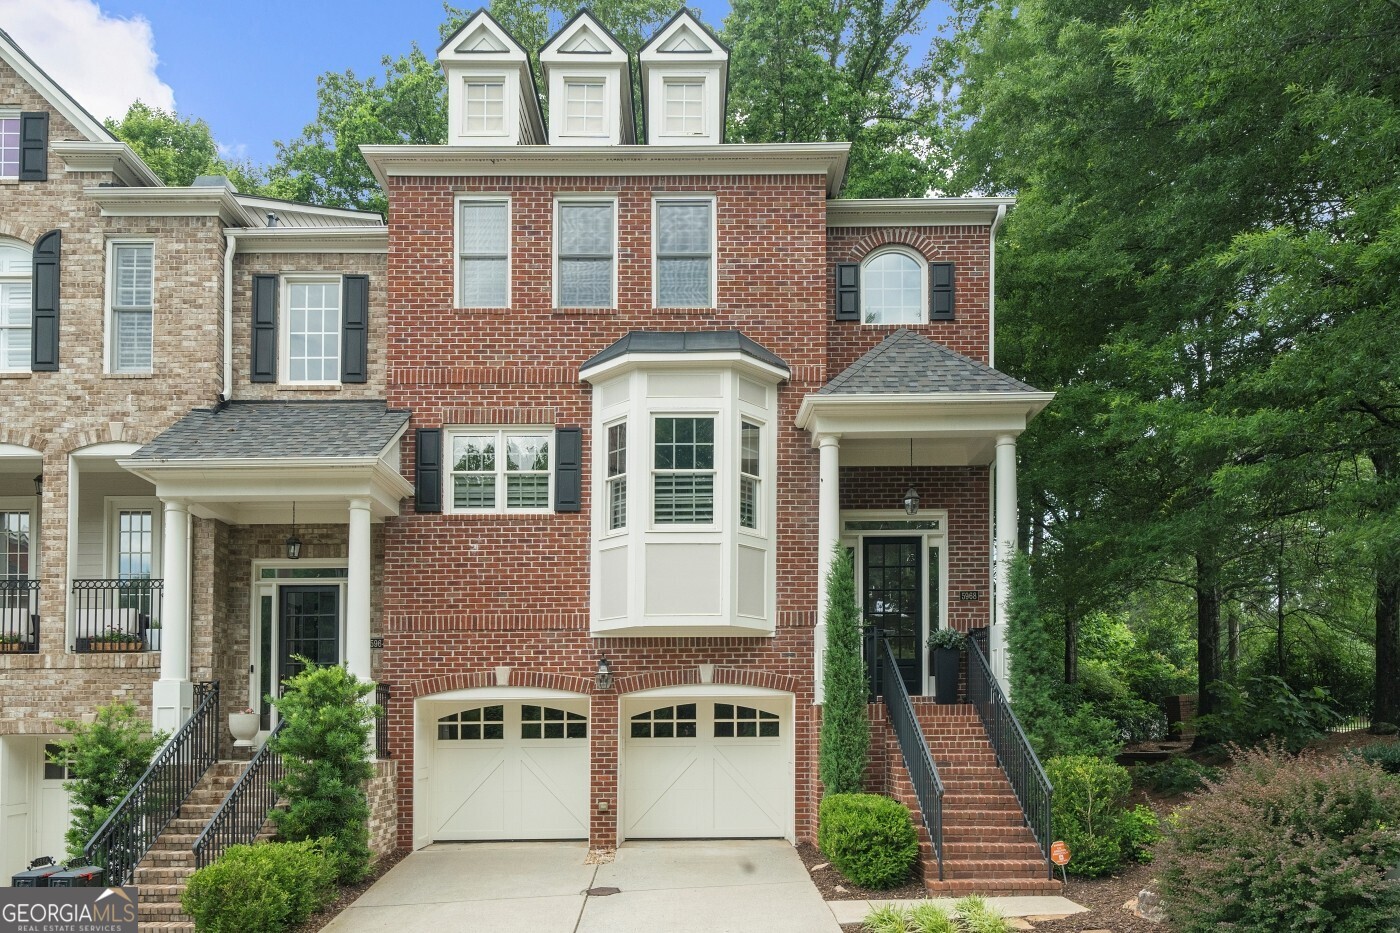
5968 Reddington Way, Sandy Springs, GA 30328
$-1,456
Cash flow
-9.3%
Cash-on-Cash Return
4.0%
Cap rate
0.7%
Rent to Value Ratio
Active
$975,000
4
bds
|
0
ba
|
4,520
sqft
|
built
1983
360 Spindle Ct, Sandy Springs, GA 30350
$-1,518
Cash flow
-8.1%
Cash-on-Cash Return
4.3%
Cap rate
0.6%
Rent to Value Ratio

Active
$1,200,000
3
bds
|
3
ba
|
2,462
sqft
|
built
1968
7265 Hunters Branch Dr, Sandy Springs, GA 30328
$-1,838
Cash flow
-8.0%
Cash-on-Cash Return
4.3%
Cap rate
0.6%
Rent to Value Ratio