Sandy Springs, GA Investment Properties for Sale
Browse homes for sale and investment properties in Sandy Springs, GA. Refine your search by price, property type, or more.
Best cash flowing properties in Sandy Springs, GA
Active
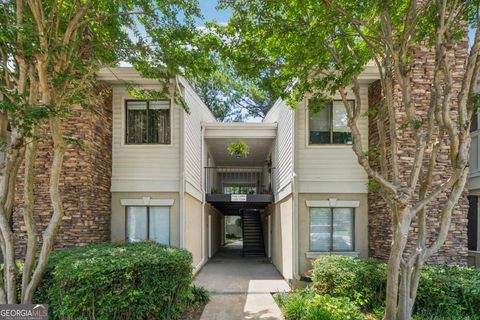
$165,000
1
bds
|
0
ba
|
794
sqft
|
built
1985
1504 Wingate Way, Sandy Springs, GA 30350
$-286
Cash flow
-9.0%
Cash-on-Cash Return
4.2%
Cap rate
0.9%
Rent to Value Ratio
Active
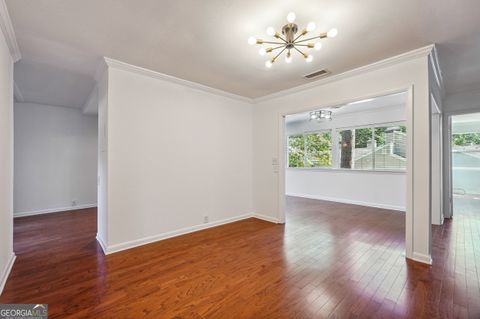
$329,000
2
bds
|
0
ba
|
1,900
sqft
|
built
1985
30 Dunwoody Springs Dr, Sandy Springs, GA 30328
$-296
Cash flow
-4.7%
Cash-on-Cash Return
5.1%
Cap rate
0.8%
Rent to Value Ratio
167 out of 208 properties for sale in Sandy Springs, GA
Limited Results Shown
Create a free account, or log in to reveal all property listings and enjoy the complete experience.
Active
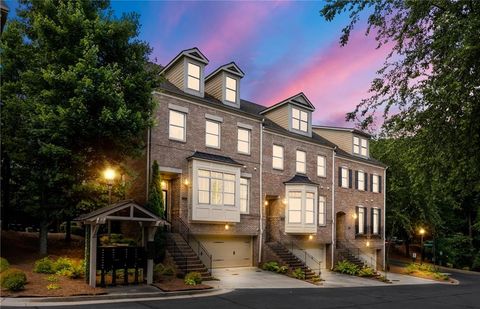
$765,000
3
bds
|
5
ba
|
3,572
sqft
|
built
2007
538 Sarabrook Pl, Sandy Springs, GA 30342
$-1,432
Cash flow
-9.8%
Cash-on-Cash Return
4.0%
Cap rate
0.7%
Rent to Value Ratio
Active
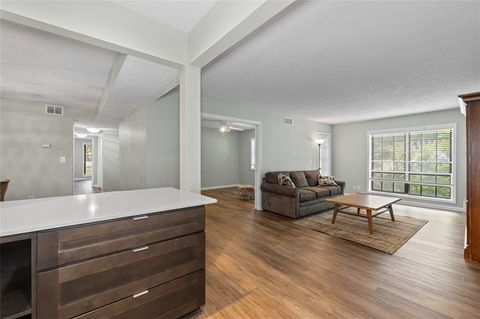
$298,500
3
bds
|
2
ba
|
0
sqft
|
built
1964
6851 Roswell Rd, Sandy Springs, GA 30328
$-774
Cash flow
-13.5%
Cash-on-Cash Return
3.0%
Cap rate
0.7%
Rent to Value Ratio
Active
$750,000
4
bds
|
0
ba
|
0
sqft
|
built
2003
196 Mystic Ct, Sandy Springs, GA 30342
$-2,066
Cash flow
-14.4%
Cash-on-Cash Return
3.0%
Cap rate
0.5%
Rent to Value Ratio
Active
$850,000
5
bds
|
0
ba
|
117
sqft
|
built
1977
300 Stone Mill Trl, Sandy Springs, GA 30328
$-1,871
Cash flow
-11.5%
Cash-on-Cash Return
3.6%
Cap rate
0.5%
Rent to Value Ratio
Active
$1,425,000
5
bds
|
0
ba
|
6,800
sqft
|
built
1986
5105 Jett Forest Trl, Sandy Springs, GA 30327
$-2,576
Cash flow
-9.4%
Cash-on-Cash Return
4.1%
Cap rate
0.6%
Rent to Value Ratio

Active
$875,000
5
bds
|
0
ba
|
4,980
sqft
|
built
1983
410 Waterridge Ct, Sandy Springs, GA 30350
$-2,108
Cash flow
-12.6%
Cash-on-Cash Return
3.4%
Cap rate
0.5%
Rent to Value Ratio
Active
$565,000
4
bds
|
0
ba
|
2,123
sqft
|
built
2020
350 Provenance Dr, Sandy Springs, GA 30328
$-1,039
Cash flow
-9.6%
Cash-on-Cash Return
4.1%
Cap rate
0.6%
Rent to Value Ratio
Active
$950,000
4
bds
|
5
ba
|
0
sqft
|
built
2016
5836 Sandy Springs Cir, Sandy Springs, GA 30328
$-3,149
Cash flow
-17.3%
Cash-on-Cash Return
2.3%
Cap rate
0.5%
Rent to Value Ratio
Active
$1,095,000
4
bds
|
0
ba
|
3,526
sqft
|
built
1978
6300 Blackwater Trl, Sandy Springs, GA 30328
$-2,727
Cash flow
-13.0%
Cash-on-Cash Return
3.3%
Cap rate
0.5%
Rent to Value Ratio
Active
$1,200,000
4
bds
|
0
ba
|
5,000
sqft
|
built
1988
2885 Coles Way, Sandy Springs, GA 30350
$-2,475
Cash flow
-10.8%
Cash-on-Cash Return
3.7%
Cap rate
0.5%
Rent to Value Ratio
Active
$2,295,000
6
bds
|
8
ba
|
8,759
sqft
|
built
2007
980 Fenimore Cir, Sandy Springs, GA 30350
$-8,761
Cash flow
-19.9%
Cash-on-Cash Return
1.6%
Cap rate
0.3%
Rent to Value Ratio
Active
$165,000
1
bds
|
0
ba
|
794
sqft
|
built
1985
1504 Wingate Way, Sandy Springs, GA 30350
$-286
Cash flow
-9.0%
Cash-on-Cash Return
4.2%
Cap rate
0.9%
Rent to Value Ratio
Active
$950,000
5
bds
|
0
ba
|
4,117
sqft
|
built
1982
1835 Redbourne Dr, Sandy Springs, GA 30350
$-2,430
Cash flow
-13.3%
Cash-on-Cash Return
3.2%
Cap rate
0.5%
Rent to Value Ratio

Active
$456,500
3
bds
|
0
ba
|
1,722
sqft
|
built
2004
7863 Kiverton Pl, Sandy Springs, GA 30350
$-845
Cash flow
-9.7%
Cash-on-Cash Return
4.0%
Cap rate
0.6%
Rent to Value Ratio
Active
$1,565,000
5
bds
|
6
ba
|
5,641
sqft
|
built
2007
400 Mabry Pl, Sandy Springs, GA 30319
$-5,484
Cash flow
-18.3%
Cash-on-Cash Return
2.1%
Cap rate
0.4%
Rent to Value Ratio

Active
$995,000
4
bds
|
0
ba
|
4,050
sqft
|
built
1961
335 Amberidge Trl, Sandy Springs, GA 30328
$-1,728
Cash flow
-9.1%
Cash-on-Cash Return
4.1%
Cap rate
0.6%
Rent to Value Ratio
Active
$1,250,000
6
bds
|
0
ba
|
5,979
sqft
|
built
2017
10 Nesbit Reserve Ct, Sandy Springs, GA 30350
$-3,836
Cash flow
-16.0%
Cash-on-Cash Return
2.6%
Cap rate
0.4%
Rent to Value Ratio
Active
$749,000
4
bds
|
0
ba
|
2,486
sqft
|
built
1971
285 Glen Lake Dr, Sandy Springs, GA 30327
$-1,152
Cash flow
-8.0%
Cash-on-Cash Return
4.3%
Cap rate
0.6%
Rent to Value Ratio
Active
$329,000
2
bds
|
0
ba
|
1,900
sqft
|
built
1985
30 Dunwoody Springs Dr, Sandy Springs, GA 30328
$-296
Cash flow
-4.7%
Cash-on-Cash Return
5.1%
Cap rate
0.8%
Rent to Value Ratio
Active
$1,895,000
6
bds
|
4
ba
|
4,709
sqft
|
built
1969
5545 Cross Gate Ct, Sandy Springs, GA 30327
$-4,333
Cash flow
-11.9%
Cash-on-Cash Return
3.5%
Cap rate
0.5%
Rent to Value Ratio
Active
$675,000
3
bds
|
0
ba
|
2,639
sqft
|
built
1958
680 Carriage Dr, Sandy Springs, GA 30328
$-2,064
Cash flow
-16.0%
Cash-on-Cash Return
2.6%
Cap rate
0.4%
Rent to Value Ratio
Active
$265,000
2
bds
|
0
ba
|
1,225
sqft
|
built
1978
603 Brighton Pt, Sandy Springs, GA 30328
$-471
Cash flow
-9.3%
Cash-on-Cash Return
4.1%
Cap rate
0.8%
Rent to Value Ratio
Active
$1,450,000
5
bds
|
0
ba
|
4,107
sqft
|
built
1967
6175 Weatherly Dr, Sandy Springs, GA 30328
$-2,252
Cash flow
-8.1%
Cash-on-Cash Return
4.4%
Cap rate
0.6%
Rent to Value Ratio

Active
$989,000
3
bds
|
0
ba
|
5,615
sqft
|
built
1981
3030 Spalding Dr, Sandy Springs, GA 30350
$-2,153
Cash flow
-11.4%
Cash-on-Cash Return
3.5%
Cap rate
0.5%
Rent to Value Ratio
Active
$750,000
4
bds
|
0
ba
|
2,536
sqft
|
built
1997
740 Orchard Ct, Sandy Springs, GA 30328
$-1,665
Cash flow
-11.6%
Cash-on-Cash Return
3.6%
Cap rate
0.5%
Rent to Value Ratio
Active
$1,425,000
6
bds
|
0
ba
|
5,526
sqft
|
built
2001
125 Franklin Pl, Sandy Springs, GA 30342
$-4,189
Cash flow
-15.3%
Cash-on-Cash Return
2.7%
Cap rate
0.5%
Rent to Value Ratio
Active
$1,700,000
7
bds
|
5
ba
|
6,708
sqft
|
built
1972
8316 Hewlett Rd, Sandy Springs, GA 30350
$-3,544
Cash flow
-10.9%
Cash-on-Cash Return
3.6%
Cap rate
0.5%
Rent to Value Ratio
Active
$995,000
4
bds
|
0
ba
|
2,805
sqft
|
built
1967
955 Landmark Dr, Sandy Springs, GA 30342
$-1,878
Cash flow
-9.8%
Cash-on-Cash Return
4.0%
Cap rate
0.6%
Rent to Value Ratio
Active
$824,000
4
bds
|
0
ba
|
3,839
sqft
|
built
1969
1605 Saint Tropez Way, Sandy Springs, GA 30350
$-1,439
Cash flow
-9.1%
Cash-on-Cash Return
4.1%
Cap rate
0.6%
Rent to Value Ratio
Active
$460,000
3
bds
|
0
ba
|
1,742
sqft
|
built
2004
651 Coligny Ct, Sandy Springs, GA 30350
$-1,060
Cash flow
-12.0%
Cash-on-Cash Return
3.5%
Cap rate
0.6%
Rent to Value Ratio

Active
$2,599,000
6
bds
|
0
ba
|
0
sqft
|
built
1997
585 Old Cobblestone Dr, Sandy Springs, GA 30350
$-10,308
Cash flow
-20.7%
Cash-on-Cash Return
1.4%
Cap rate
0.2%
Rent to Value Ratio

Active
$2,900,000
6
bds
|
0
ba
|
8,091
sqft
|
built
2006
5284 Vernon Springs Trl, Sandy Springs, GA 30327
$-11,298
Cash flow
-20.3%
Cash-on-Cash Return
1.5%
Cap rate
0.3%
Rent to Value Ratio

Active
$675,000
3
bds
|
0
ba
|
2,152
sqft
|
built
1961
620 Amberidge Trl, Sandy Springs, GA 30328
$-1,483
Cash flow
-11.5%
Cash-on-Cash Return
3.5%
Cap rate
0.5%
Rent to Value Ratio

Active
$1,650,000
5
bds
|
0
ba
|
3,968
sqft
|
built
1972
805 Wesley Oak Rd, Sandy Springs, GA 30328
$-3,625
Cash flow
-11.5%
Cash-on-Cash Return
3.5%
Cap rate
0.5%
Rent to Value Ratio
Active
$215,000
2
bds
|
2
ba
|
1,039
sqft
|
built
1966
5400 Roswell Rd, Sandy Springs, GA 30342
$-631
Cash flow
-15.3%
Cash-on-Cash Return
2.6%
Cap rate
0.8%
Rent to Value Ratio

Active
$865,000
4
bds
|
0
ba
|
3,850
sqft
|
built
1983
7110 Northgreen Dr, Sandy Springs, GA 30328
$-2,394
Cash flow
-14.4%
Cash-on-Cash Return
2.8%
Cap rate
0.4%
Rent to Value Ratio

Active
$185,000
1
bds
|
0
ba
|
0
sqft
|
built
1983
408 River Run Dr, Sandy Springs, GA 30350
$-435
Cash flow
-12.3%
Cash-on-Cash Return
3.3%
Cap rate
0.9%
Rent to Value Ratio
Active
$285,000
3
bds
|
0
ba
|
0
sqft
|
built
1964
6851 Roswell Rd, Sandy Springs, GA 30328
$-653
Cash flow
-12.0%
Cash-on-Cash Return
3.4%
Cap rate
0.8%
Rent to Value Ratio

Active
$3,300,000
8
bds
|
10
ba
|
13,092
sqft
|
built
1985
70 Finch Forest Trl, Sandy Springs, GA 30327
$-14,920
Cash flow
-23.6%
Cash-on-Cash Return
0.7%
Cap rate
0.2%
Rent to Value Ratio

Active
$609,900
4
bds
|
0
ba
|
2,731
sqft
|
built
1981
405 Forest Valley Rd, Sandy Springs, GA 30342
$-720
Cash flow
-6.2%
Cash-on-Cash Return
4.7%
Cap rate
0.7%
Rent to Value Ratio