Sebring, FL Investment Properties for Sale
Browse homes for sale and investment properties in Sebring, FL. Refine your search by price, property type, or more.
Best cash flowing properties in Sebring, FL
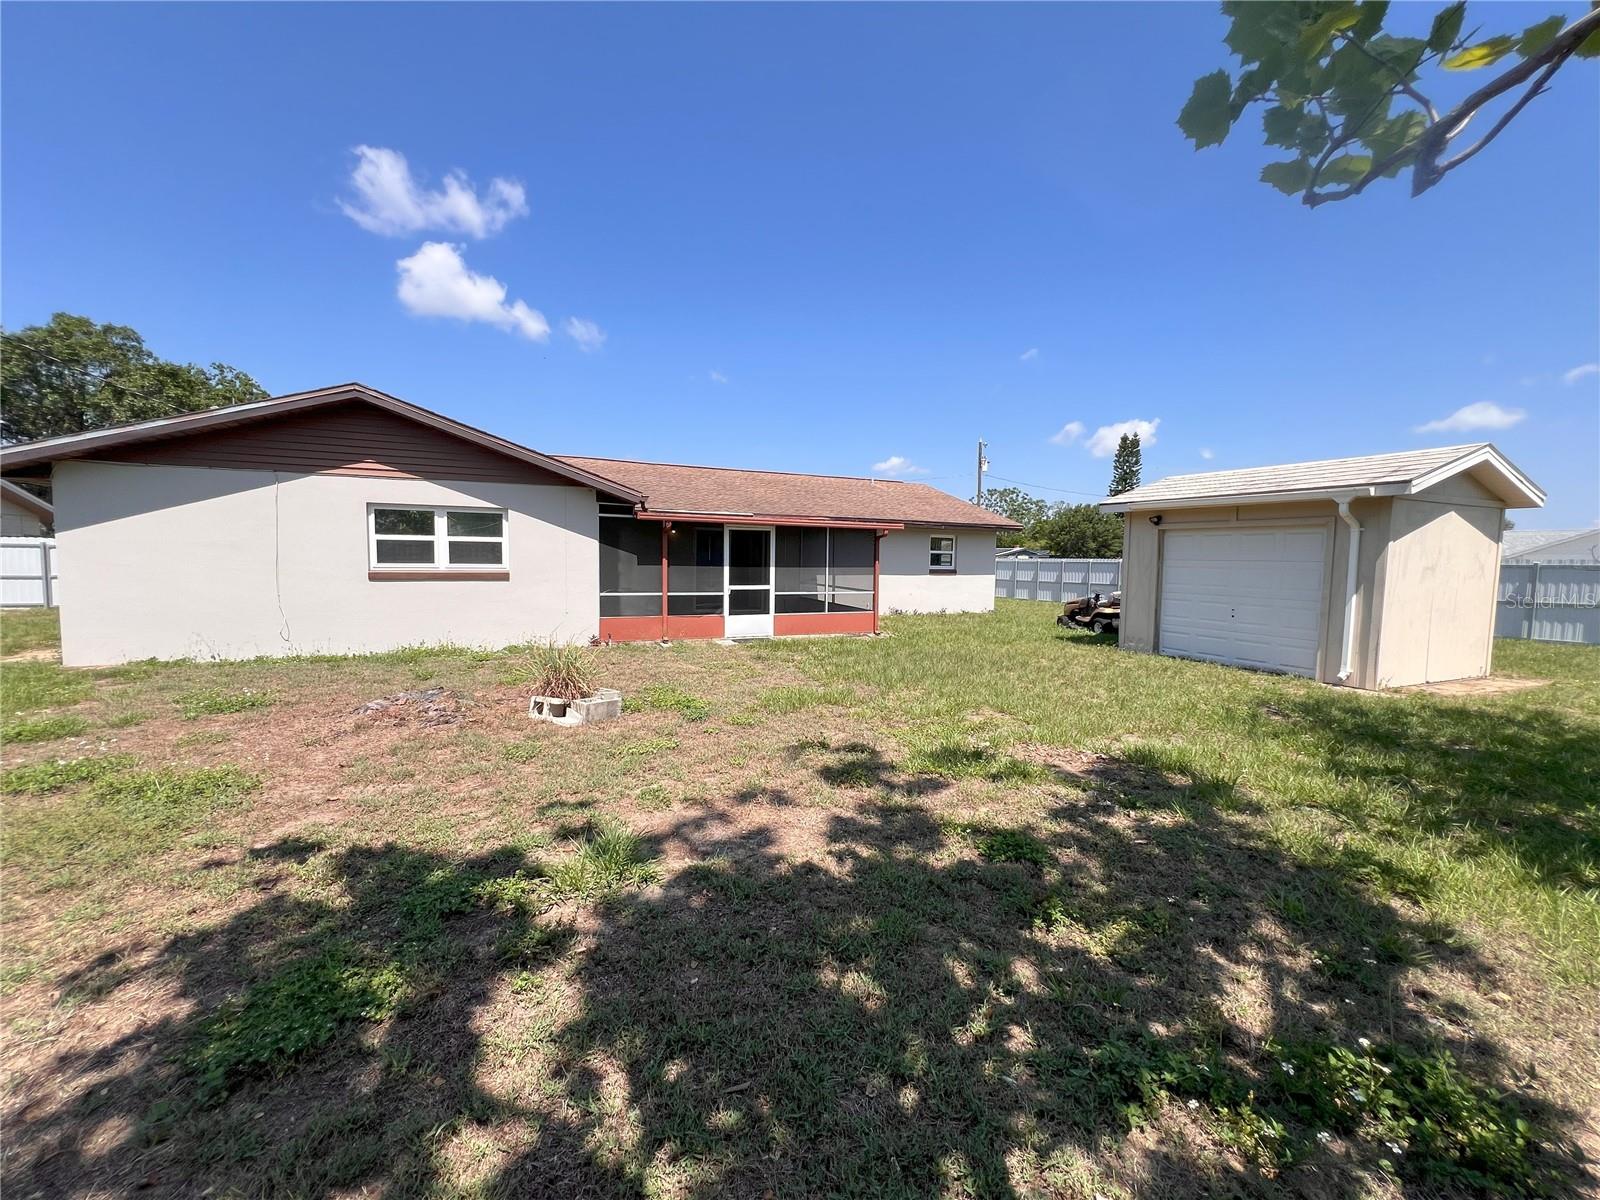
Active
$95,000
2
bds
|
1
ba
|
0
sqft
|
built
1983
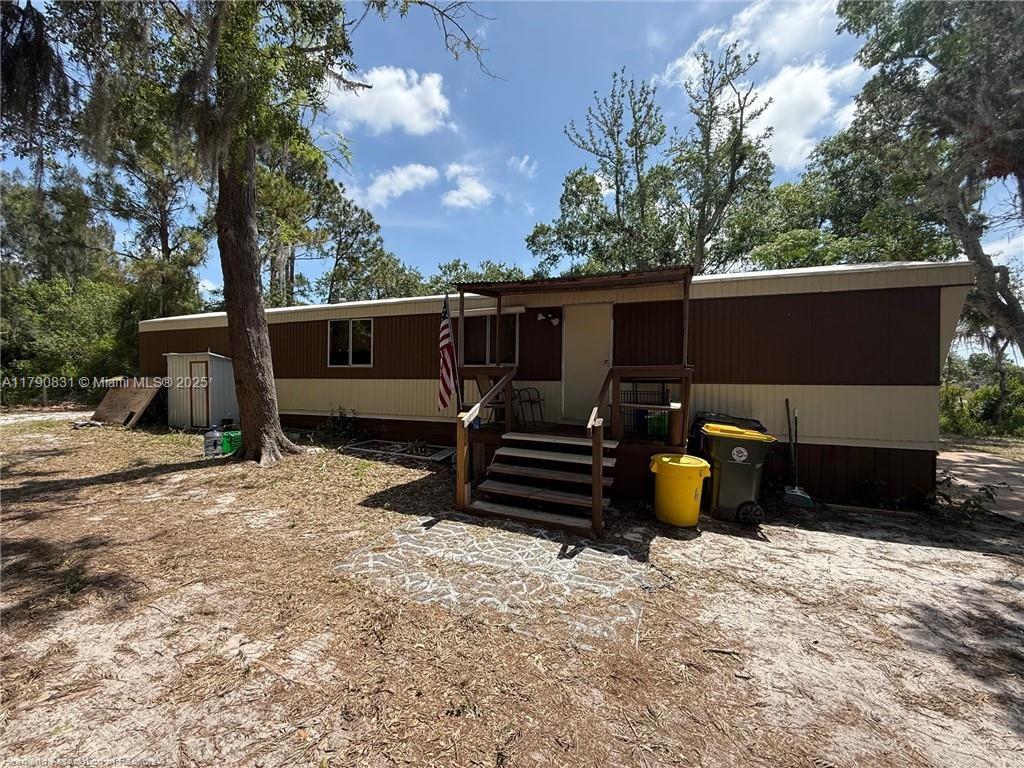
1515 Wilson Dr, Sebring, FL 33875
$182
Cash flow
10.0%
Cash-on-Cash Return
8.5%
Cap rate
1.2%
Rent to Value Ratio

Active
$159,900
2
bds
|
2
ba
|
1,090
sqft
|
built
1990
102 Villaway, Sebring, FL 33876
$27
Cash flow
0.9%
Cash-on-Cash Return
6.3%
Cap rate
0.9%
Rent to Value Ratio
60 out of 66 properties for sale in Sebring, FL
Limited Results Shown
Create a free account, or log in to reveal all property listings and enjoy the complete experience.
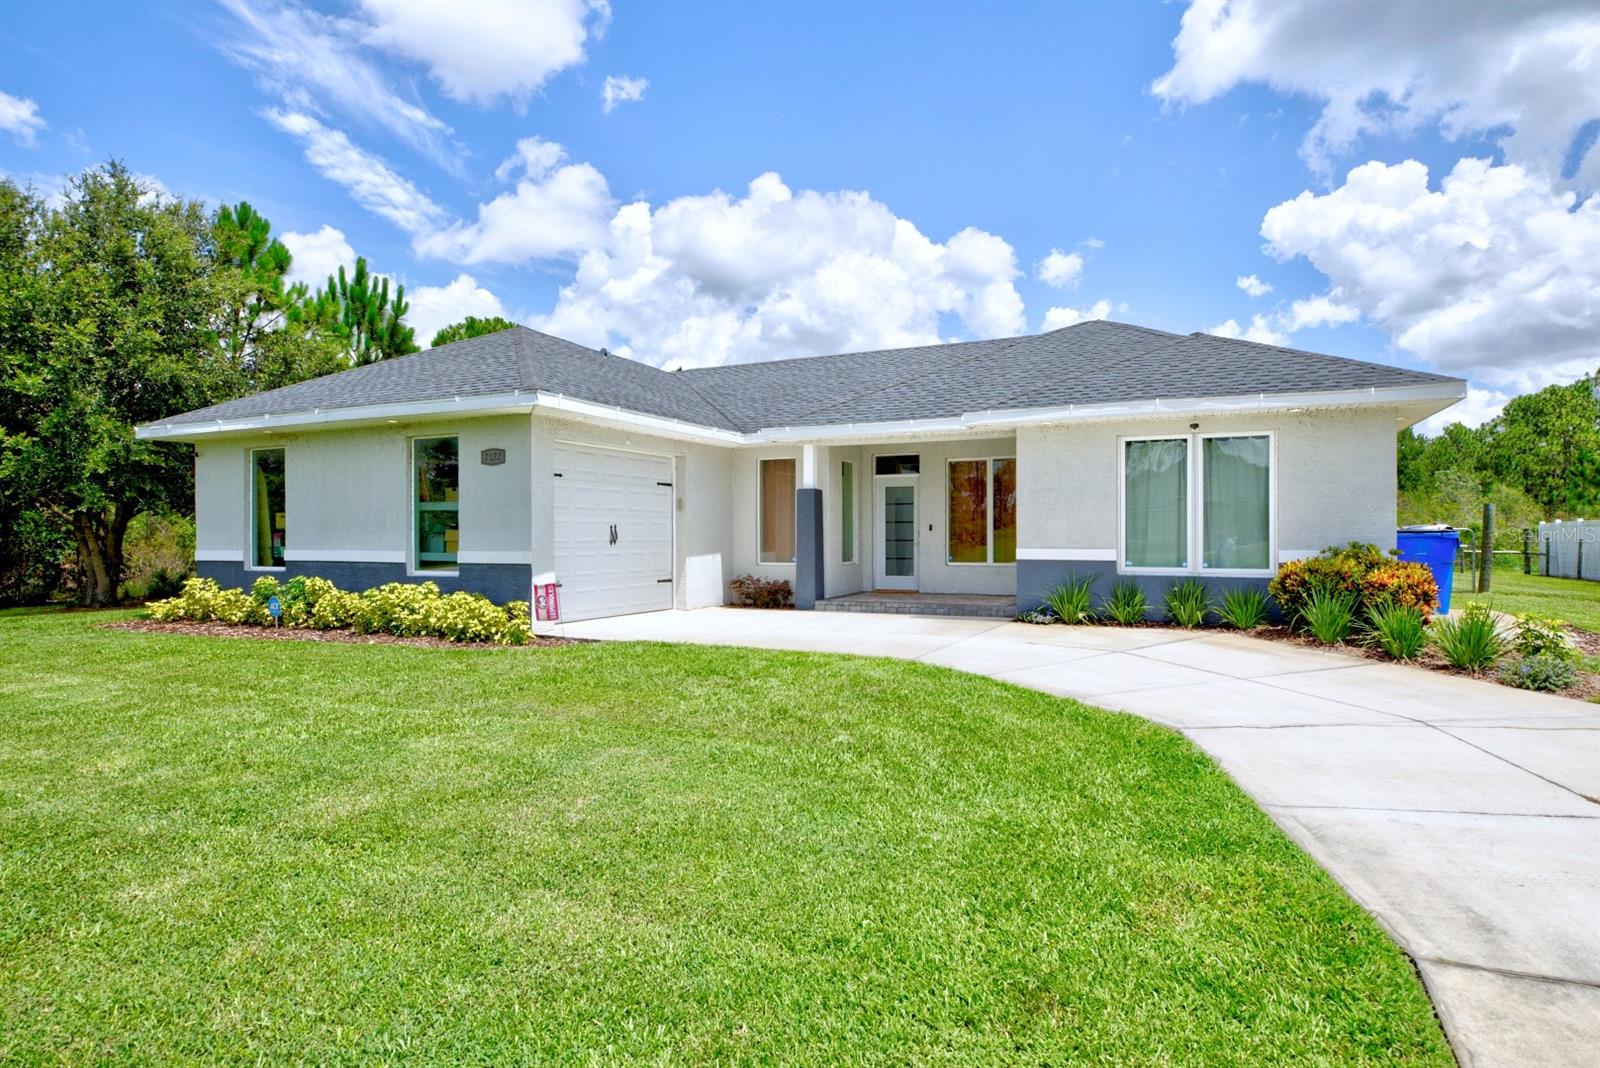
Active
$289,000
3
bds
|
2
ba
|
1,315
sqft
|
built
2020
7122 Granada Blvd, Sebring, FL 33872
$-390
Cash flow
-7.0%
Cash-on-Cash Return
4.5%
Cap rate
0.6%
Rent to Value Ratio
Active
$299,900
3
bds
|
2
ba
|
1,908
sqft
|
built
1994
2706 Monza Dr, Sebring, FL 33872
$-423
Cash flow
-7.4%
Cash-on-Cash Return
4.5%
Cap rate
0.7%
Rent to Value Ratio
Active
$289,900
2
bds
|
2
ba
|
1,372
sqft
|
built
1992
6032 Candler Ter, Sebring, FL 33876
$-496
Cash flow
-8.9%
Cash-on-Cash Return
4.1%
Cap rate
0.6%
Rent to Value Ratio
Active
$289,900
2
bds
|
0
ba
|
1,570
sqft
|
built
1995
609 Limetree Dr, Sebring, FL 33876
$-541
Cash flow
-9.7%
Cash-on-Cash Return
3.9%
Cap rate
0.6%
Rent to Value Ratio
Active
$369,000
3
bds
|
4
ba
|
2,213
sqft
|
built
1962
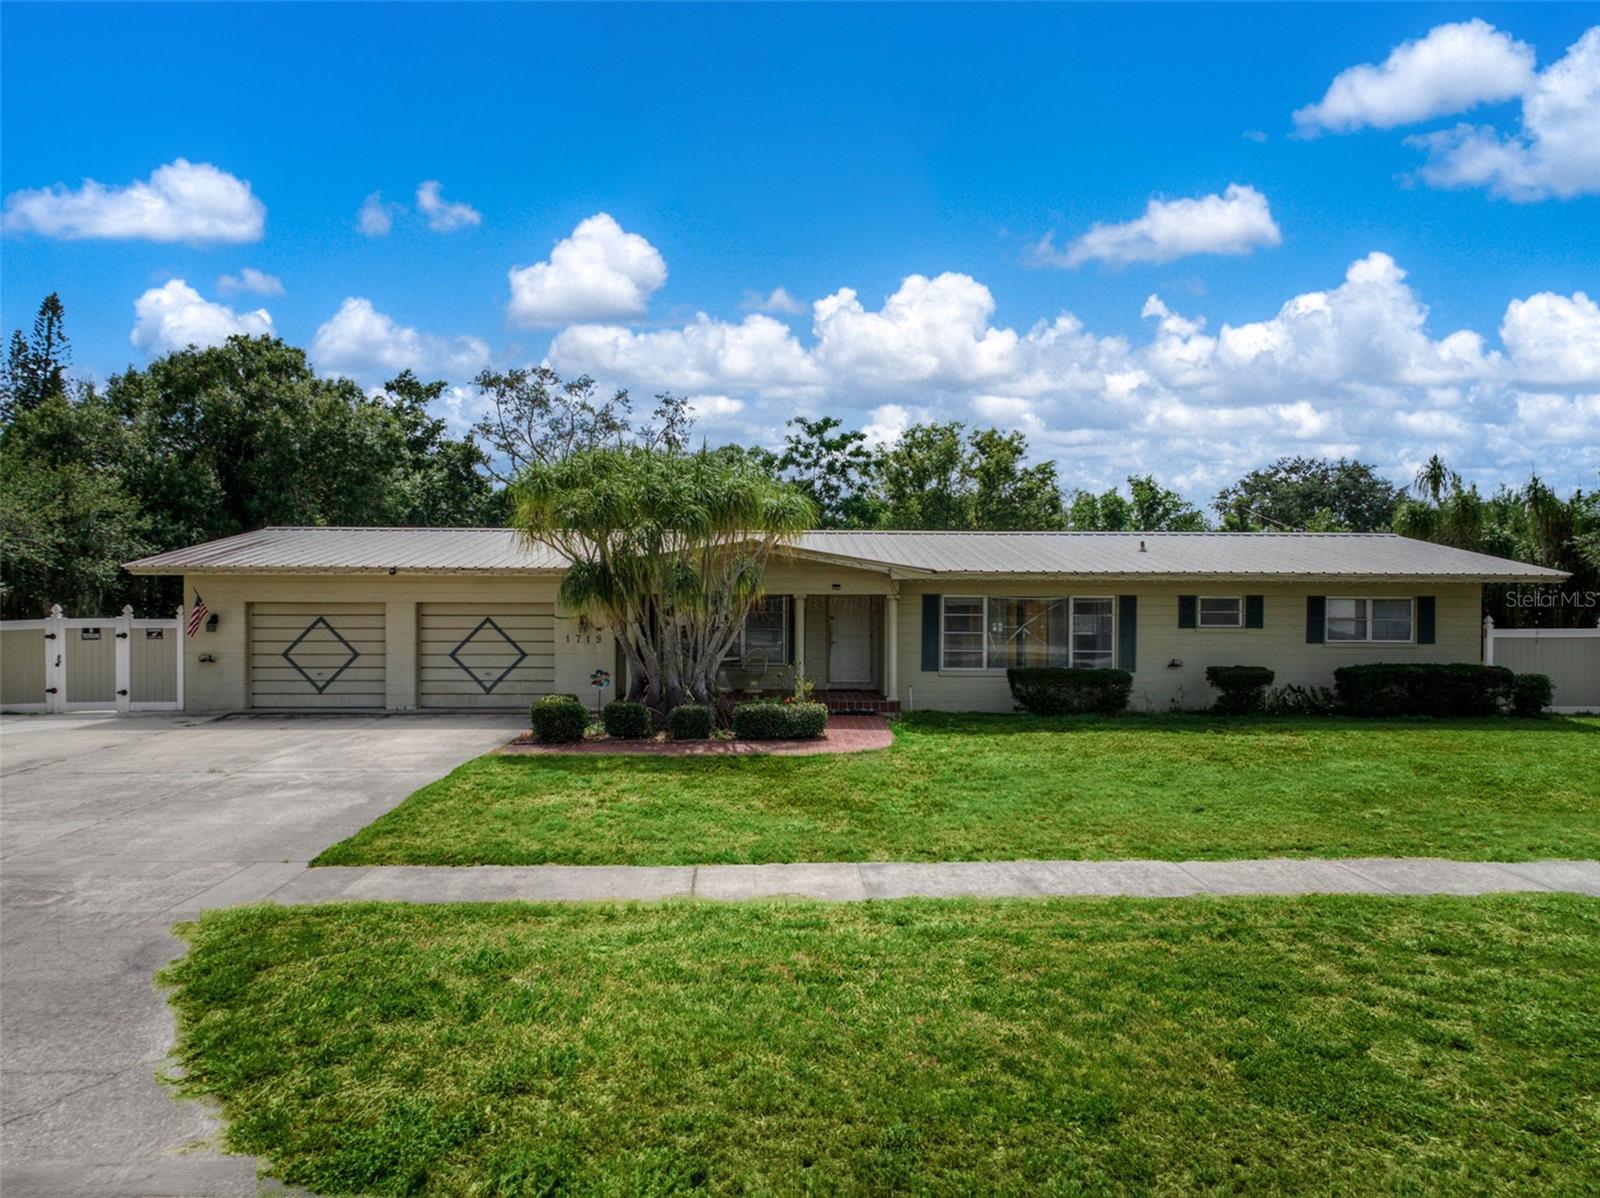
1719 Evangeline Ave, Sebring, FL 33870
$-667
Cash flow
-9.4%
Cash-on-Cash Return
4.0%
Cap rate
0.6%
Rent to Value Ratio
Active
$399,000
5
bds
|
3
ba
|
2,600
sqft
|
built
1973
2530 Van Pelt Rd, Sebring, FL 33870
$-792
Cash flow
-10.4%
Cash-on-Cash Return
3.8%
Cap rate
0.6%
Rent to Value Ratio
Active
$165,000
2
bds
|
1
ba
|
1,182
sqft
|
built
1980
1112 Evanston St, Sebring, FL 33870
$-27
Cash flow
-0.9%
Cash-on-Cash Return
5.9%
Cap rate
0.8%
Rent to Value Ratio
Active
$315,000
3
bds
|
2
ba
|
1,962
sqft
|
built
1976
1624 Lagrange Ave, Sebring, FL 33870
$-656
Cash flow
-10.9%
Cash-on-Cash Return
3.6%
Cap rate
0.6%
Rent to Value Ratio
Active
$650,000
3
bds
|
3
ba
|
4,013
sqft
|
built
2017
540 Phillips Rd, Sebring, FL 33875
$-1,791
Cash flow
-14.4%
Cash-on-Cash Return
2.8%
Cap rate
0.4%
Rent to Value Ratio
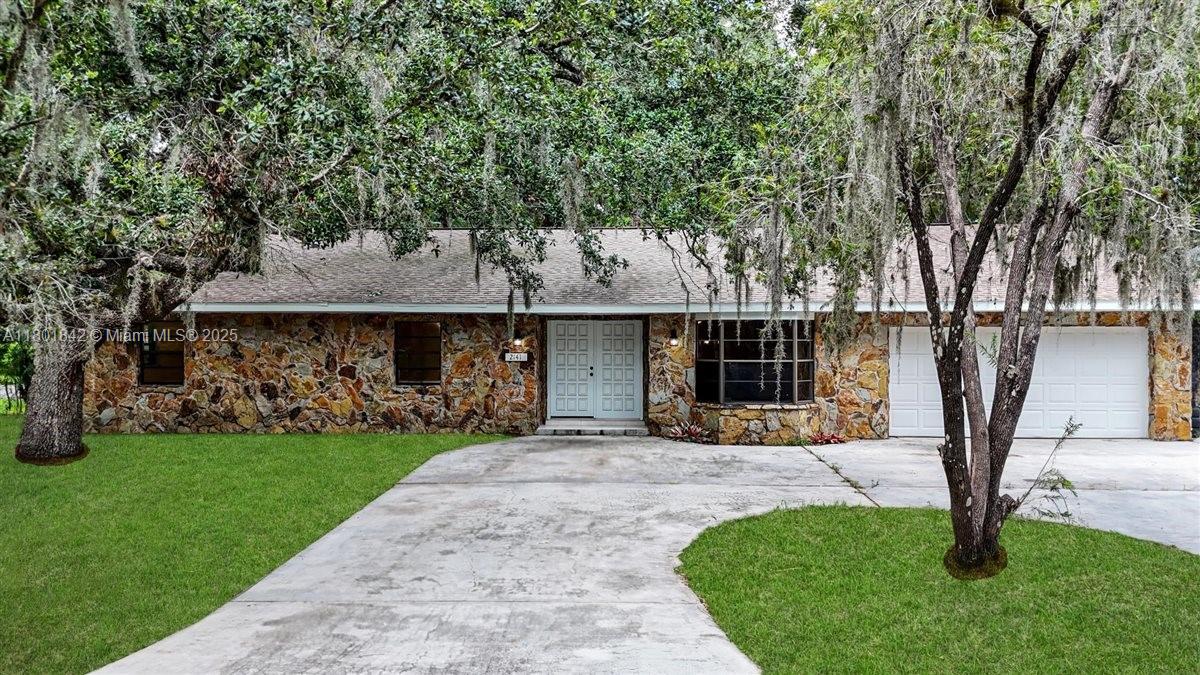
Active
$450,000
4
bds
|
3
ba
|
2,030
sqft
|
built
1985
2141 Oak Beach Blvd, Sebring, FL 33875
$-875
Cash flow
-10.1%
Cash-on-Cash Return
3.8%
Cap rate
0.6%
Rent to Value Ratio
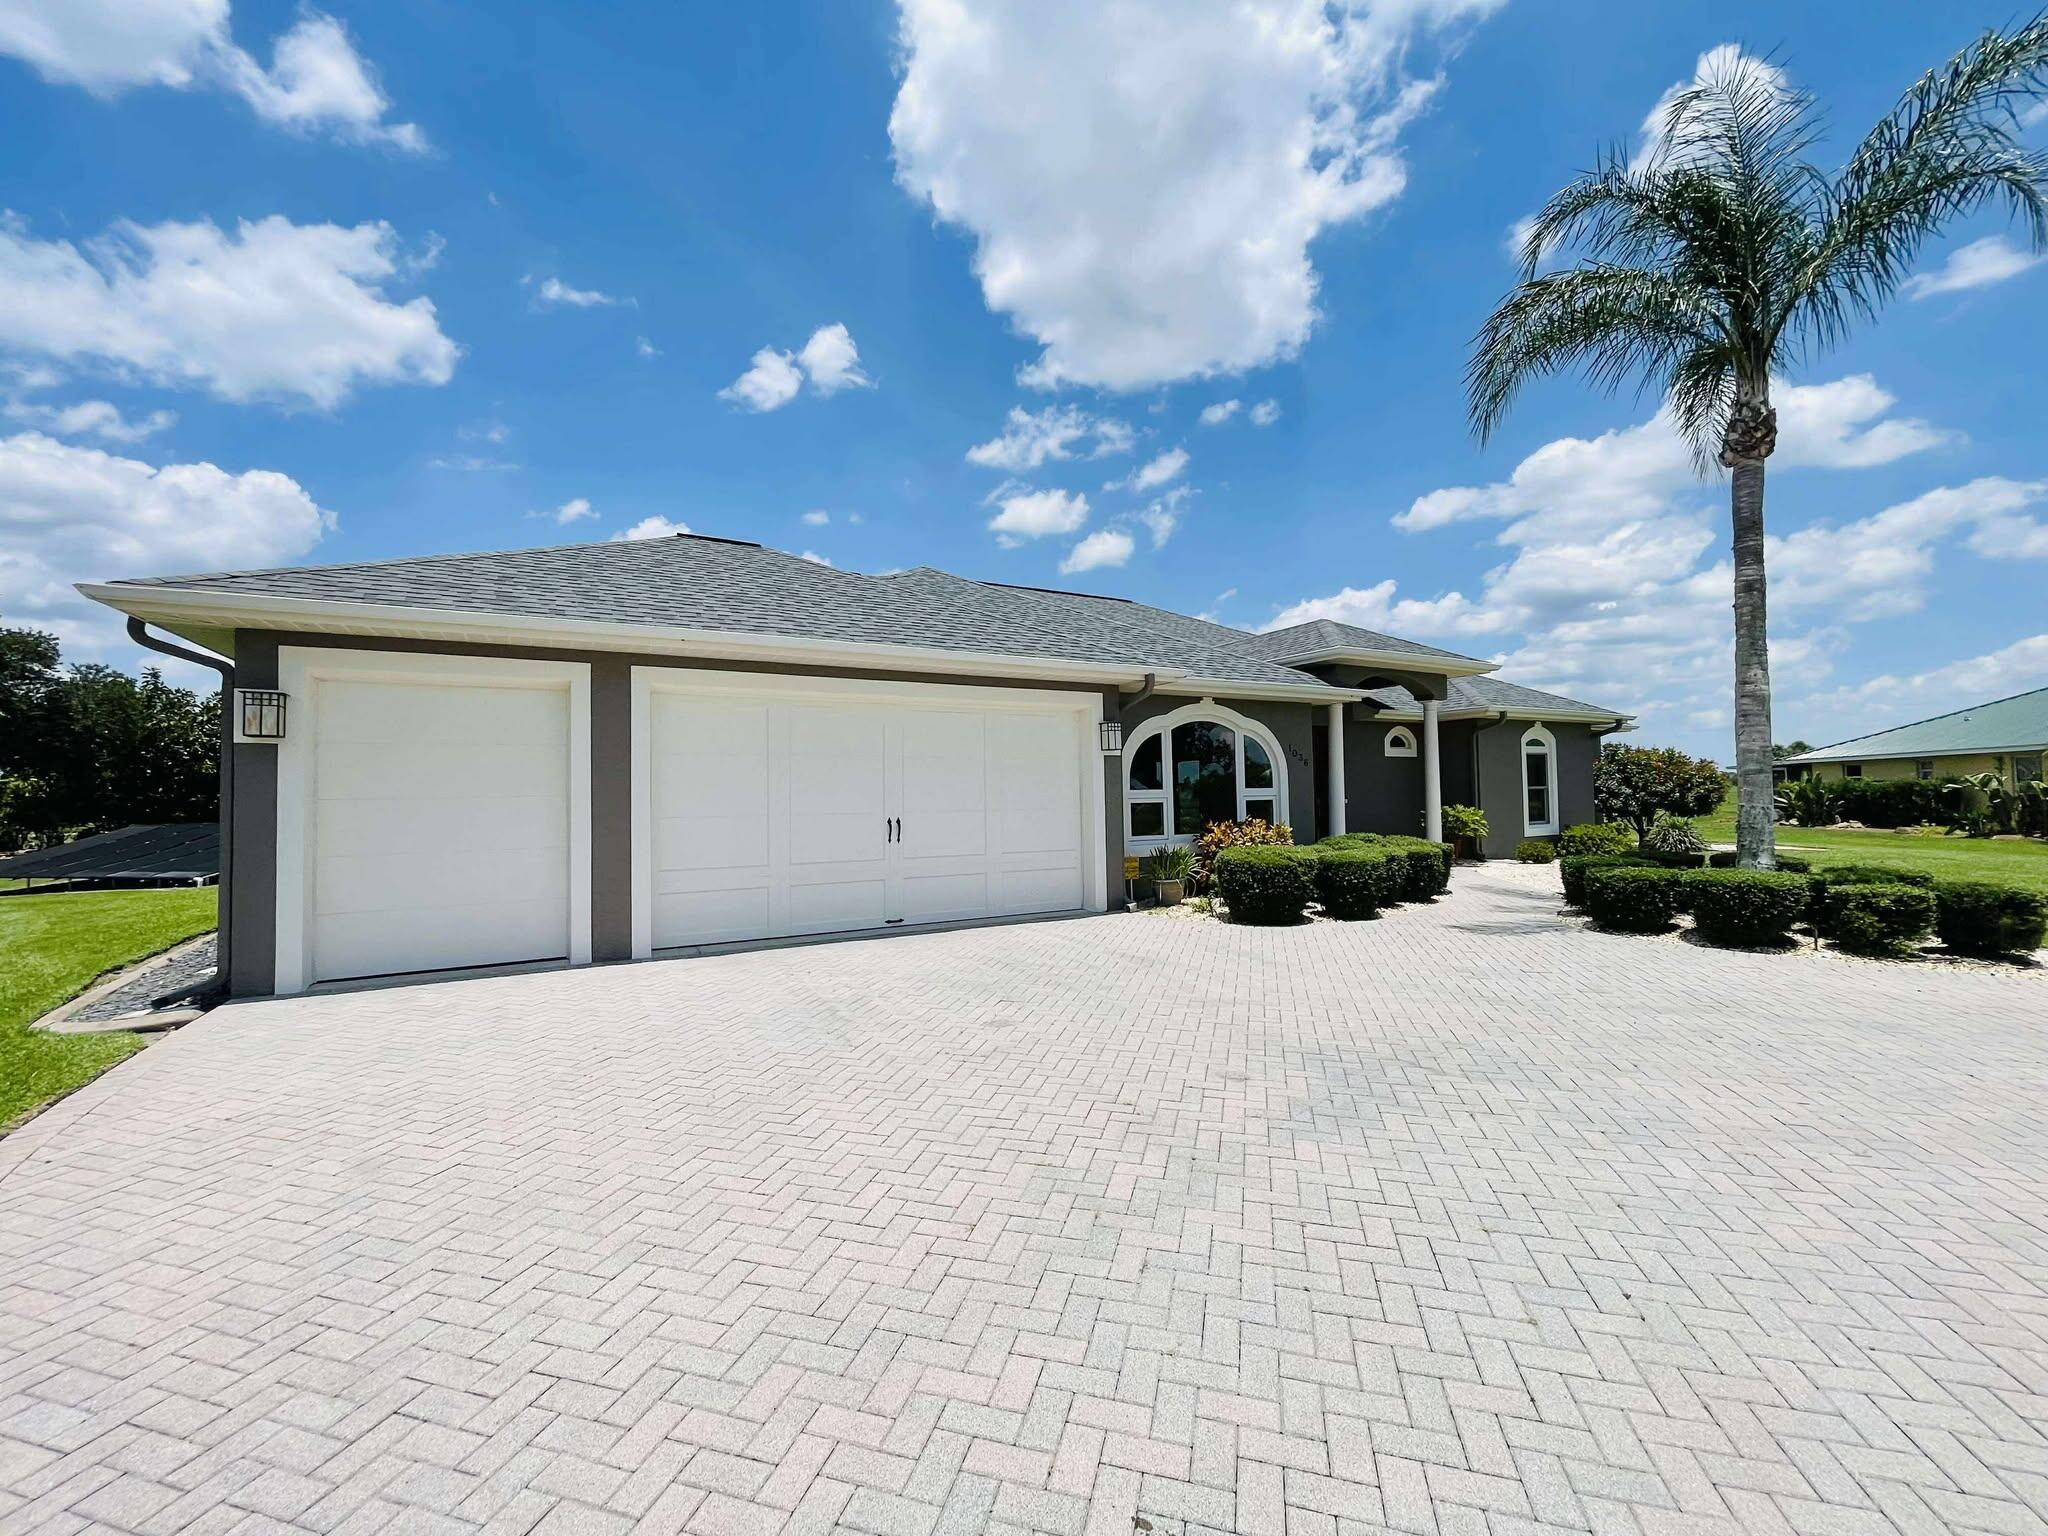
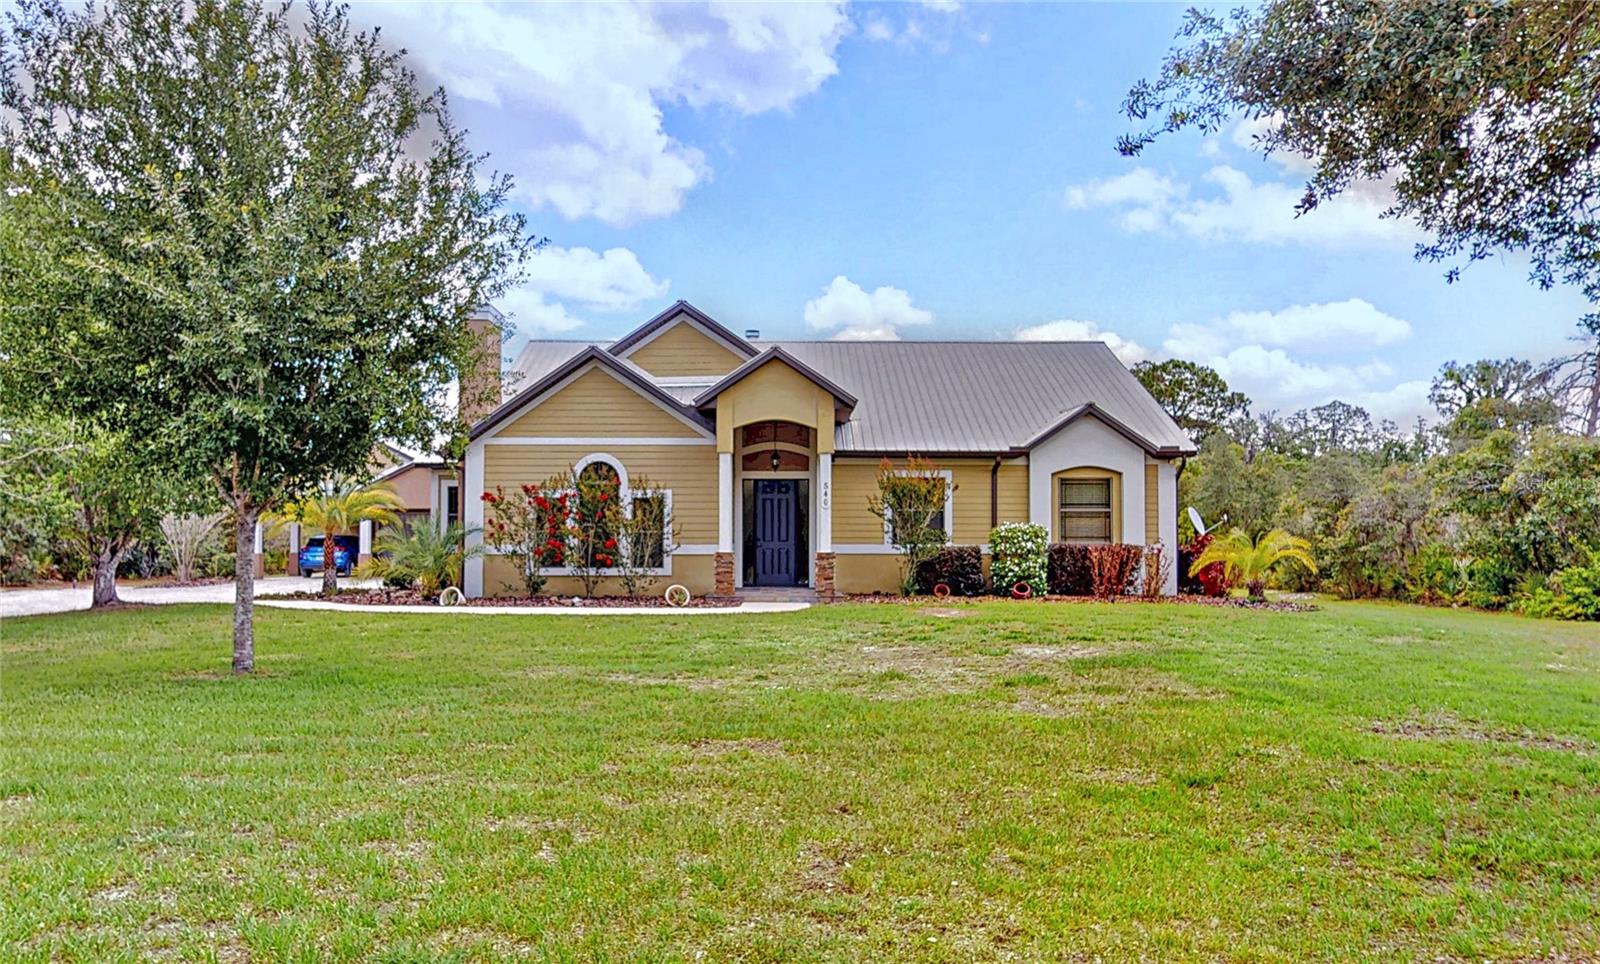
Active
$494,999
3
bds
|
3
ba
|
2,176
sqft
|
built
2004
1036 Greenway Ter, Sebring, FL 33876
$-1,097
Cash flow
-11.6%
Cash-on-Cash Return
3.5%
Cap rate
0.5%
Rent to Value Ratio
Active
$440,000
4
bds
|
3
ba
|
2,238
sqft
|
built
1999
9534 Wispywoods Dr, Sebring, FL 33875
$-782
Cash flow
-9.3%
Cash-on-Cash Return
4.0%
Cap rate
0.6%
Rent to Value Ratio
Pending
$199,000
3
bds
|
1
ba
|
1,122
sqft
|
built
1960
116 Sparrow Ave, Sebring, FL 33870
$-228
Cash flow
-6.0%
Cash-on-Cash Return
4.8%
Cap rate
0.7%
Rent to Value Ratio
Active
$449,900
3
bds
|
3
ba
|
2,992
sqft
|
built
2006
5033 Sugar Bay St, Sebring, FL 33872
$-840
Cash flow
-9.7%
Cash-on-Cash Return
3.9%
Cap rate
0.6%
Rent to Value Ratio
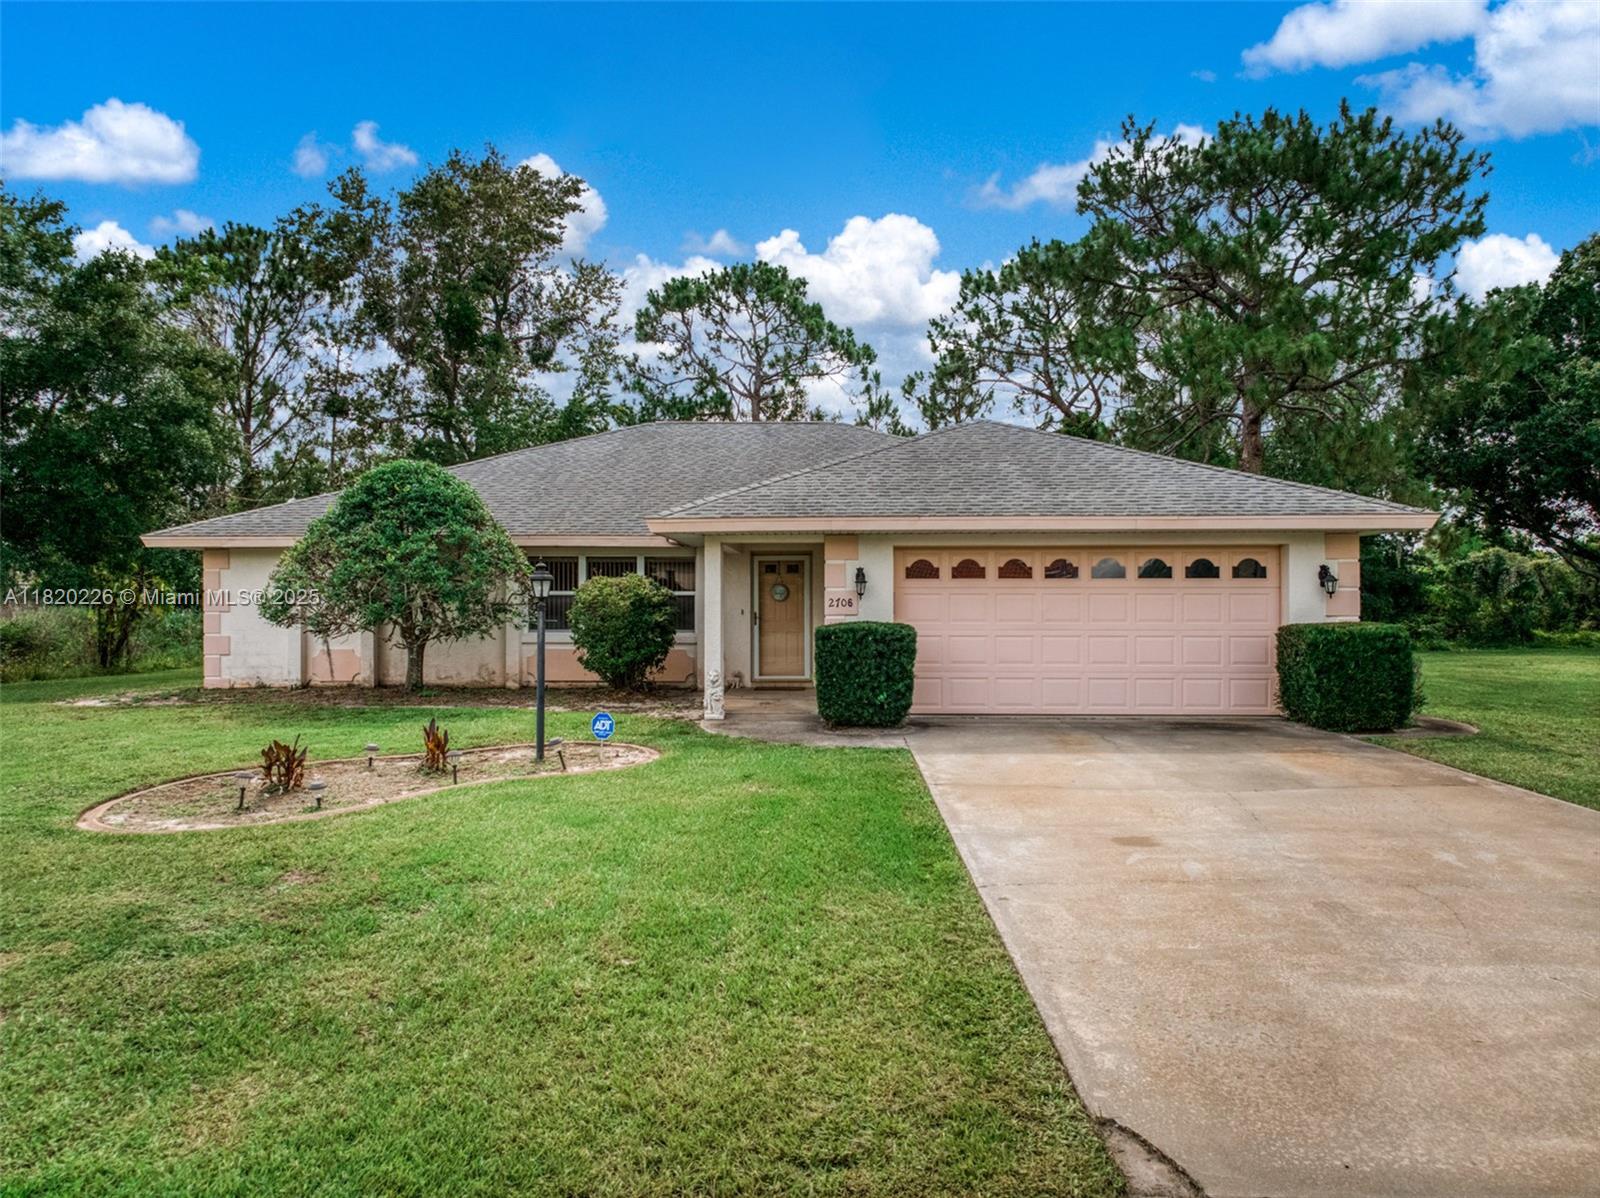
Pending
$219,000
3
bds
|
2
ba
|
1,424
sqft
|
built
1975
1221 Melody Ln, Sebring, FL 33872
$-185
Cash flow
-4.4%
Cash-on-Cash Return
5.1%
Cap rate
0.7%
Rent to Value Ratio
Active
$380,000
3
bds
|
2
ba
|
1,908
sqft
|
built
1998
2225 Jackson Dr, Sebring, FL 33870
$-884
Cash flow
-12.1%
Cash-on-Cash Return
3.4%
Cap rate
0.6%
Rent to Value Ratio
Active
$399,000
3
bds
|
2
ba
|
1,562
sqft
|
built
2010
2351 Lakeview Dr, Sebring, FL 33870
$-1,391
Cash flow
-18.2%
Cash-on-Cash Return
2.0%
Cap rate
0.6%
Rent to Value Ratio

Active
$249,000
2
bds
|
2
ba
|
1,825
sqft
|
built
1969
303 Thrush Ave, Sebring, FL 33870
$-80
Cash flow
-1.7%
Cash-on-Cash Return
5.8%
Cap rate
0.8%
Rent to Value Ratio
Active
$159,900
2
bds
|
2
ba
|
1,090
sqft
|
built
1990
102 Villaway, Sebring, FL 33876
$27
Cash flow
0.9%
Cash-on-Cash Return
6.3%
Cap rate
0.9%
Rent to Value Ratio
Active
$165,000
3
bds
|
1
ba
|
0
sqft
|
built
1958
1437 Hitakee Ave, Sebring, FL 33870
$25
Cash flow
0.8%
Cash-on-Cash Return
6.3%
Cap rate
0.9%
Rent to Value Ratio
Active
$729,000
30
bds
|
30
ba
|
791
sqft
|
built
1986
4409 Grass Ave, Sebring, FL 33875
$-3,079
Cash flow
-22.0%
Cash-on-Cash Return
1.1%
Cap rate
0.2%
Rent to Value Ratio
Active
$1,599,000
4
bds
|
3
ba
|
0
sqft
|
built
1975
2650 Scrubpens Rd, Sebring, FL 33870
$-5,832
Cash flow
-19.0%
Cash-on-Cash Return
1.8%
Cap rate
0.3%
Rent to Value Ratio
Active
$480,000
4
bds
|
4
ba
|
2,856
sqft
|
built
1993
2227 Sunrise Dr, Sebring, FL 33872
$-1,127
Cash flow
-12.3%
Cash-on-Cash Return
3.3%
Cap rate
0.5%
Rent to Value Ratio

Active
$389,000
3
bds
|
2
ba
|
2,074
sqft
|
built
1996
100 Oak Knolls Cir, Sebring, FL 33876
$-924
Cash flow
-12.4%
Cash-on-Cash Return
3.3%
Cap rate
0.5%
Rent to Value Ratio
Active
$95,000
2
bds
|
1
ba
|
0
sqft
|
built
1983
1515 Wilson Dr, Sebring, FL 33875
$182
Cash flow
10.0%
Cash-on-Cash Return
8.5%
Cap rate
1.2%
Rent to Value Ratio
Active
$504,900
3
bds
|
3
ba
|
2,113
sqft
|
built
2018
7055 Strafford Oaks Dr, Sebring, FL 33875
$-1,357
Cash flow
-14.0%
Cash-on-Cash Return
2.9%
Cap rate
0.5%
Rent to Value Ratio
Active
$294,999
3
bds
|
2
ba
|
1,359
sqft
|
built
2022
827 Renault Ave, Sebring, FL 33872
$-492
Cash flow
-8.7%
Cash-on-Cash Return
4.1%
Cap rate
0.6%
Rent to Value Ratio
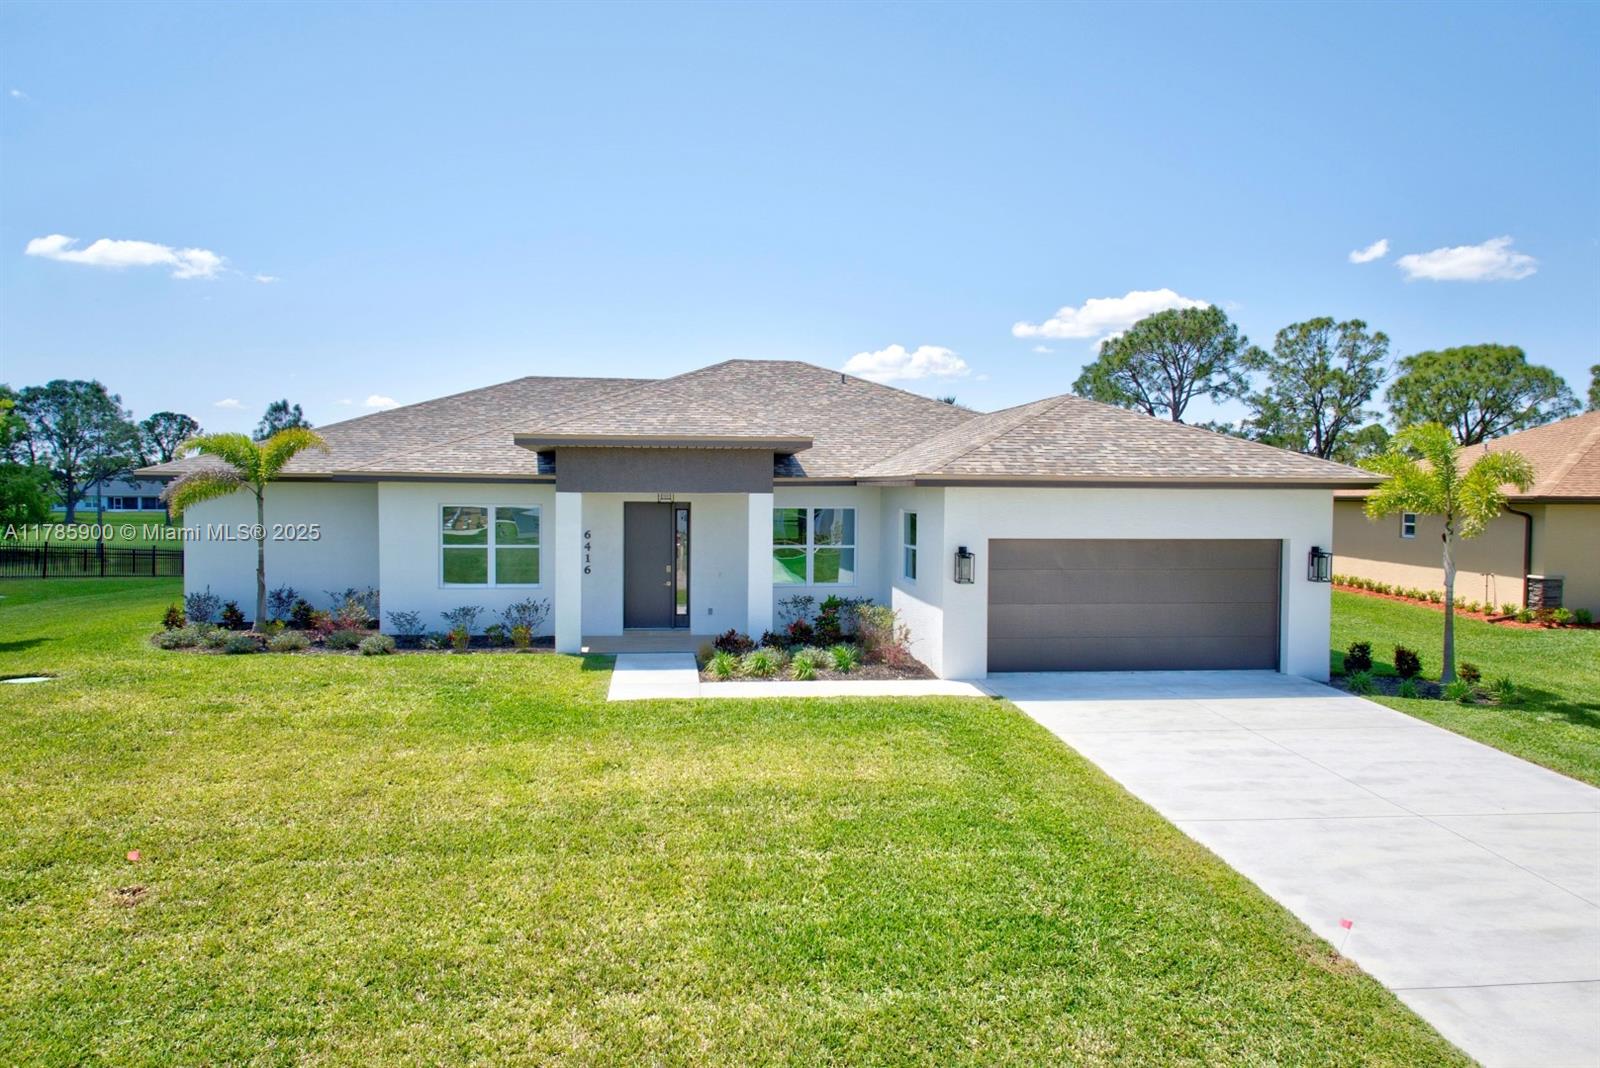
Active
$438,500
3
bds
|
3
ba
|
2,221
sqft
|
built
2024
6416 Concord Dr, Sebring, FL 33876
$-754
Cash flow
-9.0%
Cash-on-Cash Return
4.1%
Cap rate
0.6%
Rent to Value Ratio
Active
$520,000
6
bds
|
5
ba
|
2,700
sqft
|
built
1983
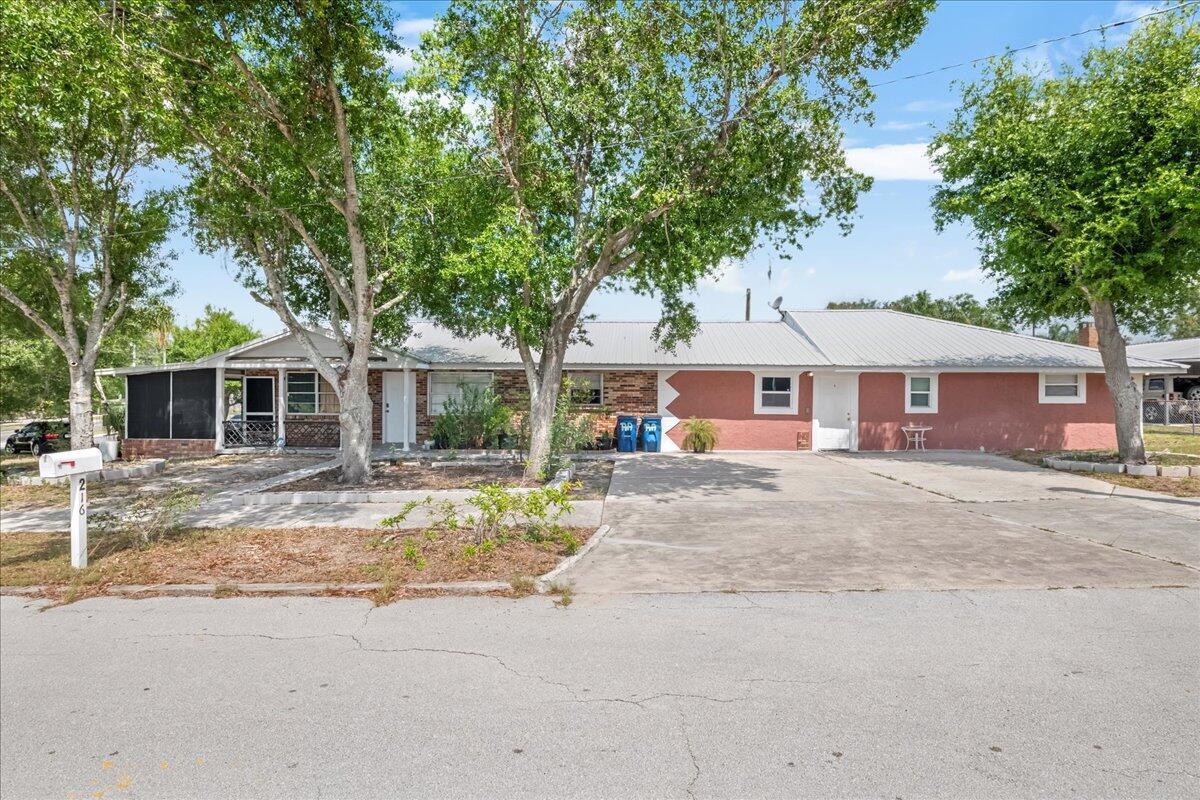
216 Micco Ave, Sebring, FL 33870
$-1,700
Cash flow
-17.1%
Cash-on-Cash Return
2.2%
Cap rate
0.3%
Rent to Value Ratio
Active
$335,000
3
bds
|
3
ba
|
1,720
sqft
|
built
2000
6917 Spumoni St, Sebring, FL 33872
$-691
Cash flow
-10.8%
Cash-on-Cash Return
3.7%
Cap rate
0.5%
Rent to Value Ratio
Active
$569,900
3
bds
|
3
ba
|
3,440
sqft
|
built
2000
5318 Oak Rd, Sebring, FL 33875
$-1,705
Cash flow
-15.6%
Cash-on-Cash Return
2.6%
Cap rate
0.4%
Rent to Value Ratio
Active
$309,990
3
bds
|
2
ba
|
1,408
sqft
|
built
2022
731 Triumph Dr, Sebring, FL 33872
$-180
Cash flow
-3.0%
Cash-on-Cash Return
5.5%
Cap rate
0.7%
Rent to Value Ratio
Active
$234,900
3
bds
|
2
ba
|
1,342
sqft
|
built
1974
1327 Deer Park Ct, Sebring, FL 33872
$-190
Cash flow
-4.2%
Cash-on-Cash Return
5.2%
Cap rate
0.7%
Rent to Value Ratio
Pending
$247,500
2
bds
|
2
ba
|
1,436
sqft
|
built
1988
107 Robin Ave, Sebring, FL 33870
$-126
Cash flow
-2.7%
Cash-on-Cash Return
5.5%
Cap rate
0.7%
Rent to Value Ratio
Pending
$299,900
3
bds
|
3
ba
|
2,331
sqft
|
built
1993
4408 Duffer Loop, Sebring, FL 33872
$-581
Cash flow
-10.1%
Cash-on-Cash Return
3.8%
Cap rate
0.6%
Rent to Value Ratio
Active
$245,900
2
bds
|
2
ba
|
1,654
sqft
|
built
1995
1854 Evergreen St, Sebring, FL 33870
$-255
Cash flow
-5.4%
Cash-on-Cash Return
4.9%
Cap rate
0.7%
Rent to Value Ratio
Active
$344,999
2
bds
|
2
ba
|
2,297
sqft
|
built
2000
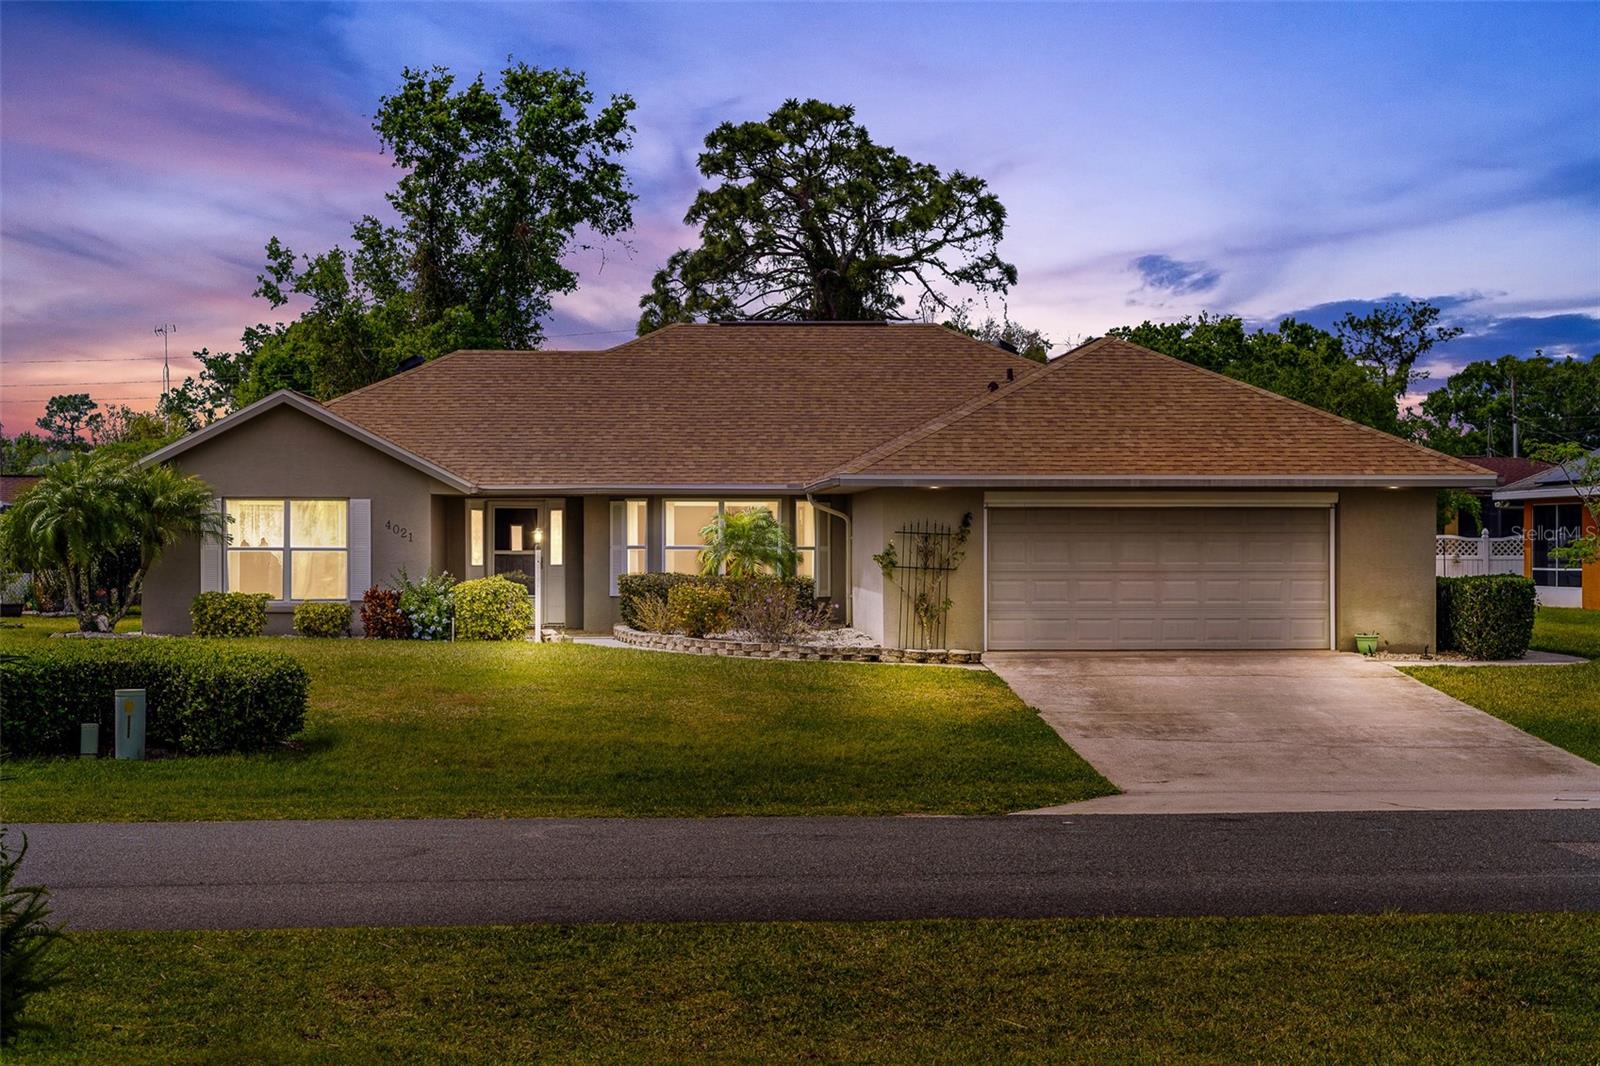
4021 Santa Barbara Dr, Sebring, FL 33875
$-525
Cash flow
-7.9%
Cash-on-Cash Return
4.3%
Cap rate
0.6%
Rent to Value Ratio
Active
$159,900
2
bds
|
2
ba
|
980
sqft
|
built
1981
4529 Mercado Dr, Sebring, FL 33872
$-565
Cash flow
-18.4%
Cash-on-Cash Return
1.9%
Cap rate
0.8%
Rent to Value Ratio
Active
$549,900
3
bds
|
2
ba
|
1,798
sqft
|
built
2023
717 Cypress Ct, Sebring, FL 33876
$-1,557
Cash flow
-14.8%
Cash-on-Cash Return
2.7%
Cap rate
0.5%
Rent to Value Ratio
Active
$249,000
3
bds
|
2
ba
|
1,548
sqft
|
built
1976
7808 Granada Rd, Sebring, FL 33876
$-295
Cash flow
-6.2%
Cash-on-Cash Return
4.7%
Cap rate
0.7%
Rent to Value Ratio