Sneads Ferry, NC Investment Properties for Sale
Browse homes for sale and investment properties in Sneads Ferry, NC. Refine your search by price, property type, or more.
Best cash flowing properties in Sneads Ferry, NC
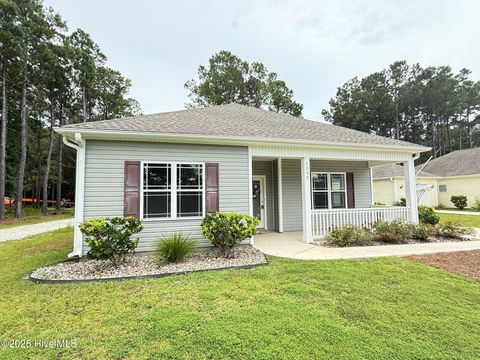
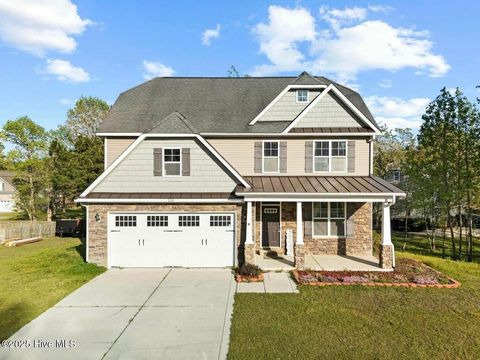
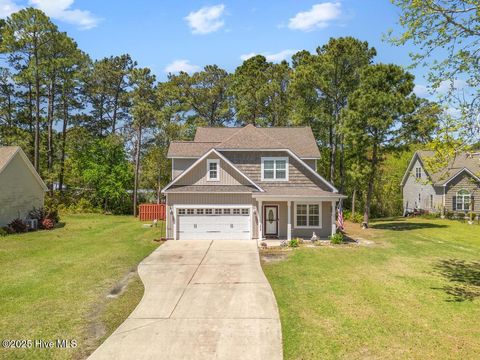
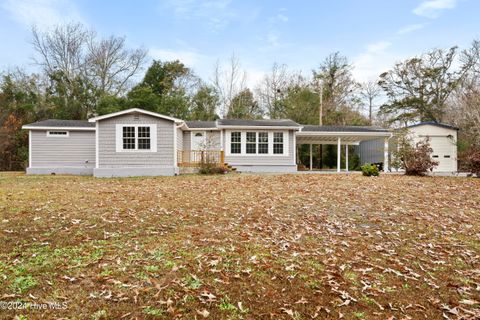
Active
$499,900
3
bds
|
2
ba
|
1,500
sqft
|
built
2015
136 Cedar Hollow Ln, Sneads Ferry, NC 28460
$0
Cash flow
n/a
Cash-on-Cash Return
n/a
Cap rate
n/a
Rent to Value Ratio
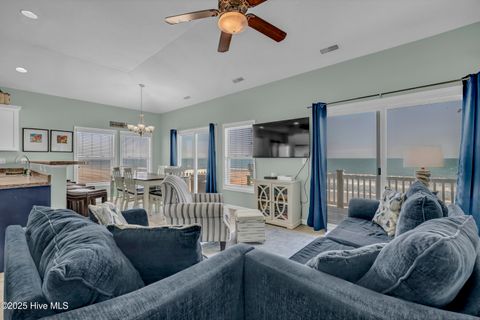
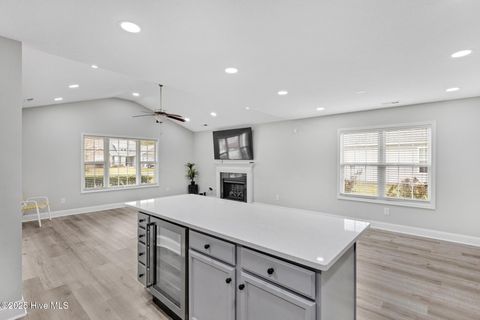
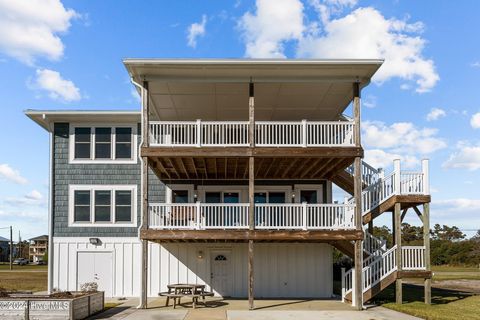
Active
$469,990
4
bds
|
4
ba
|
3,329
sqft
|
built
2013
342 W Goldeneye Ln, Sneads Ferry, NC 28460
$-113
Cash flow
-1.3%
Cash-on-Cash Return
5.4%
Cap rate
0.7%
Rent to Value Ratio
22 out of 80 properties for sale in Sneads Ferry, NC
Limited Results Shown
Create a free account, or log in to reveal all property listings and enjoy the complete experience.
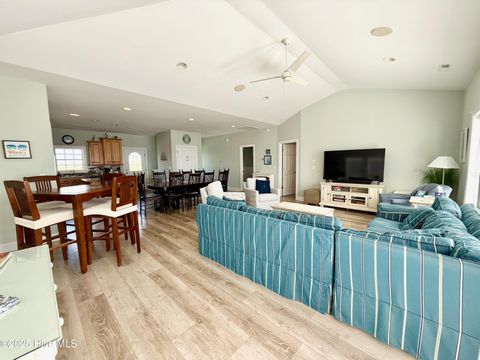
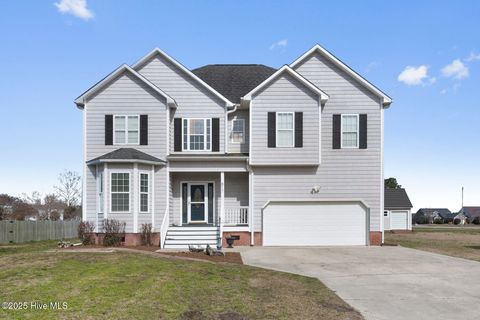
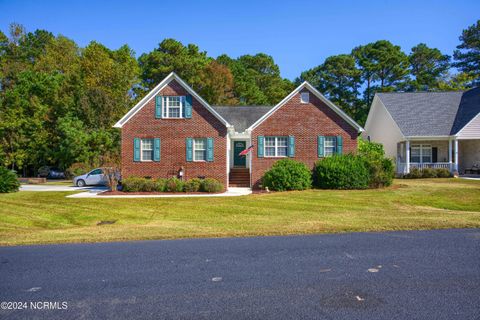
Active
$695,000
3
bds
|
4
ba
|
2,398
sqft
|
built
2006
232 Grandview Dr, Sneads Ferry, NC 28460
$-1,413
Cash flow
-10.6%
Cash-on-Cash Return
3.2%
Cap rate
0.4%
Rent to Value Ratio
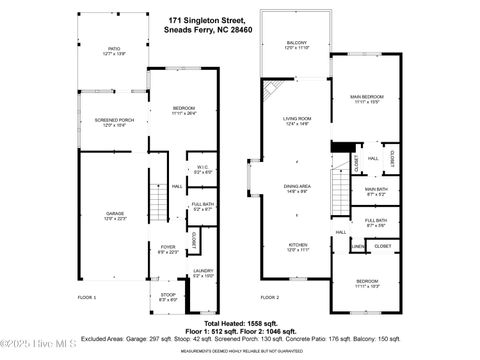
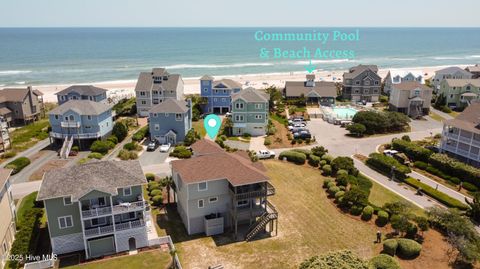
Active
$355,000
3
bds
|
3
ba
|
1,558
sqft
|
built
1985
171 Singleton St, Sneads Ferry, NC 28460
$-447
Cash flow
-6.6%
Cash-on-Cash Return
4.2%
Cap rate
0.6%
Rent to Value Ratio
Active
$315,000
3
bds
|
2
ba
|
1,742
sqft
|
built
2019
1306 Old Folkstone Rd, Sneads Ferry, NC 28460
$-151
Cash flow
-2.5%
Cash-on-Cash Return
5.1%
Cap rate
0.7%
Rent to Value Ratio
Active
$1,400,000
4
bds
|
4
ba
|
2,248
sqft
|
built
2017
132 N Permuda Wynd Dr, Sneads Ferry, NC 28460
$-5,500
Cash flow
-20.5%
Cash-on-Cash Return
1.0%
Cap rate
0.2%
Rent to Value Ratio
Active
$995,000
3
bds
|
3
ba
|
2,515
sqft
|
built
2022
361 Chadwick Shores Dr, Sneads Ferry, NC 28460
$-2,277
Cash flow
-11.9%
Cash-on-Cash Return
2.9%
Cap rate
0.4%
Rent to Value Ratio

Active
$980,000
3
bds
|
2
ba
|
2,200
sqft
|
built
1995
132 Gemstone Dr, Sneads Ferry, NC 28460
$-2,667
Cash flow
-14.2%
Cash-on-Cash Return
2.4%
Cap rate
0.3%
Rent to Value Ratio
Active
$380,000
3
bds
|
2
ba
|
1,925
sqft
|
built
2011
116 Shell Ct, Sneads Ferry, NC 28460
$-184
Cash flow
-2.5%
Cash-on-Cash Return
5.1%
Cap rate
0.6%
Rent to Value Ratio
Active
$395,000
3
bds
|
3
ba
|
2,518
sqft
|
built
2010
136 Old Millstone Lndg, Sneads Ferry, NC 28460
$-164
Cash flow
-2.2%
Cash-on-Cash Return
5.2%
Cap rate
0.6%
Rent to Value Ratio
Active
$1,165,000
5
bds
|
5
ba
|
2,025
sqft
|
built
2006
244 Sea Shore Dr, Sneads Ferry, NC 28460
$-3,965
Cash flow
-17.8%
Cash-on-Cash Return
1.6%
Cap rate
0.2%
Rent to Value Ratio
Active
$1,199,000
5
bds
|
6
ba
|
2,715
sqft
|
built
2004
4388 Island Dr, Sneads Ferry, NC 28460
$-3,121
Cash flow
-13.6%
Cash-on-Cash Return
2.6%
Cap rate
0.4%
Rent to Value Ratio
Active
$1,125,000
4
bds
|
3
ba
|
2,028
sqft
|
built
2000
103 N Permuda Wynd Dr, Sneads Ferry, NC 28460
$-4,184
Cash flow
-19.4%
Cash-on-Cash Return
1.2%
Cap rate
0.2%
Rent to Value Ratio

Active
$1,099,000
5
bds
|
4
ba
|
2,608
sqft
|
built
2006
233 Grandview Dr, Sneads Ferry, NC 28460
$-3,469
Cash flow
-16.5%
Cash-on-Cash Return
1.9%
Cap rate
0.3%
Rent to Value Ratio
Active
$399,000
3
bds
|
4
ba
|
2,340
sqft
|
built
2016
309 Chadwick Shores Dr, Sneads Ferry, NC 28460
$-395
Cash flow
-5.2%
Cash-on-Cash Return
4.5%
Cap rate
0.6%
Rent to Value Ratio
Active
$380,000
4
bds
|
2
ba
|
1,728
sqft
|
built
2012
213 Marsh Haven Dr, Sneads Ferry, NC 28460
$-470
Cash flow
-6.5%
Cash-on-Cash Return
4.2%
Cap rate
0.6%
Rent to Value Ratio

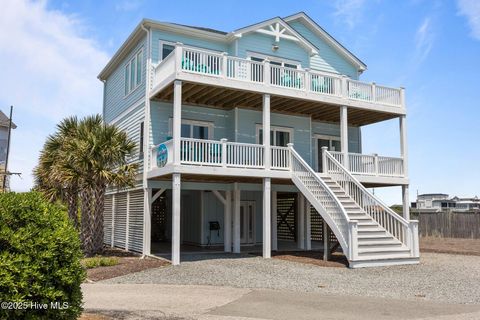
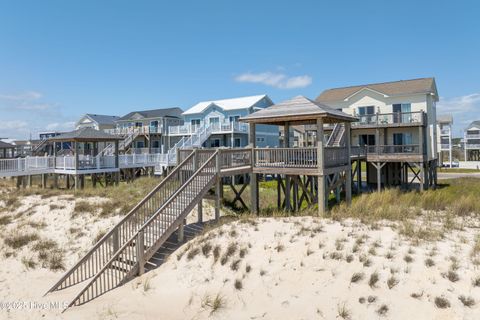
Active
$739,000
3
bds
|
3
ba
|
1,108
sqft
|
built
1997
3802 Island Dr, Sneads Ferry, NC 28460
$-2,117
Cash flow
-14.9%
Cash-on-Cash Return
2.2%
Cap rate
0.3%
Rent to Value Ratio
Active
$434,000
3
bds
|
3
ba
|
2,873
sqft
|
built
2008
817 Willbrook Cir, Sneads Ferry, NC 28460
$-534
Cash flow
-6.4%
Cash-on-Cash Return
4.2%
Cap rate
0.6%
Rent to Value Ratio
Active
$1,299,000
4
bds
|
3
ba
|
1,986
sqft
|
built
2013
1280 New River Inlet Rd, Sneads Ferry, NC 28460
$-3,456
Cash flow
-13.9%
Cash-on-Cash Return
2.5%
Cap rate
0.3%
Rent to Value Ratio
Active
$400,000
3
bds
|
2
ba
|
1,615
sqft
|
built
1960
159 Tillett Ln, Sneads Ferry, NC 28460
$-375
Cash flow
-4.9%
Cash-on-Cash Return
4.6%
Cap rate
0.5%
Rent to Value Ratio
Active
$1,150,000
4
bds
|
5
ba
|
2,870
sqft
|
built
1986
101 Grant St, Sneads Ferry, NC 28460
$-2,699
Cash flow
-12.2%
Cash-on-Cash Return
2.9%
Cap rate
0.4%
Rent to Value Ratio
Active
$399,000
4
bds
|
2
ba
|
2,317
sqft
|
built
2004
300 Sea Urchin Cv, Sneads Ferry, NC 28460
$-396
Cash flow
-5.2%
Cash-on-Cash Return
4.5%
Cap rate
0.6%
Rent to Value Ratio