South Jordan, UT Investment Properties for Sale
Browse homes for sale and investment properties in South Jordan, UT. Refine your search by price, property type, or more.
Best cash flowing properties in South Jordan, UT
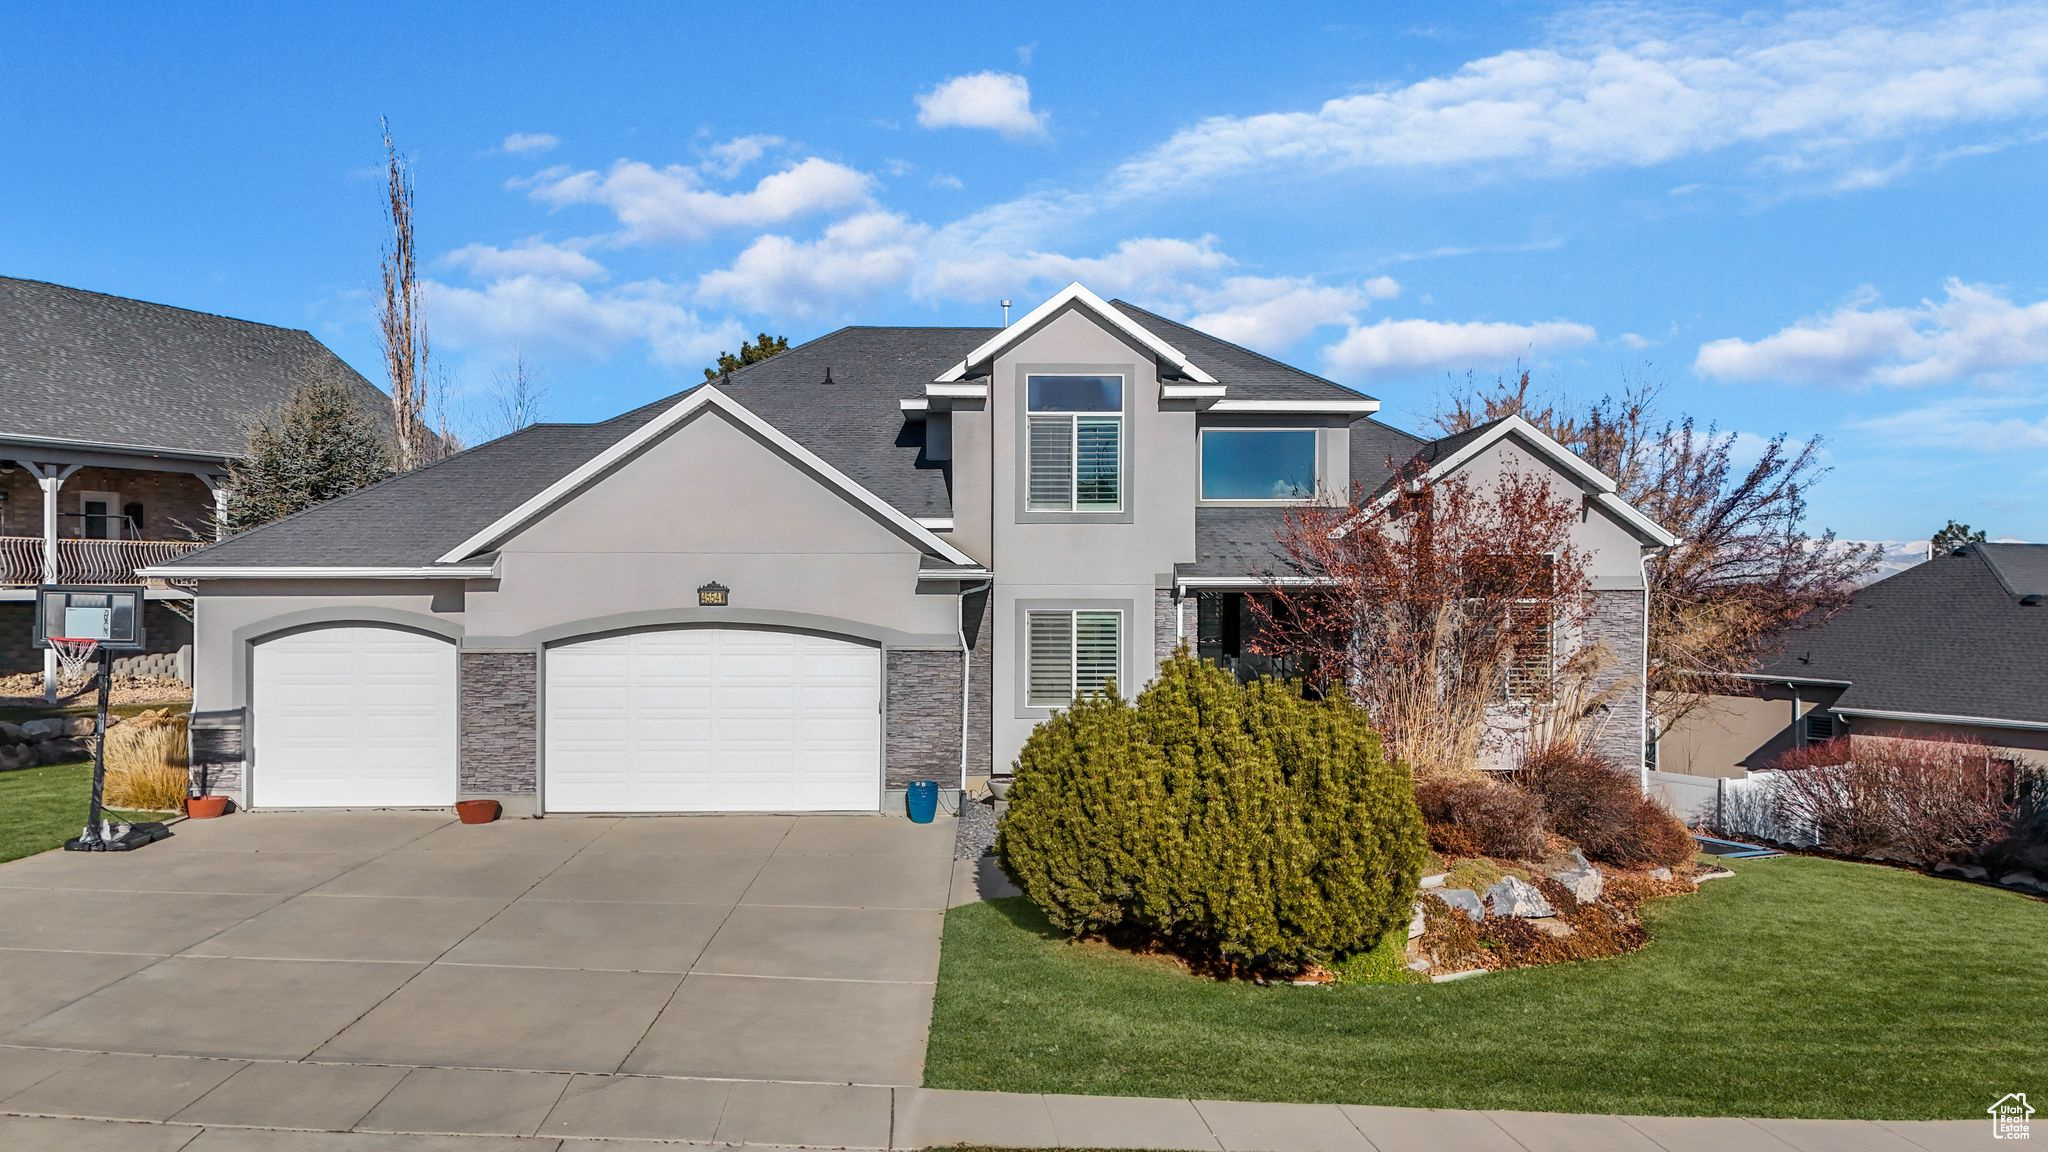
Active
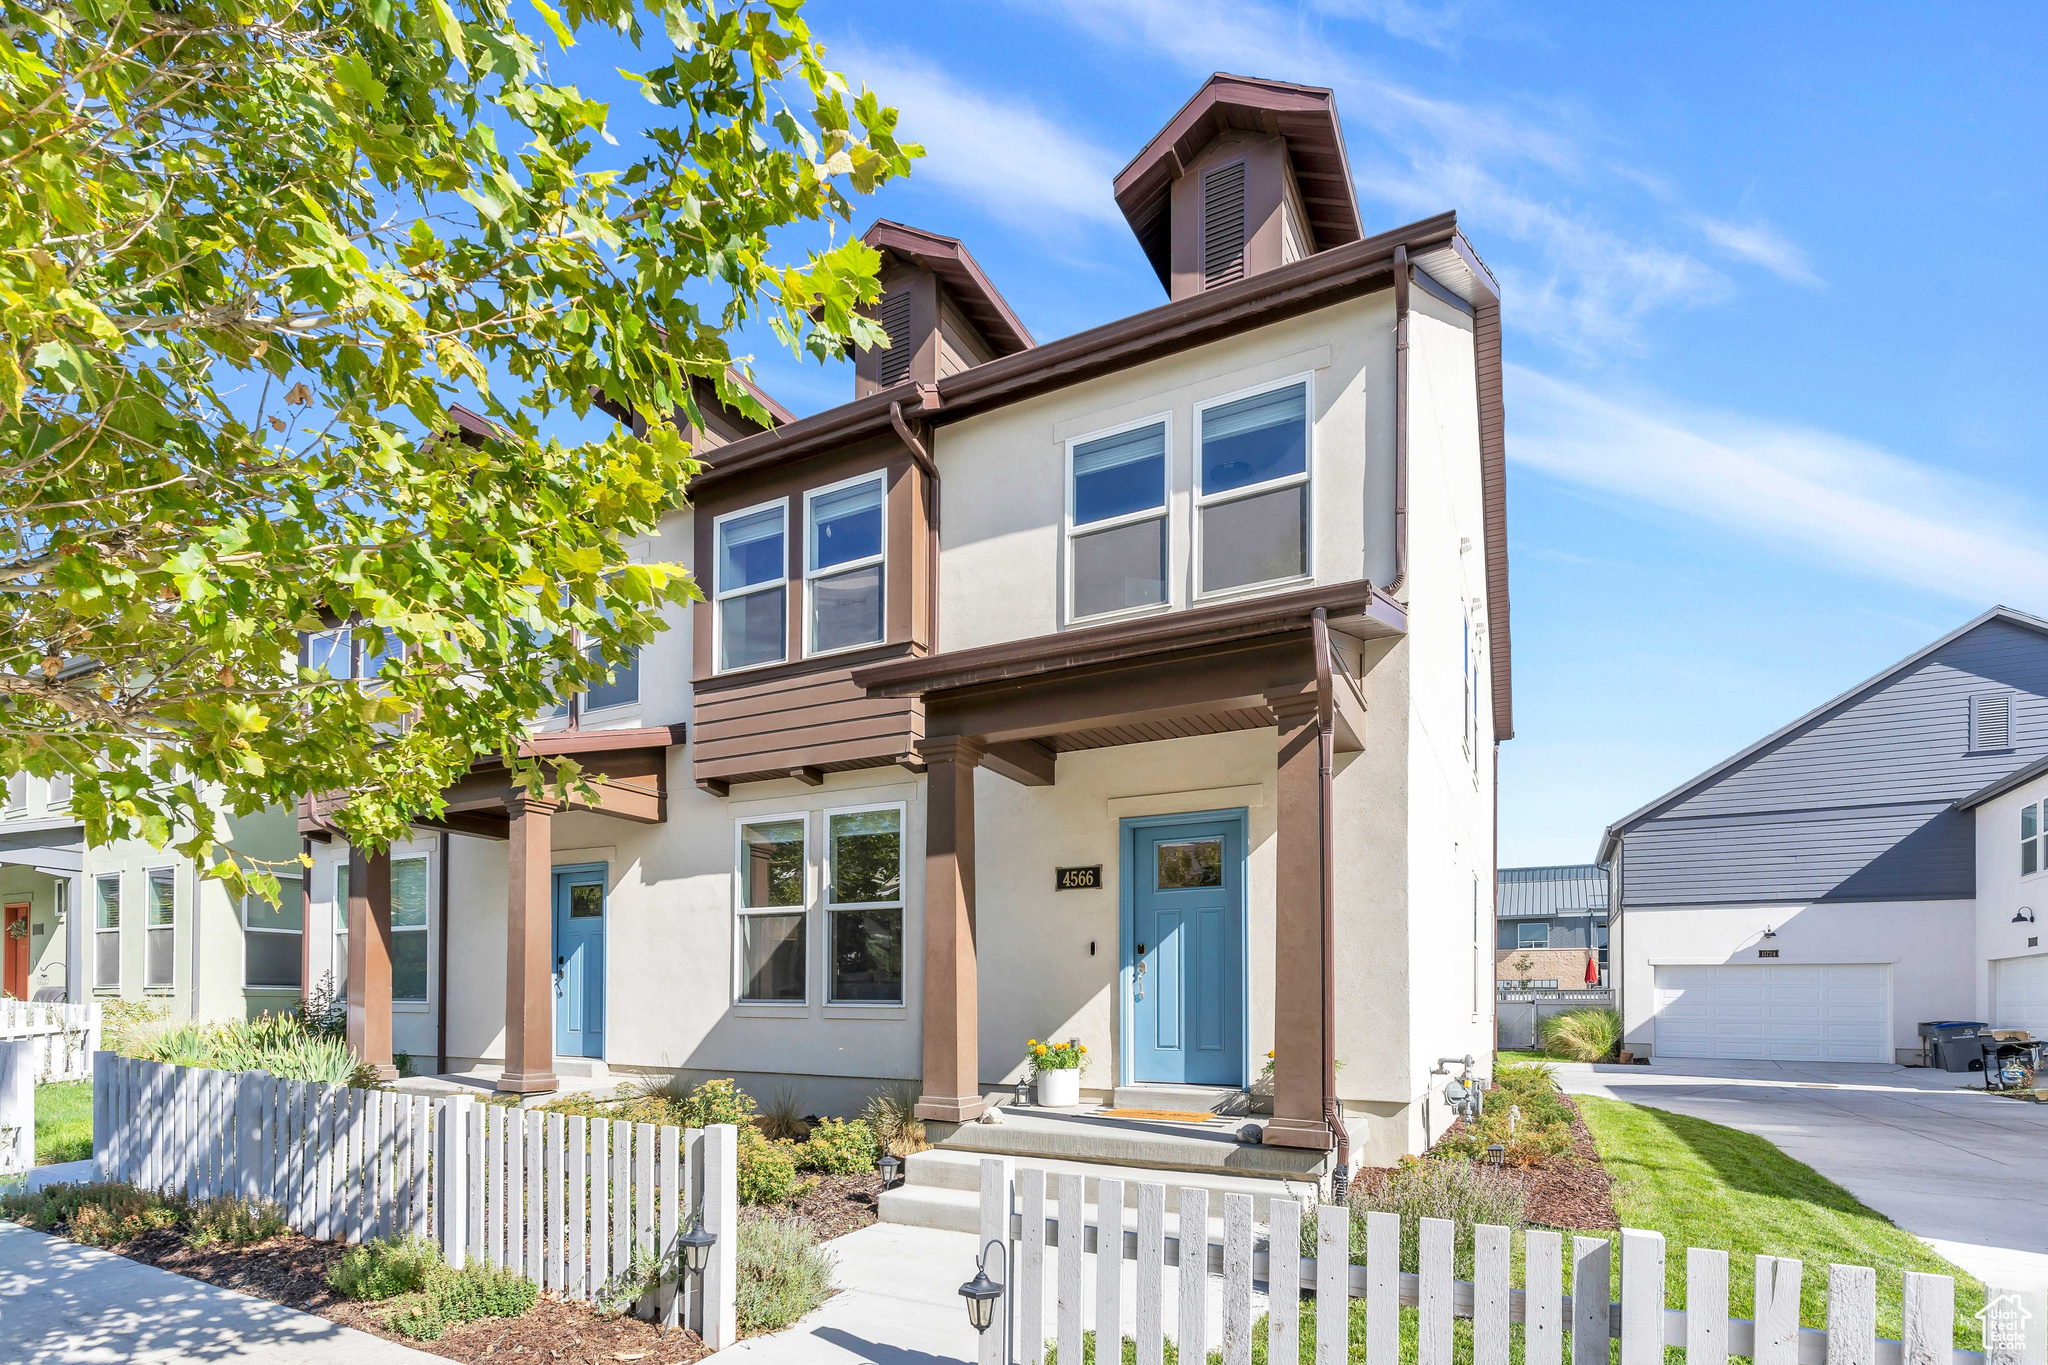
$395,000
3
bds
|
2
ba
|
1,373
sqft
|
built
2019
4566 W Harvest Sun Ln, South Jordan, UT 84009
$-798
Cash flow
-10.5%
Cash-on-Cash Return
3.9%
Cap rate
0.6%
Rent to Value Ratio
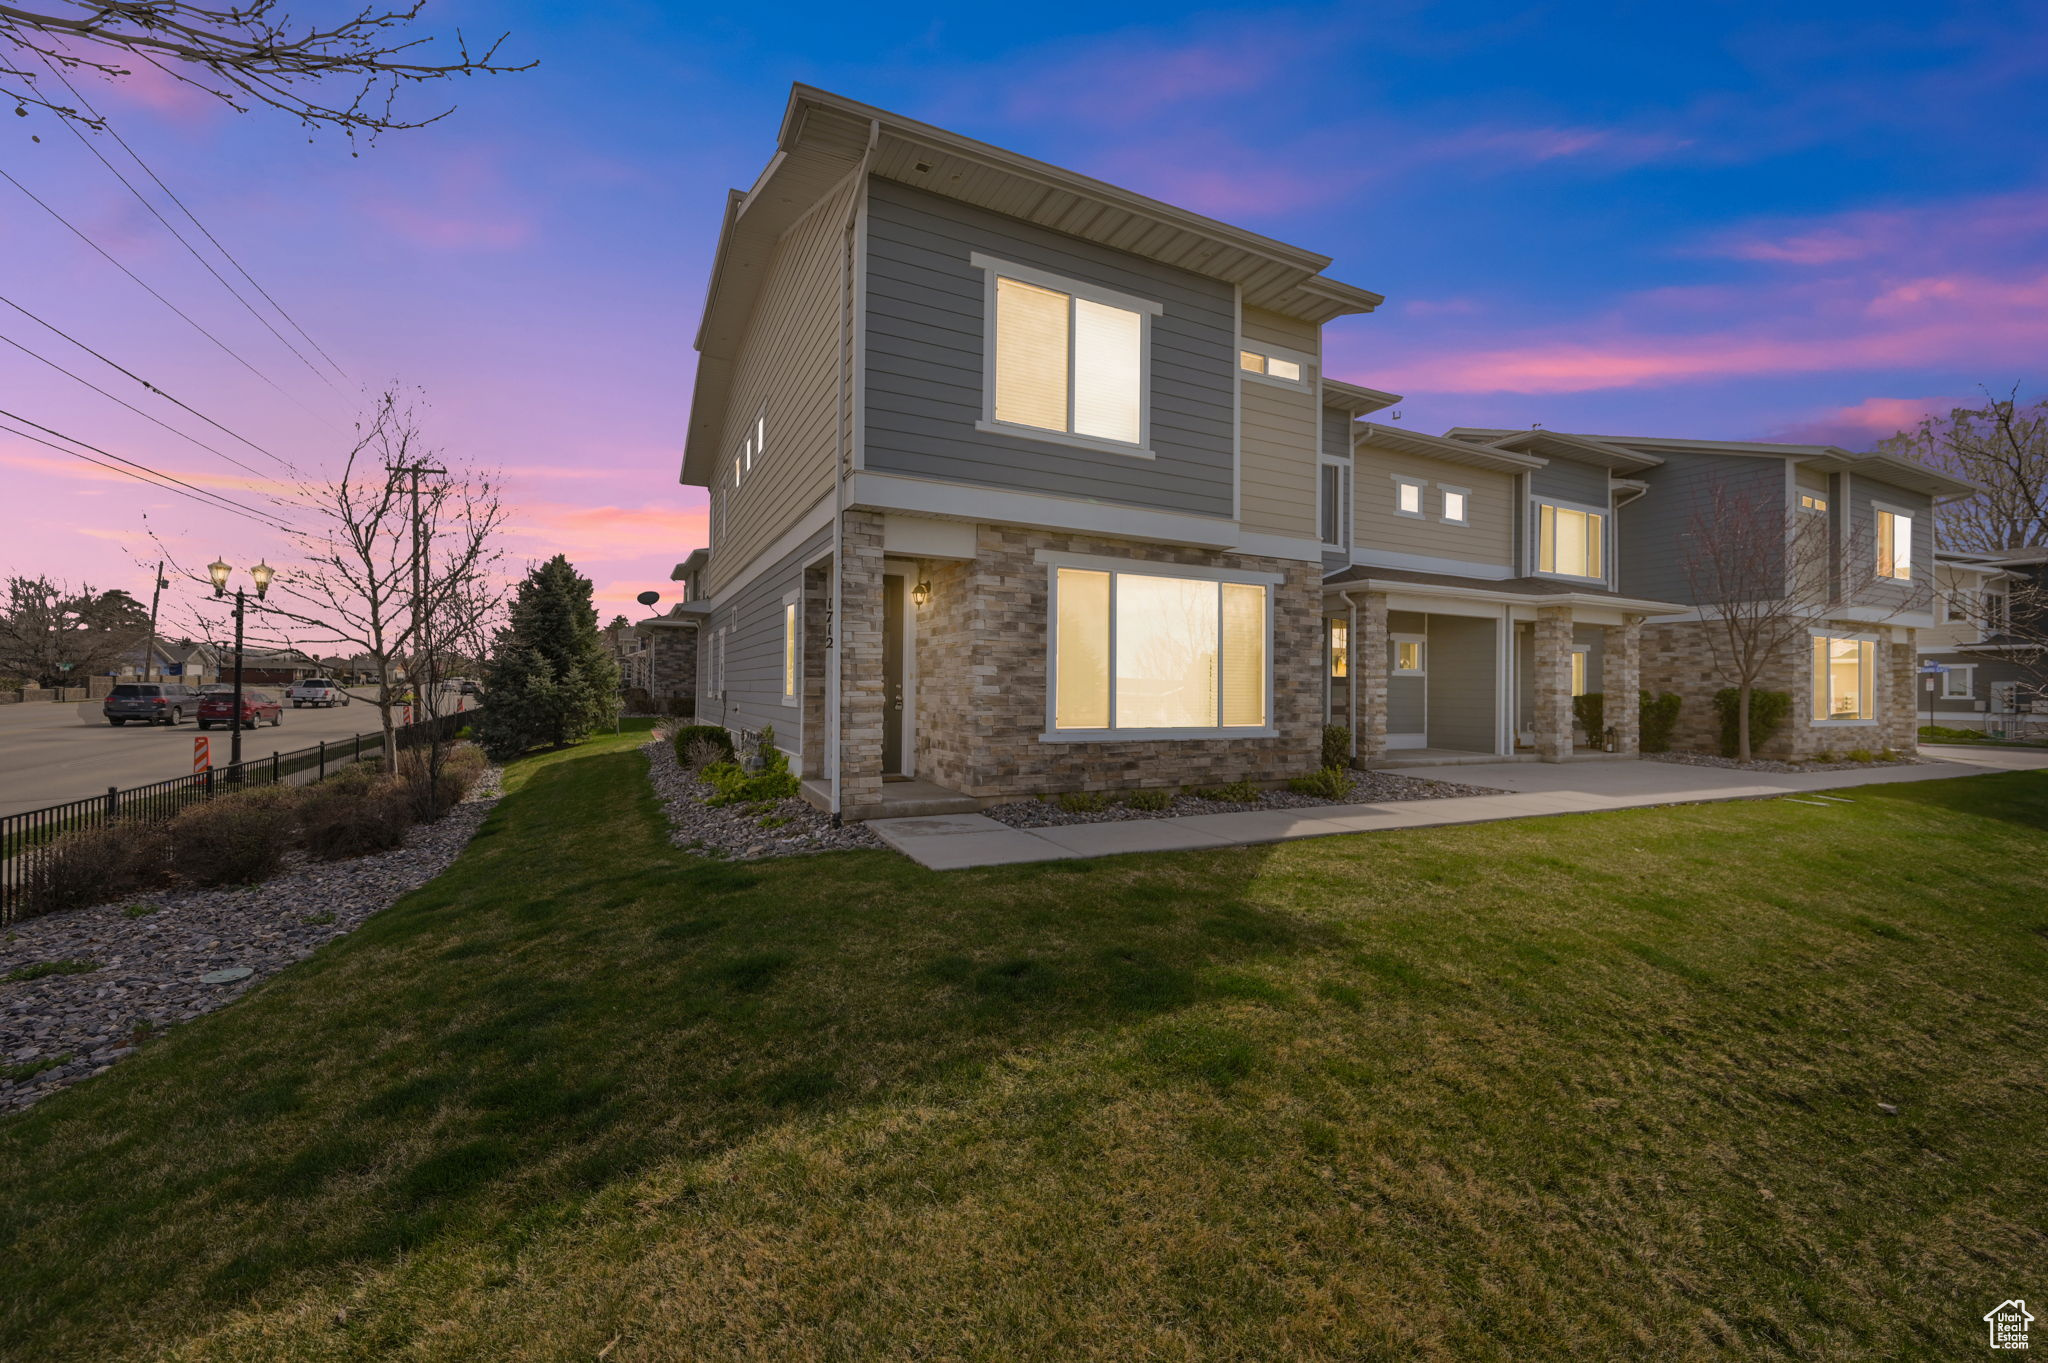
Active
$435,000
3
bds
|
2
ba
|
1,376
sqft
|
built
2016
1712 W Naxos Ln, South Jordan, UT 84095
$-1,105
Cash flow
-13.3%
Cash-on-Cash Return
3.2%
Cap rate
0.5%
Rent to Value Ratio
257 out of 315 properties for sale in South Jordan, UT
Limited Results Shown
Create a free account, or log in to reveal all property listings and enjoy the complete experience.
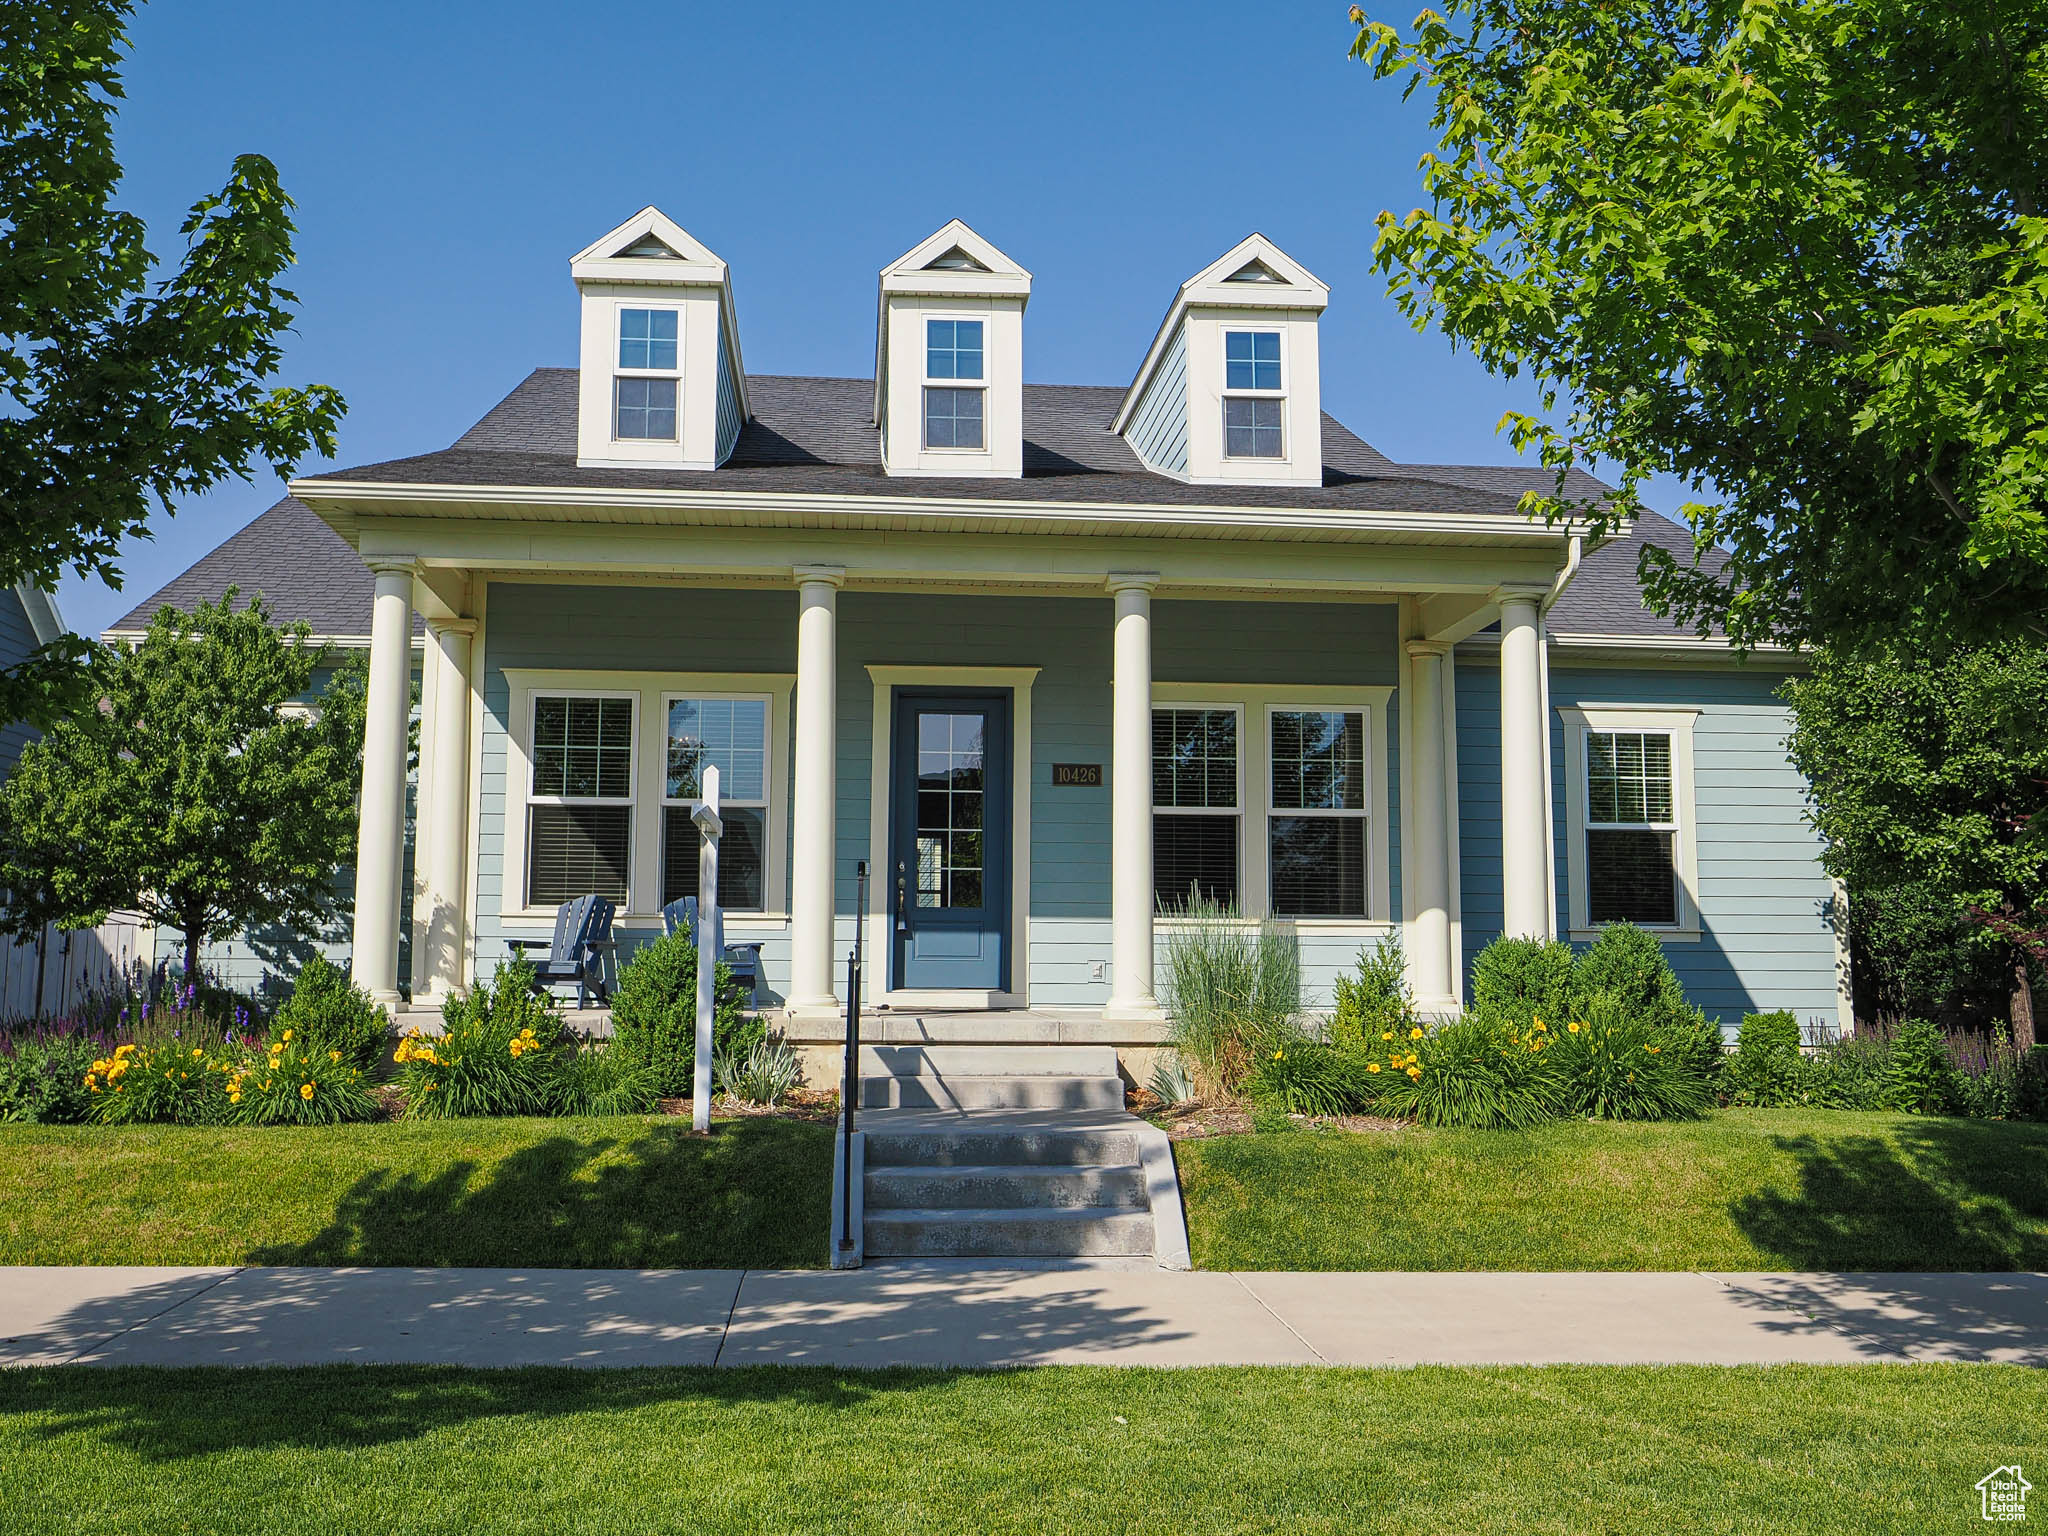
Active
$850,000
7
bds
|
4
ba
|
4,184
sqft
|
built
2013
10426 S Split Rock Dr, South Jordan, UT 84009
$-2,970
Cash flow
-18.2%
Cash-on-Cash Return
2.1%
Cap rate
0.3%
Rent to Value Ratio
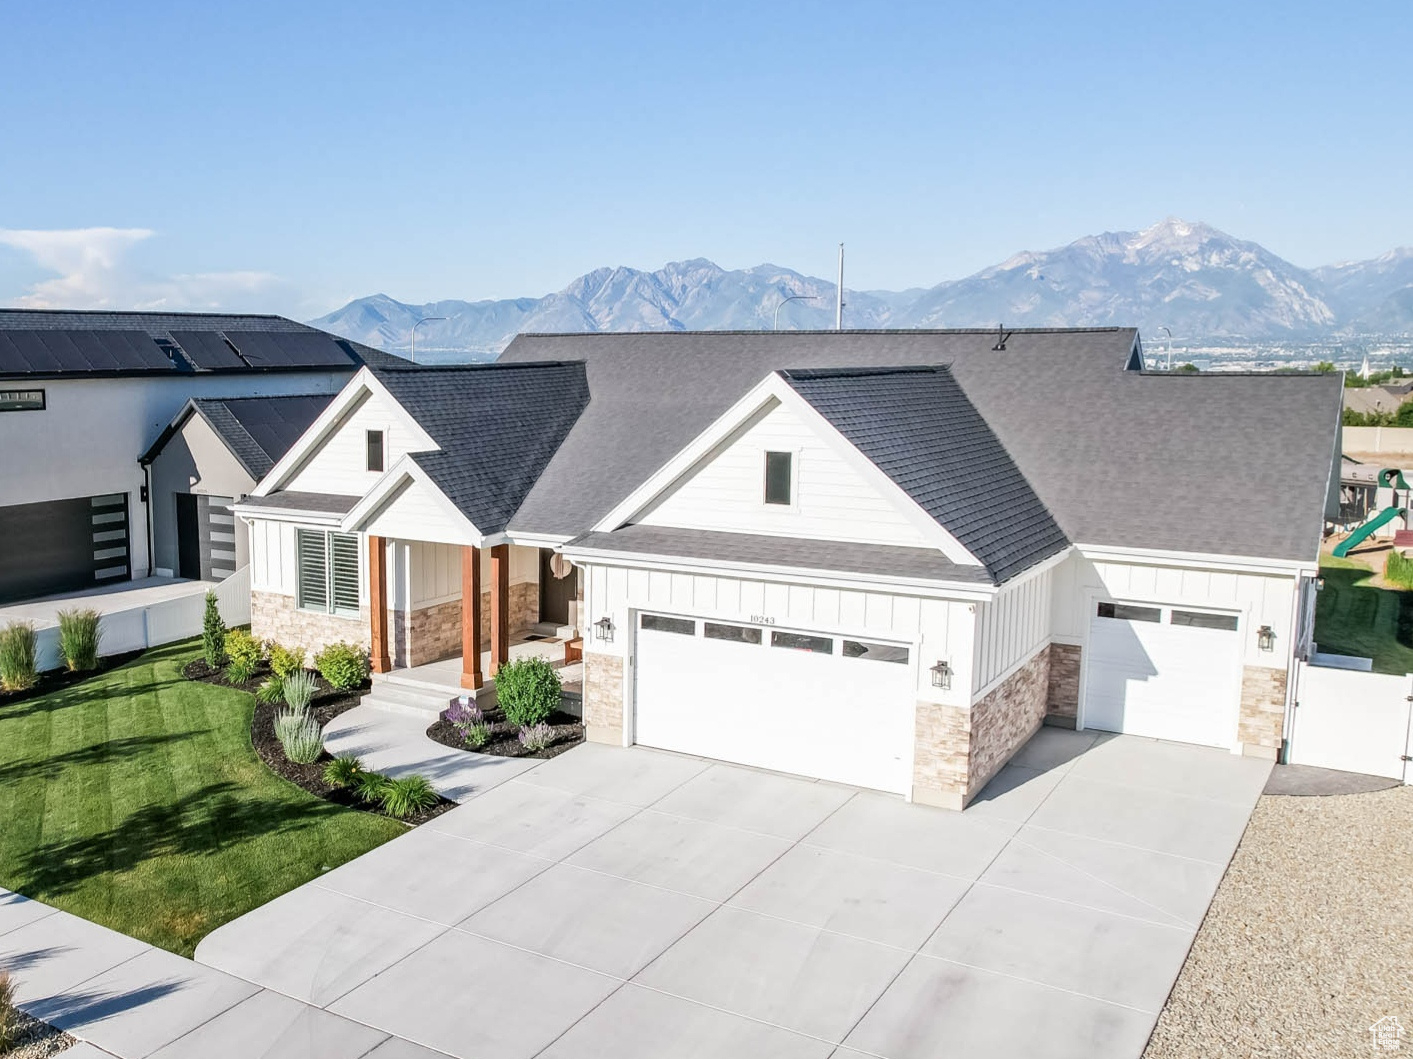
Active
$1,090,000
6
bds
|
5
ba
|
4,815
sqft
|
built
2021
10243 S Dial Ct, South Jordan, UT 84009
$-2,779
Cash flow
-13.3%
Cash-on-Cash Return
3.2%
Cap rate
0.4%
Rent to Value Ratio
Active
$849,700
4
bds
|
4
ba
|
3,136
sqft
|
built
2016
10616 S Wistful Way, South Jordan, UT 84009
$-2,152
Cash flow
-13.2%
Cash-on-Cash Return
3.3%
Cap rate
0.5%
Rent to Value Ratio
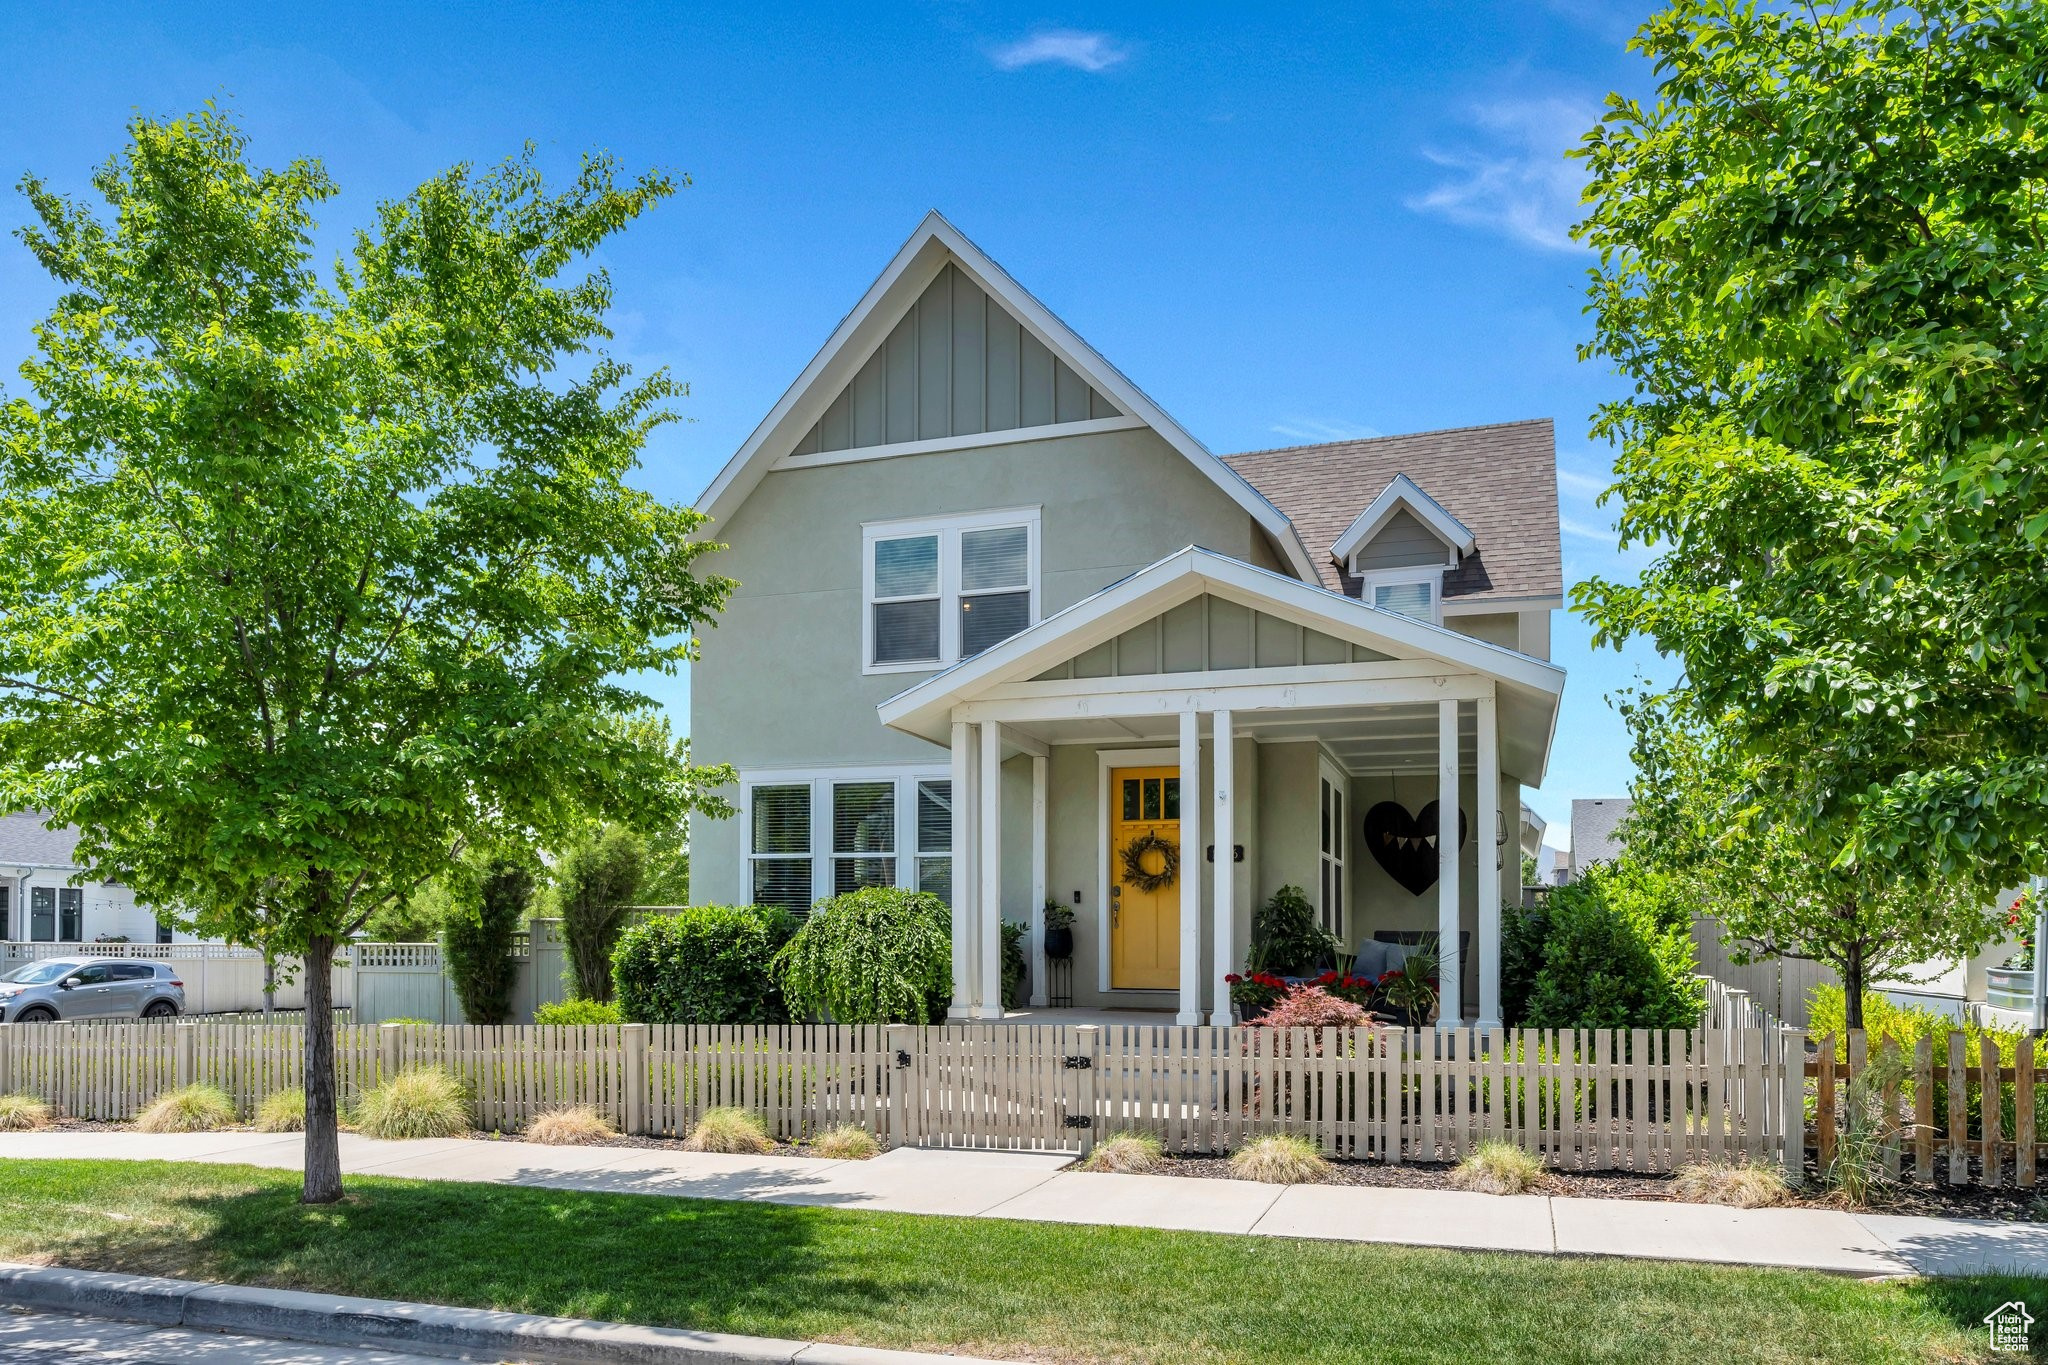
Active
$680,000
3
bds
|
3
ba
|
2,778
sqft
|
built
2005
3884 W Coral Dune Dr, South Jordan, UT 84009
$-2,311
Cash flow
-17.7%
Cash-on-Cash Return
2.2%
Cap rate
0.3%
Rent to Value Ratio
Active
$415,000
2
bds
|
3
ba
|
1,388
sqft
|
built
2012
4851 W Daybreak Pkwy, South Jordan, UT 84009
$-1,256
Cash flow
-15.8%
Cash-on-Cash Return
2.7%
Cap rate
0.5%
Rent to Value Ratio
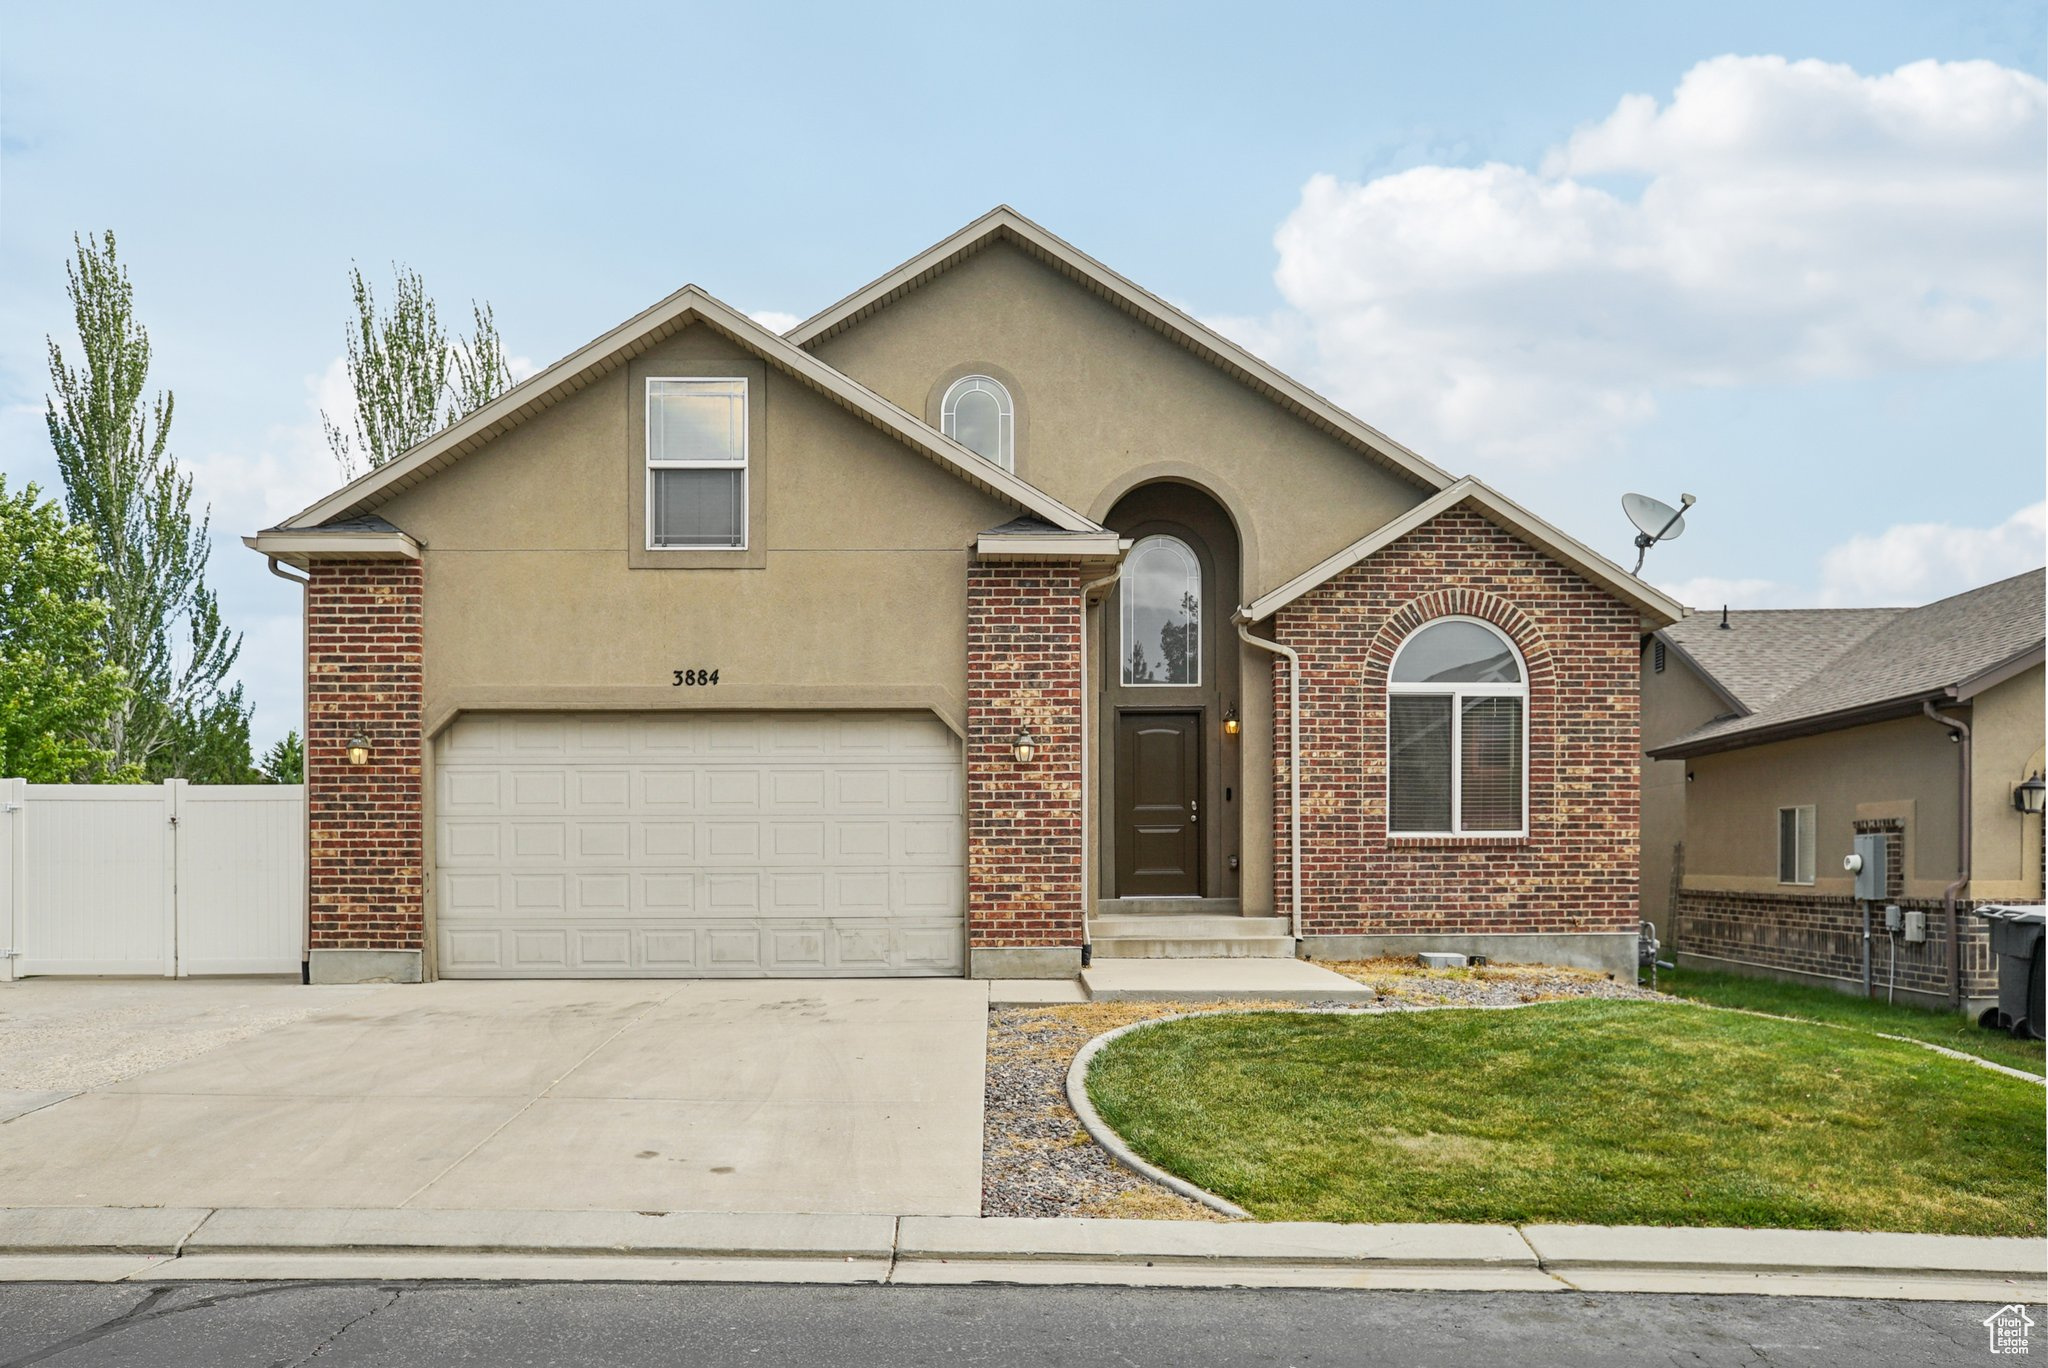
Active
$809,000
6
bds
|
4
ba
|
4,006
sqft
|
built
2001
10314 S 3970 W, South Jordan, UT 84009
$-2,063
Cash flow
-13.3%
Cash-on-Cash Return
3.2%
Cap rate
0.4%
Rent to Value Ratio
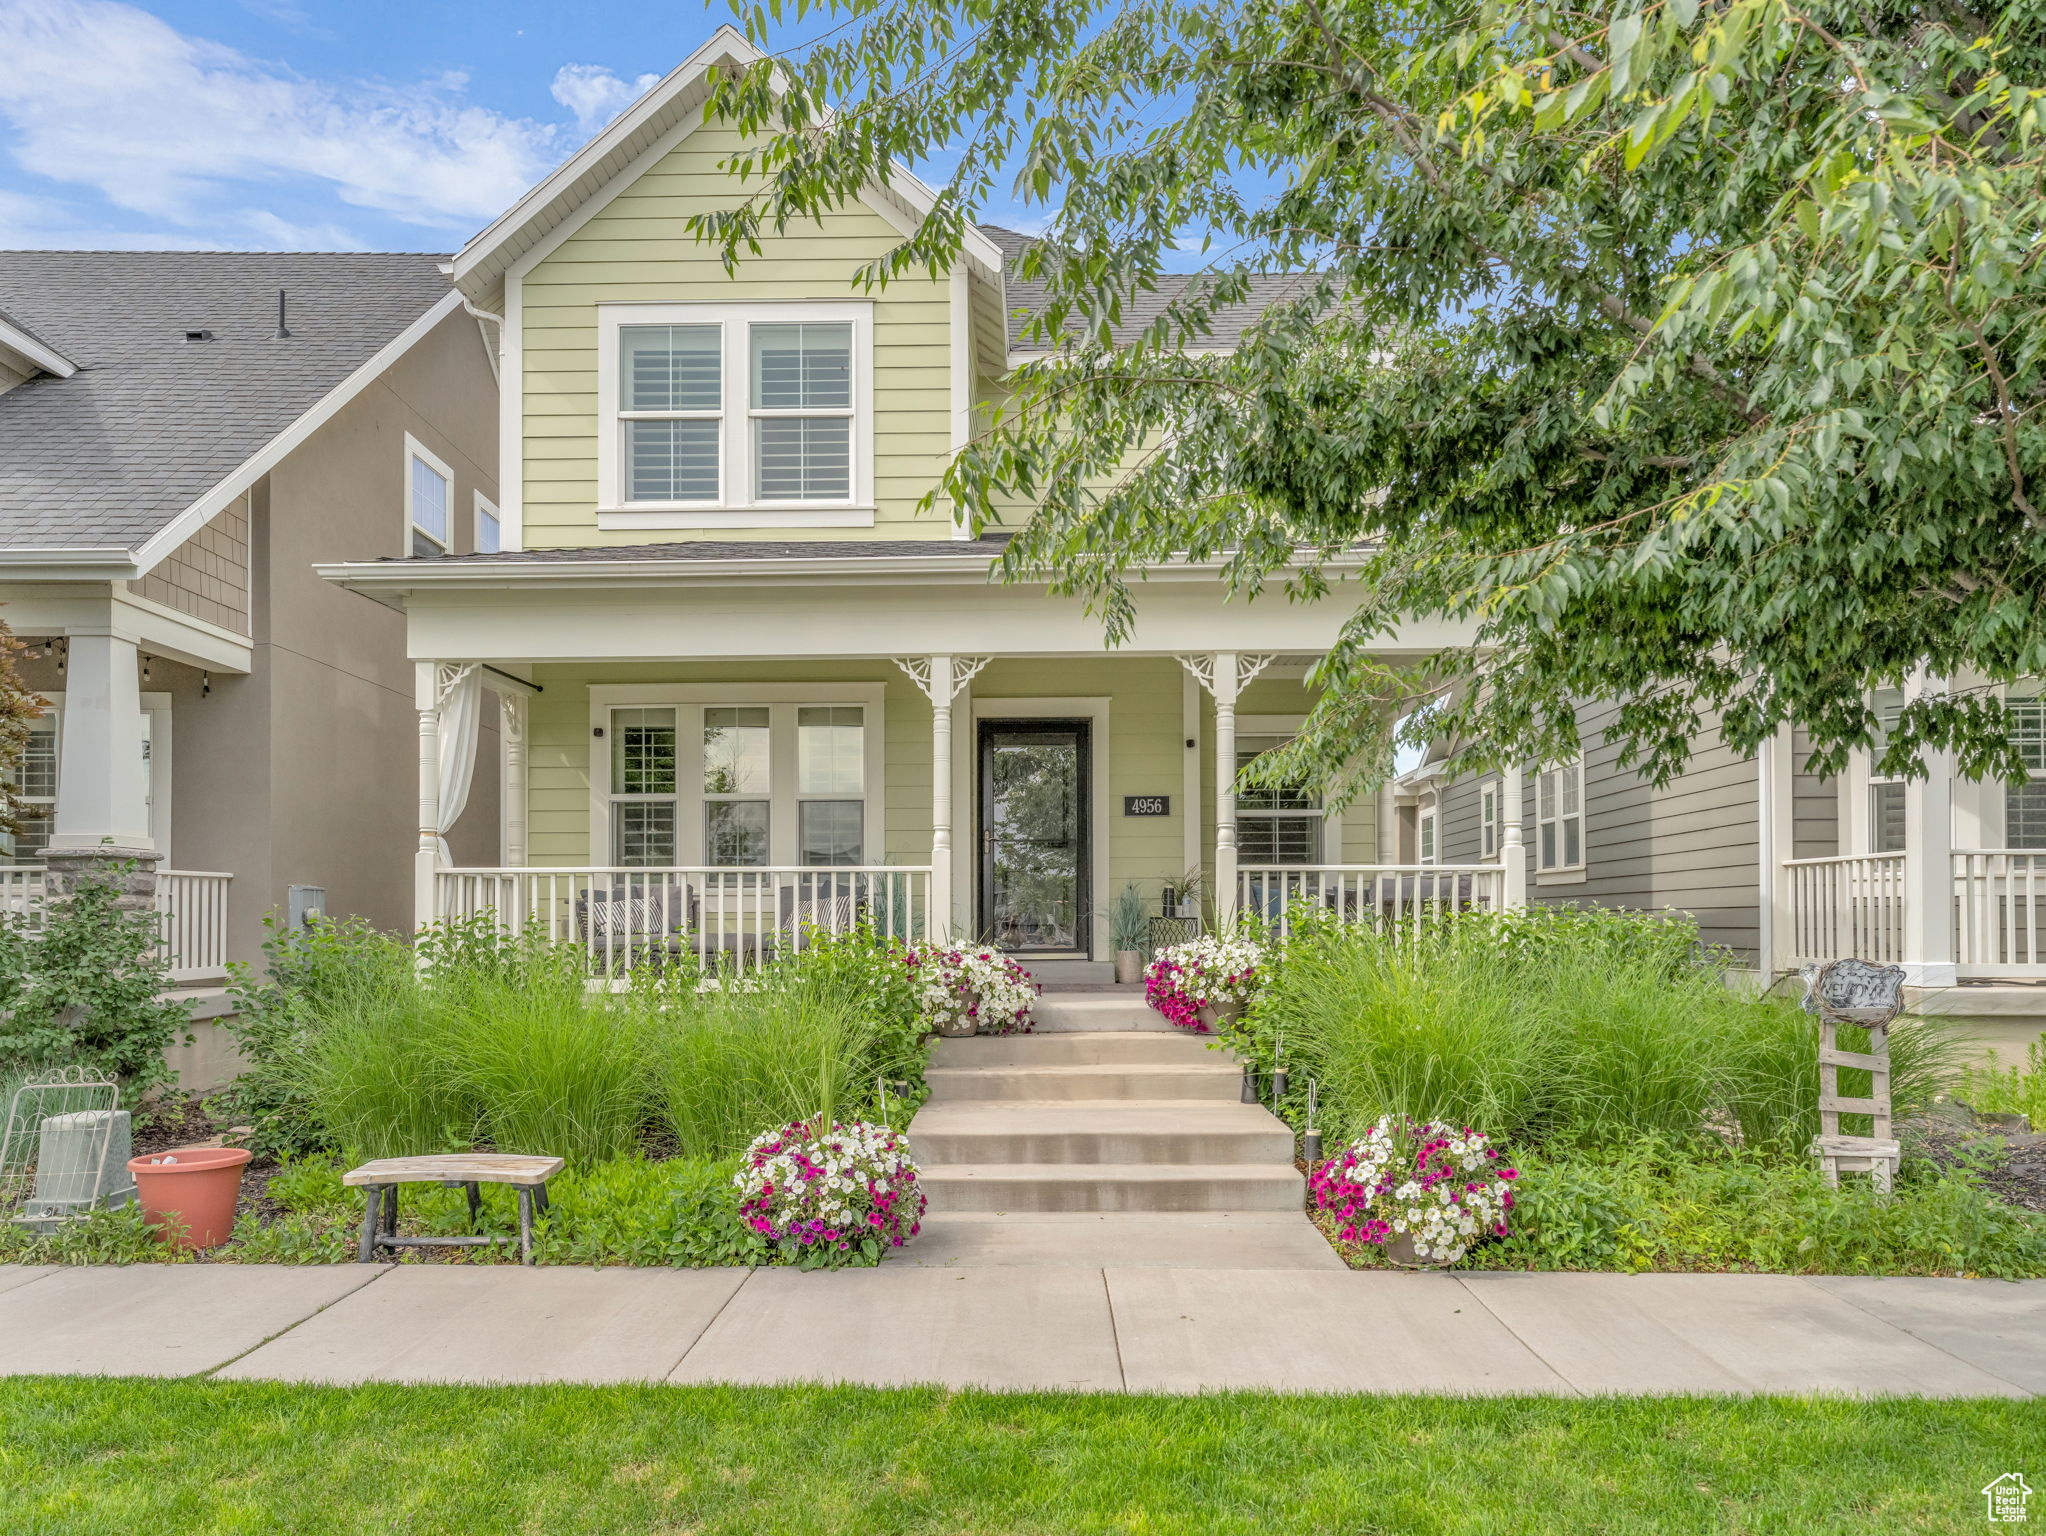
Active
$590,000
4
bds
|
4
ba
|
2,310
sqft
|
built
2012
4956 W Vermillion Dr, South Jordan, UT 84009
$-1,945
Cash flow
-17.2%
Cash-on-Cash Return
2.3%
Cap rate
0.4%
Rent to Value Ratio
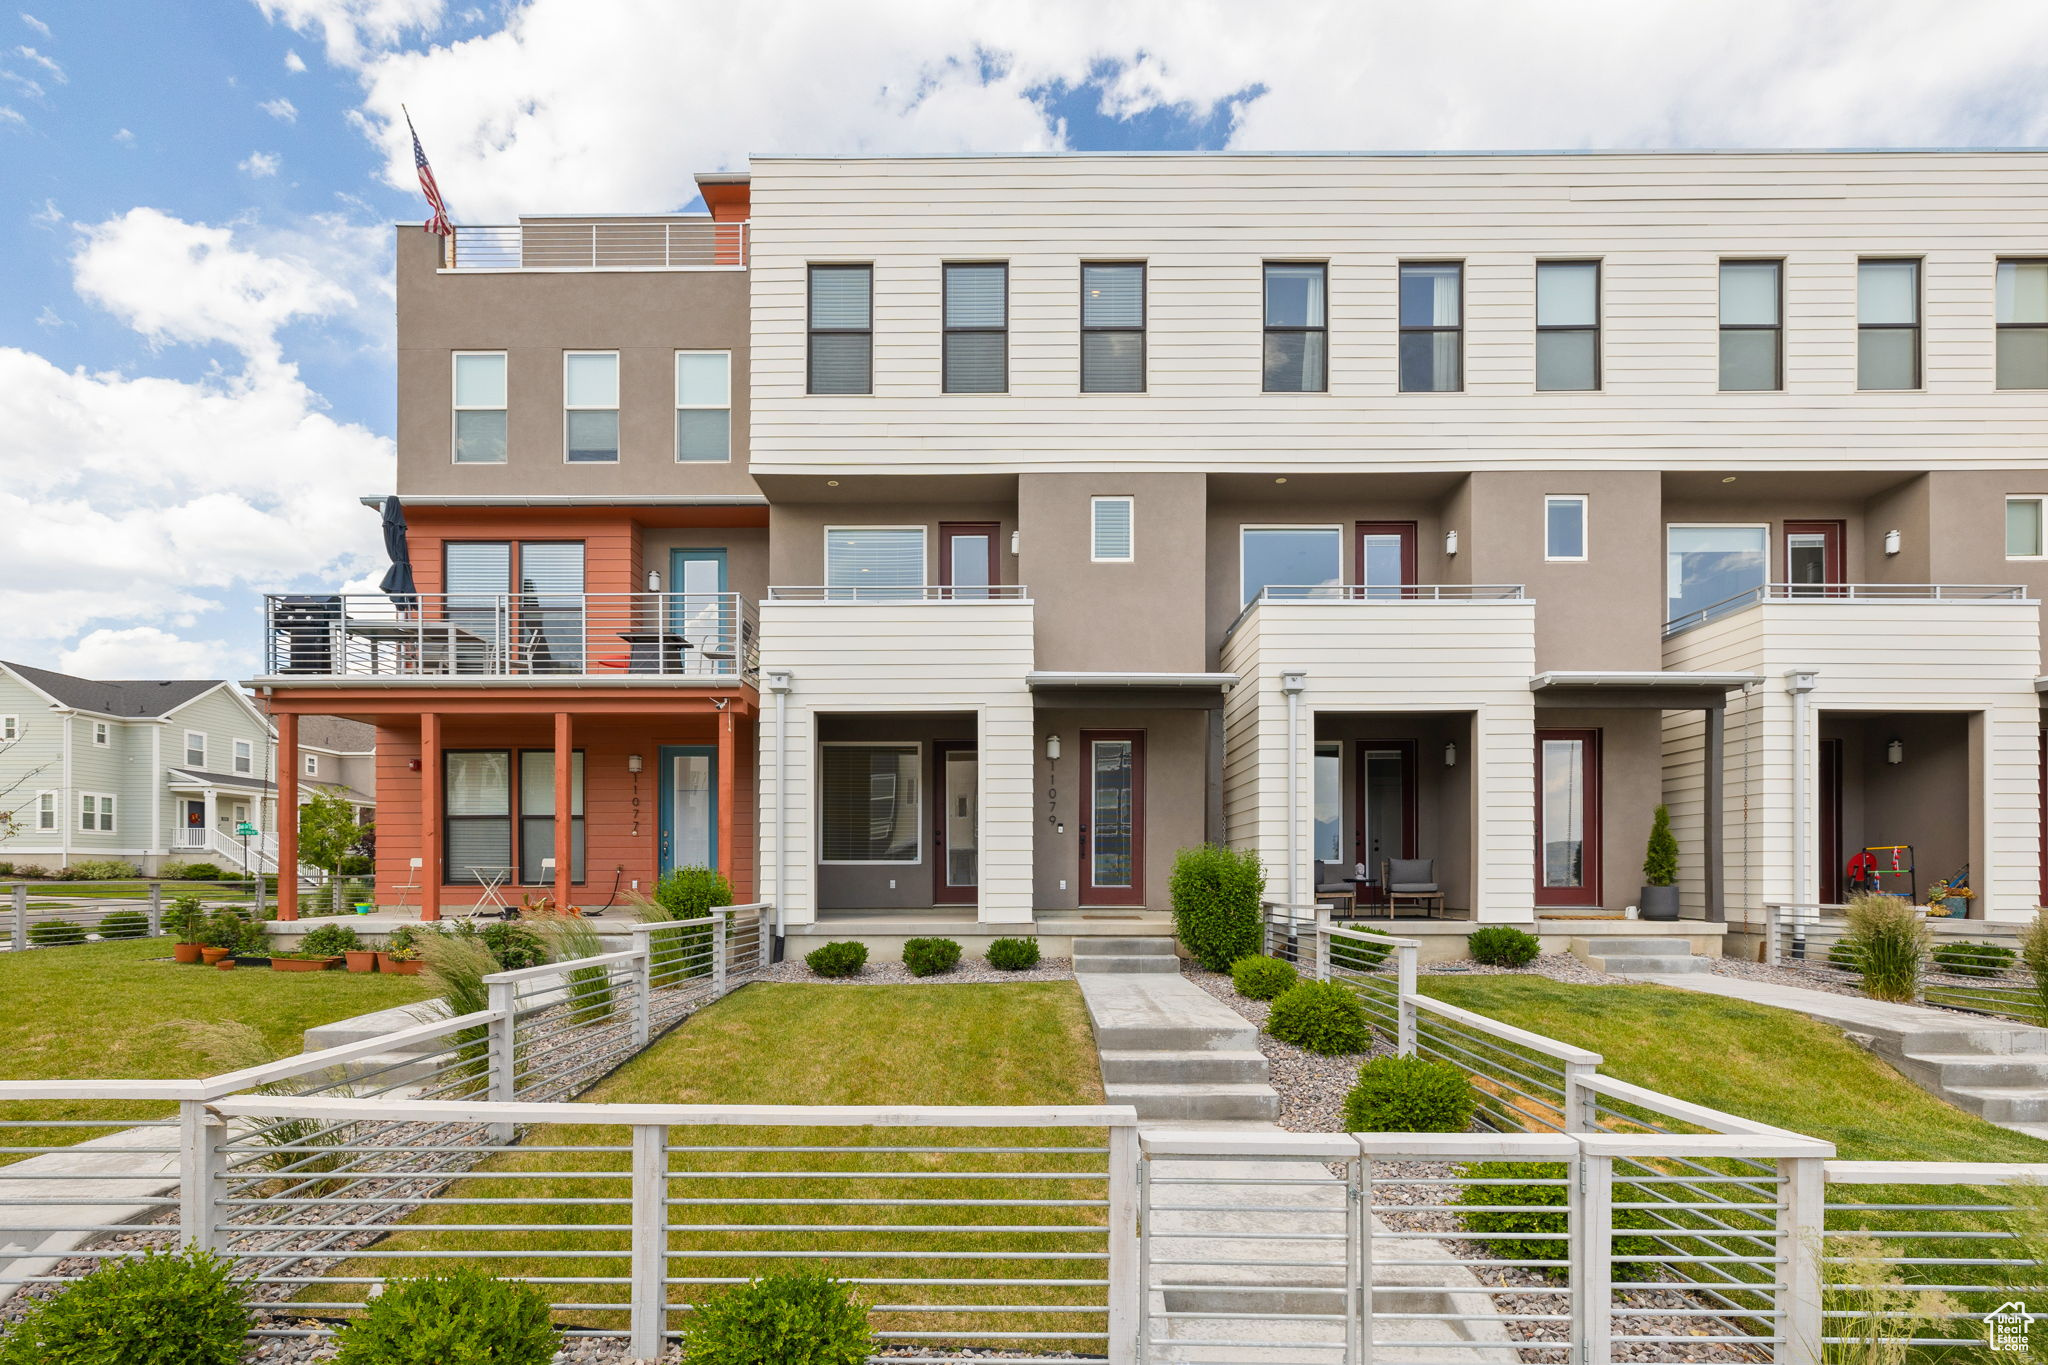
Active
$465,000
3
bds
|
3
ba
|
1,811
sqft
|
built
2021
11079 S Lake Run Rd, South Jordan, UT 84009
$-1,562
Cash flow
-17.5%
Cash-on-Cash Return
2.3%
Cap rate
0.4%
Rent to Value Ratio
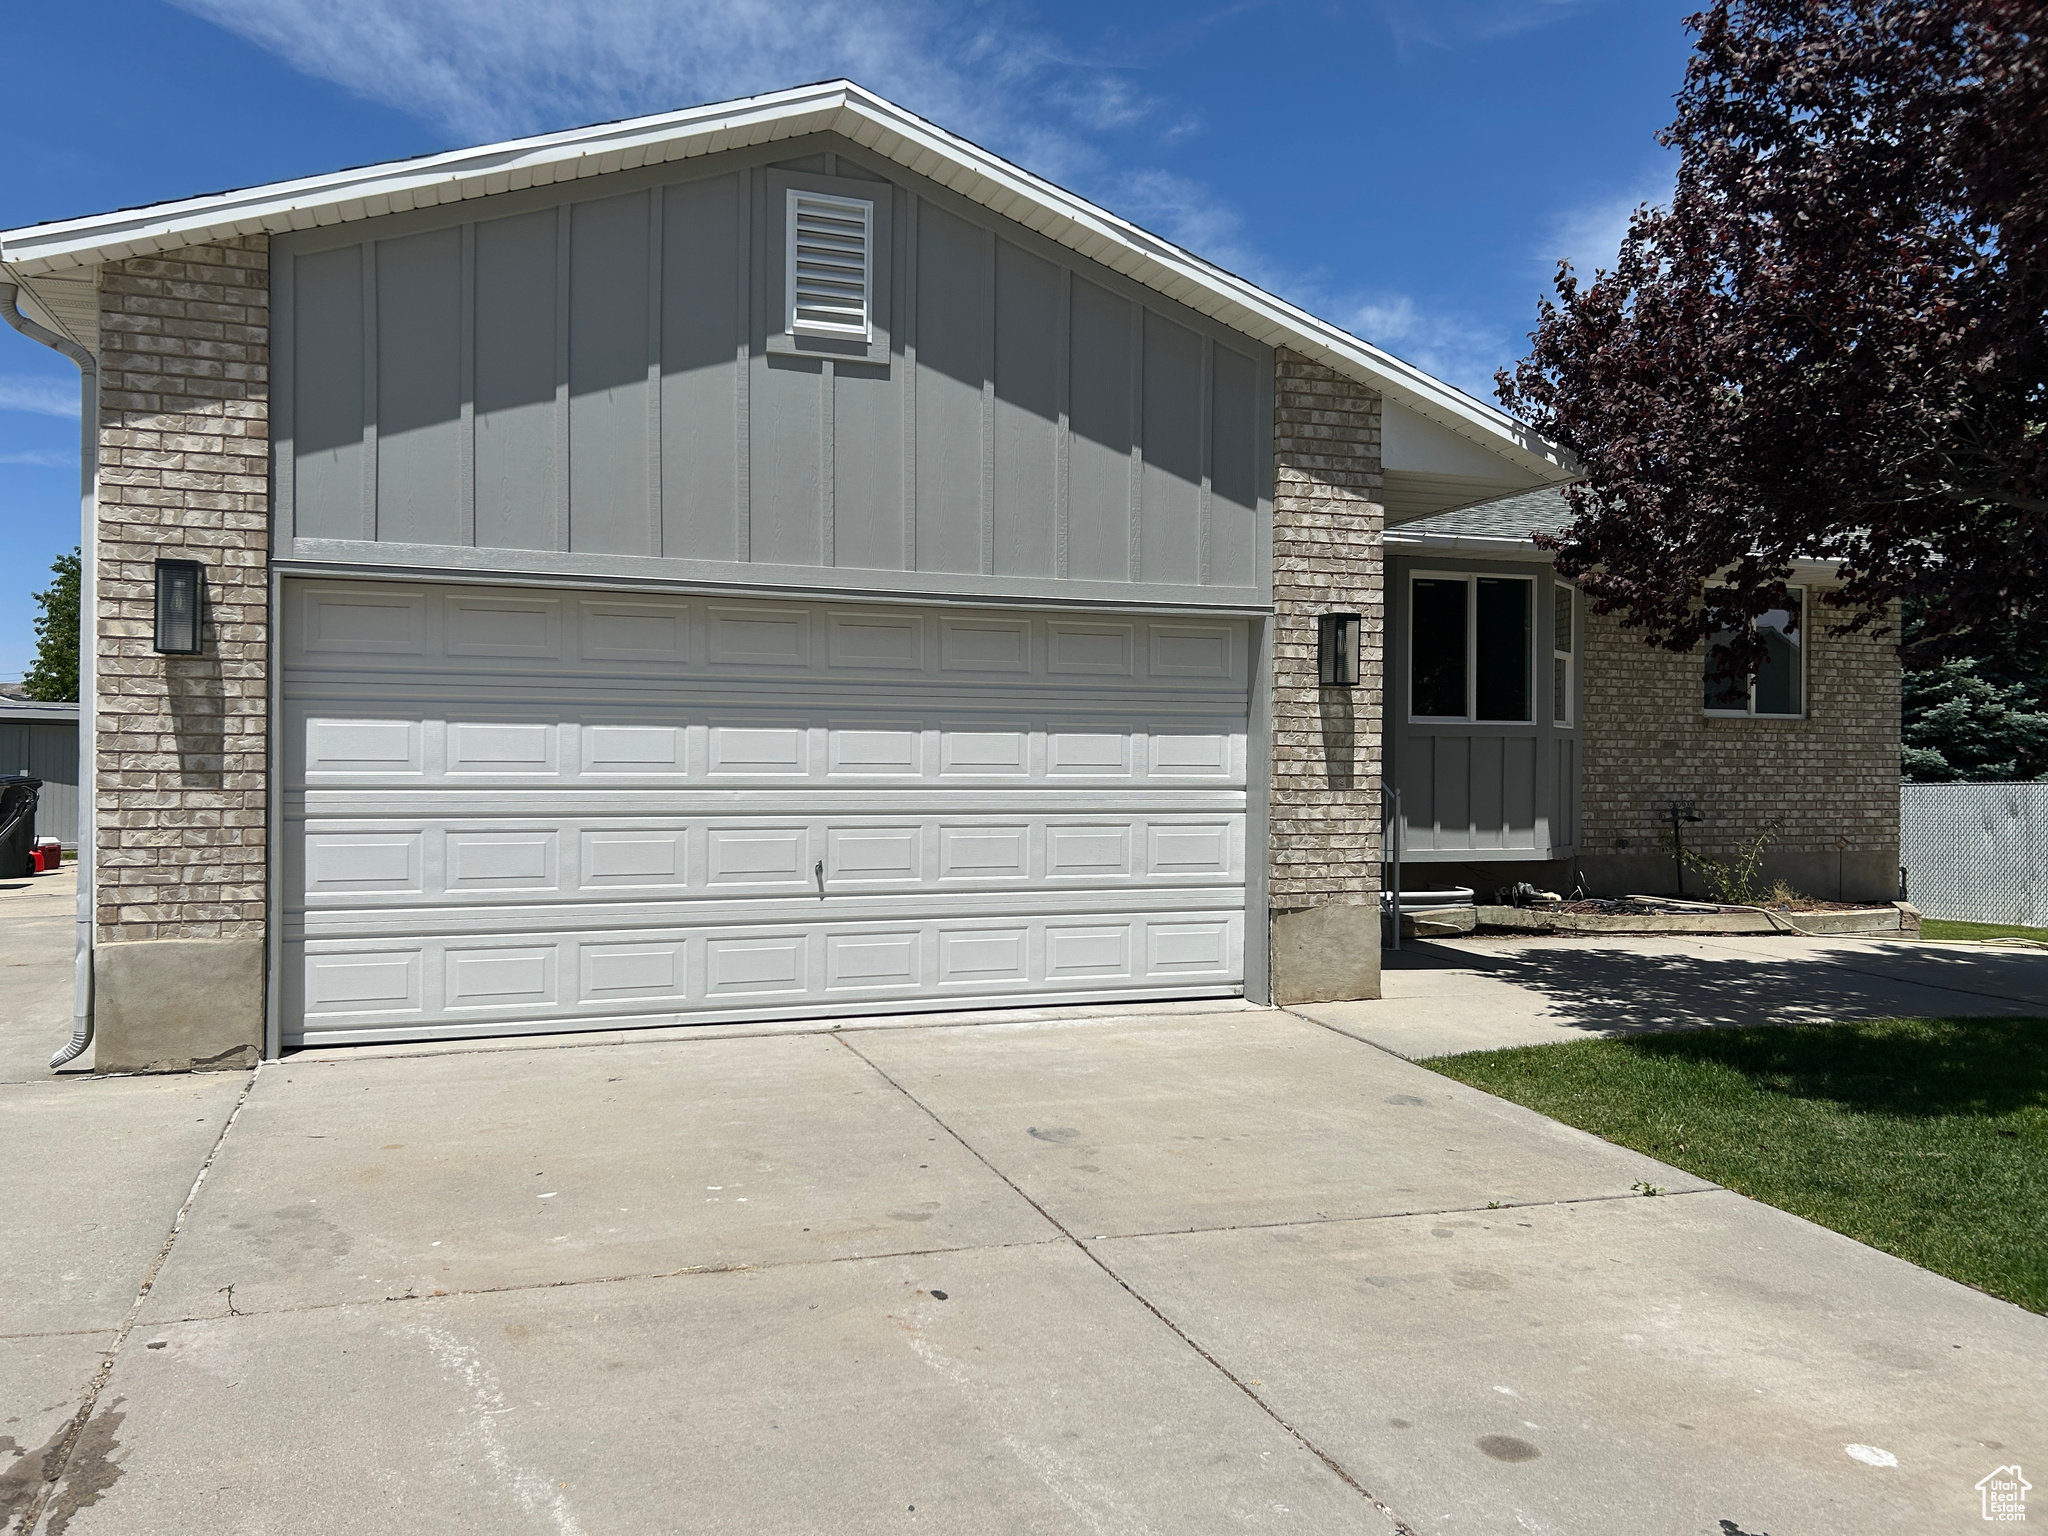
Active
$599,900
4
bds
|
3
ba
|
2,298
sqft
|
built
1994
3974 W Cawdor St, South Jordan, UT 84009
$-2,128
Cash flow
-18.5%
Cash-on-Cash Return
2.0%
Cap rate
0.3%
Rent to Value Ratio
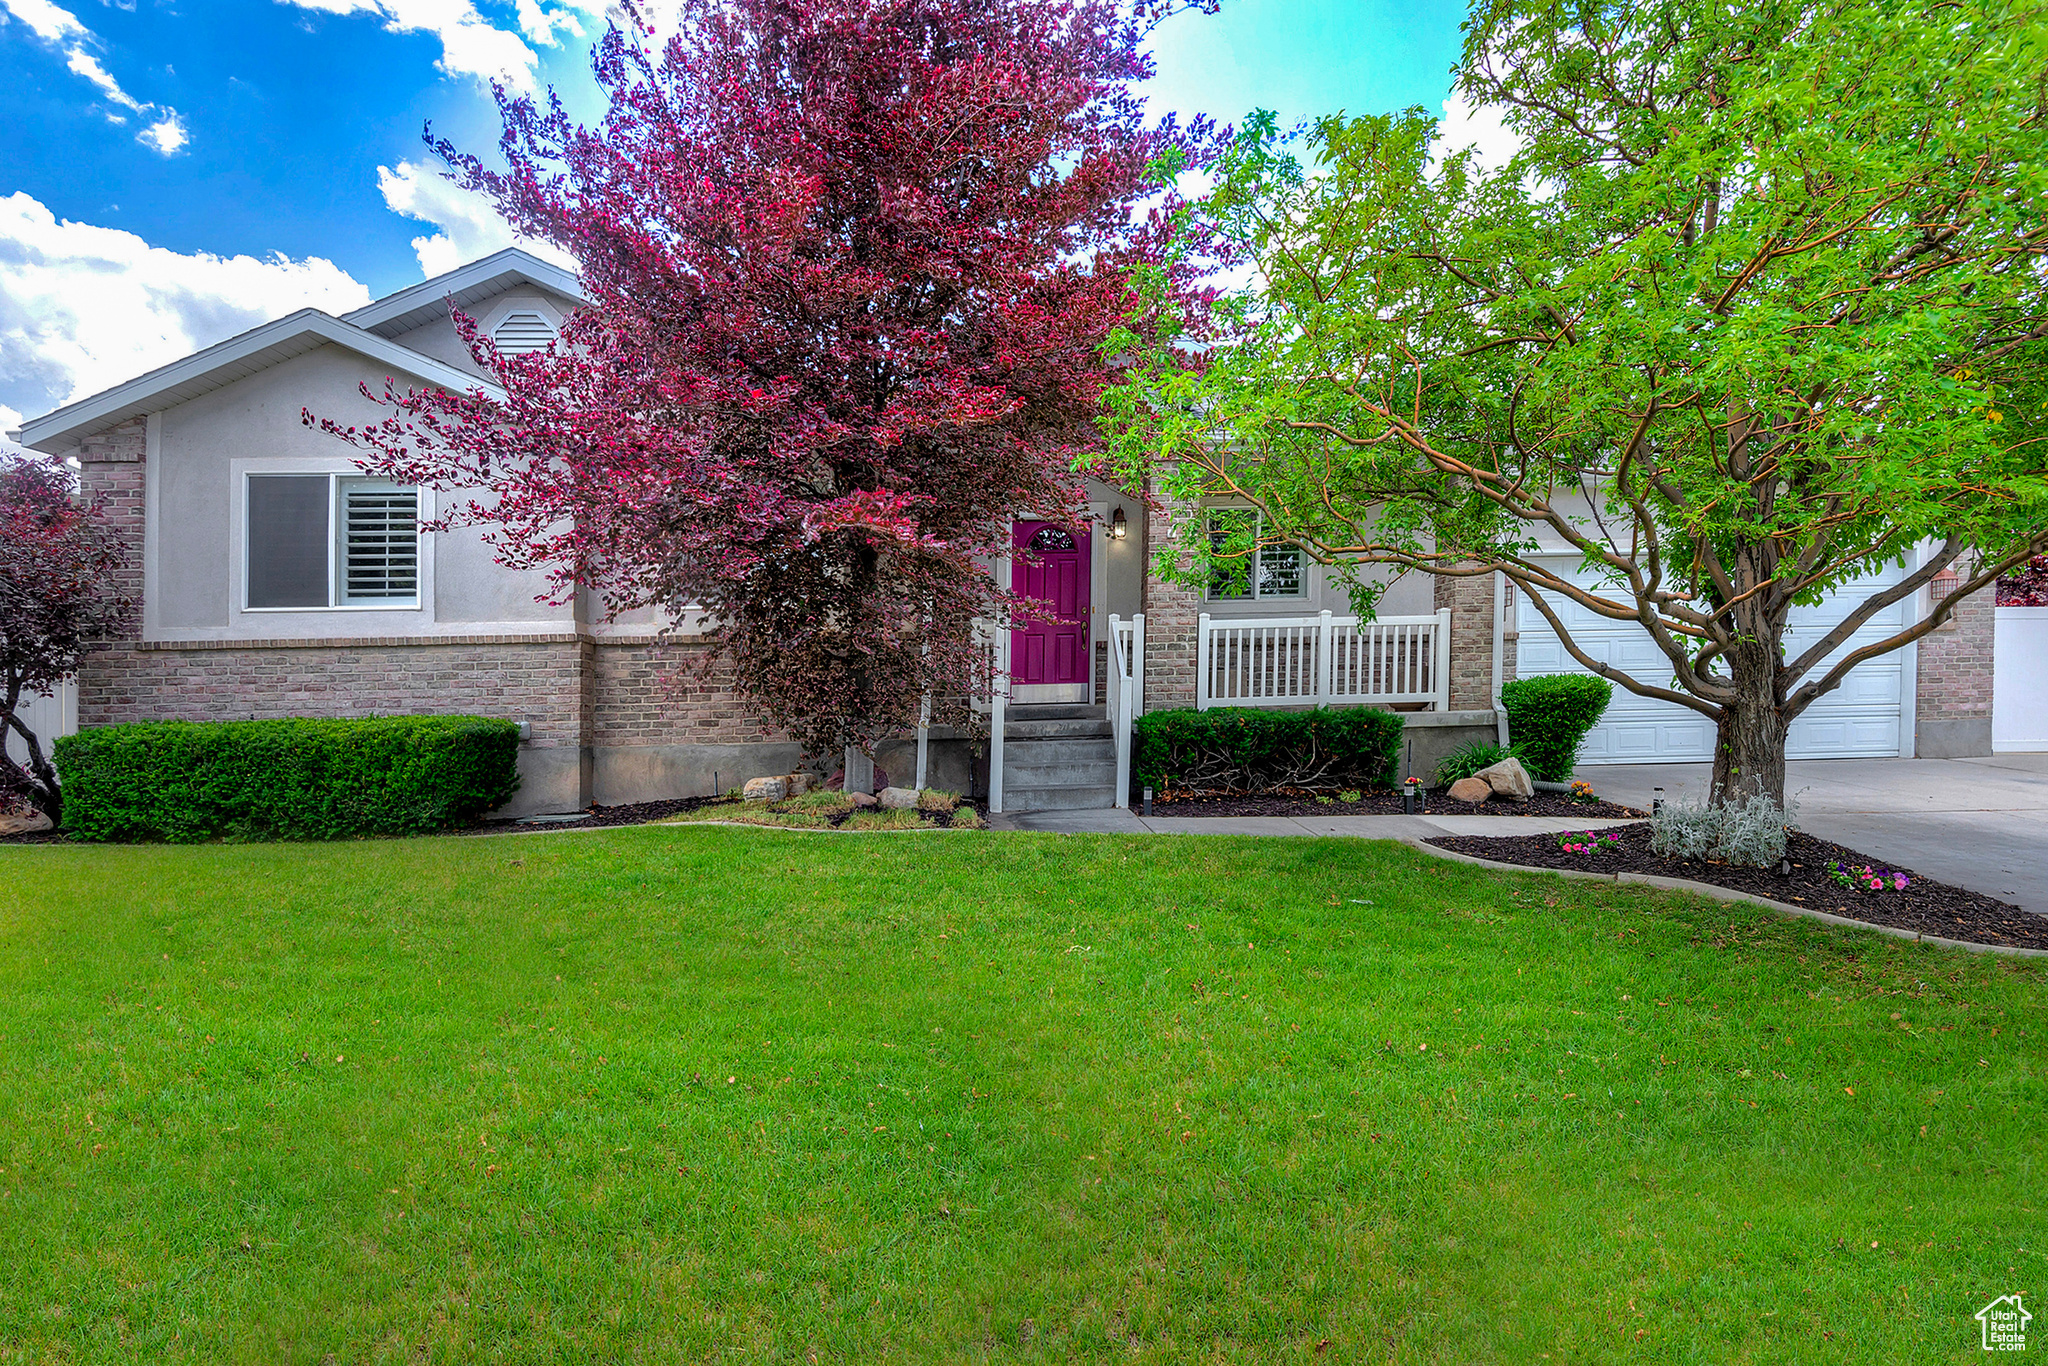
Active
$680,000
5
bds
|
3
ba
|
2,632
sqft
|
built
1997
10156 S Dobbin Ln, South Jordan, UT 84009
$-1,683
Cash flow
-12.9%
Cash-on-Cash Return
3.3%
Cap rate
0.5%
Rent to Value Ratio
Active
$529,000
3
bds
|
3
ba
|
1,760
sqft
|
built
2014
4746 W Daybreak Rim Way, South Jordan, UT 84009
$-1,795
Cash flow
-17.7%
Cash-on-Cash Return
2.2%
Cap rate
0.4%
Rent to Value Ratio
Active
$630,000
4
bds
|
4
ba
|
2,253
sqft
|
built
2017
10401 S Liffey Ln, South Jordan, UT 84009
$-1,208
Cash flow
-10.0%
Cash-on-Cash Return
4.0%
Cap rate
0.6%
Rent to Value Ratio
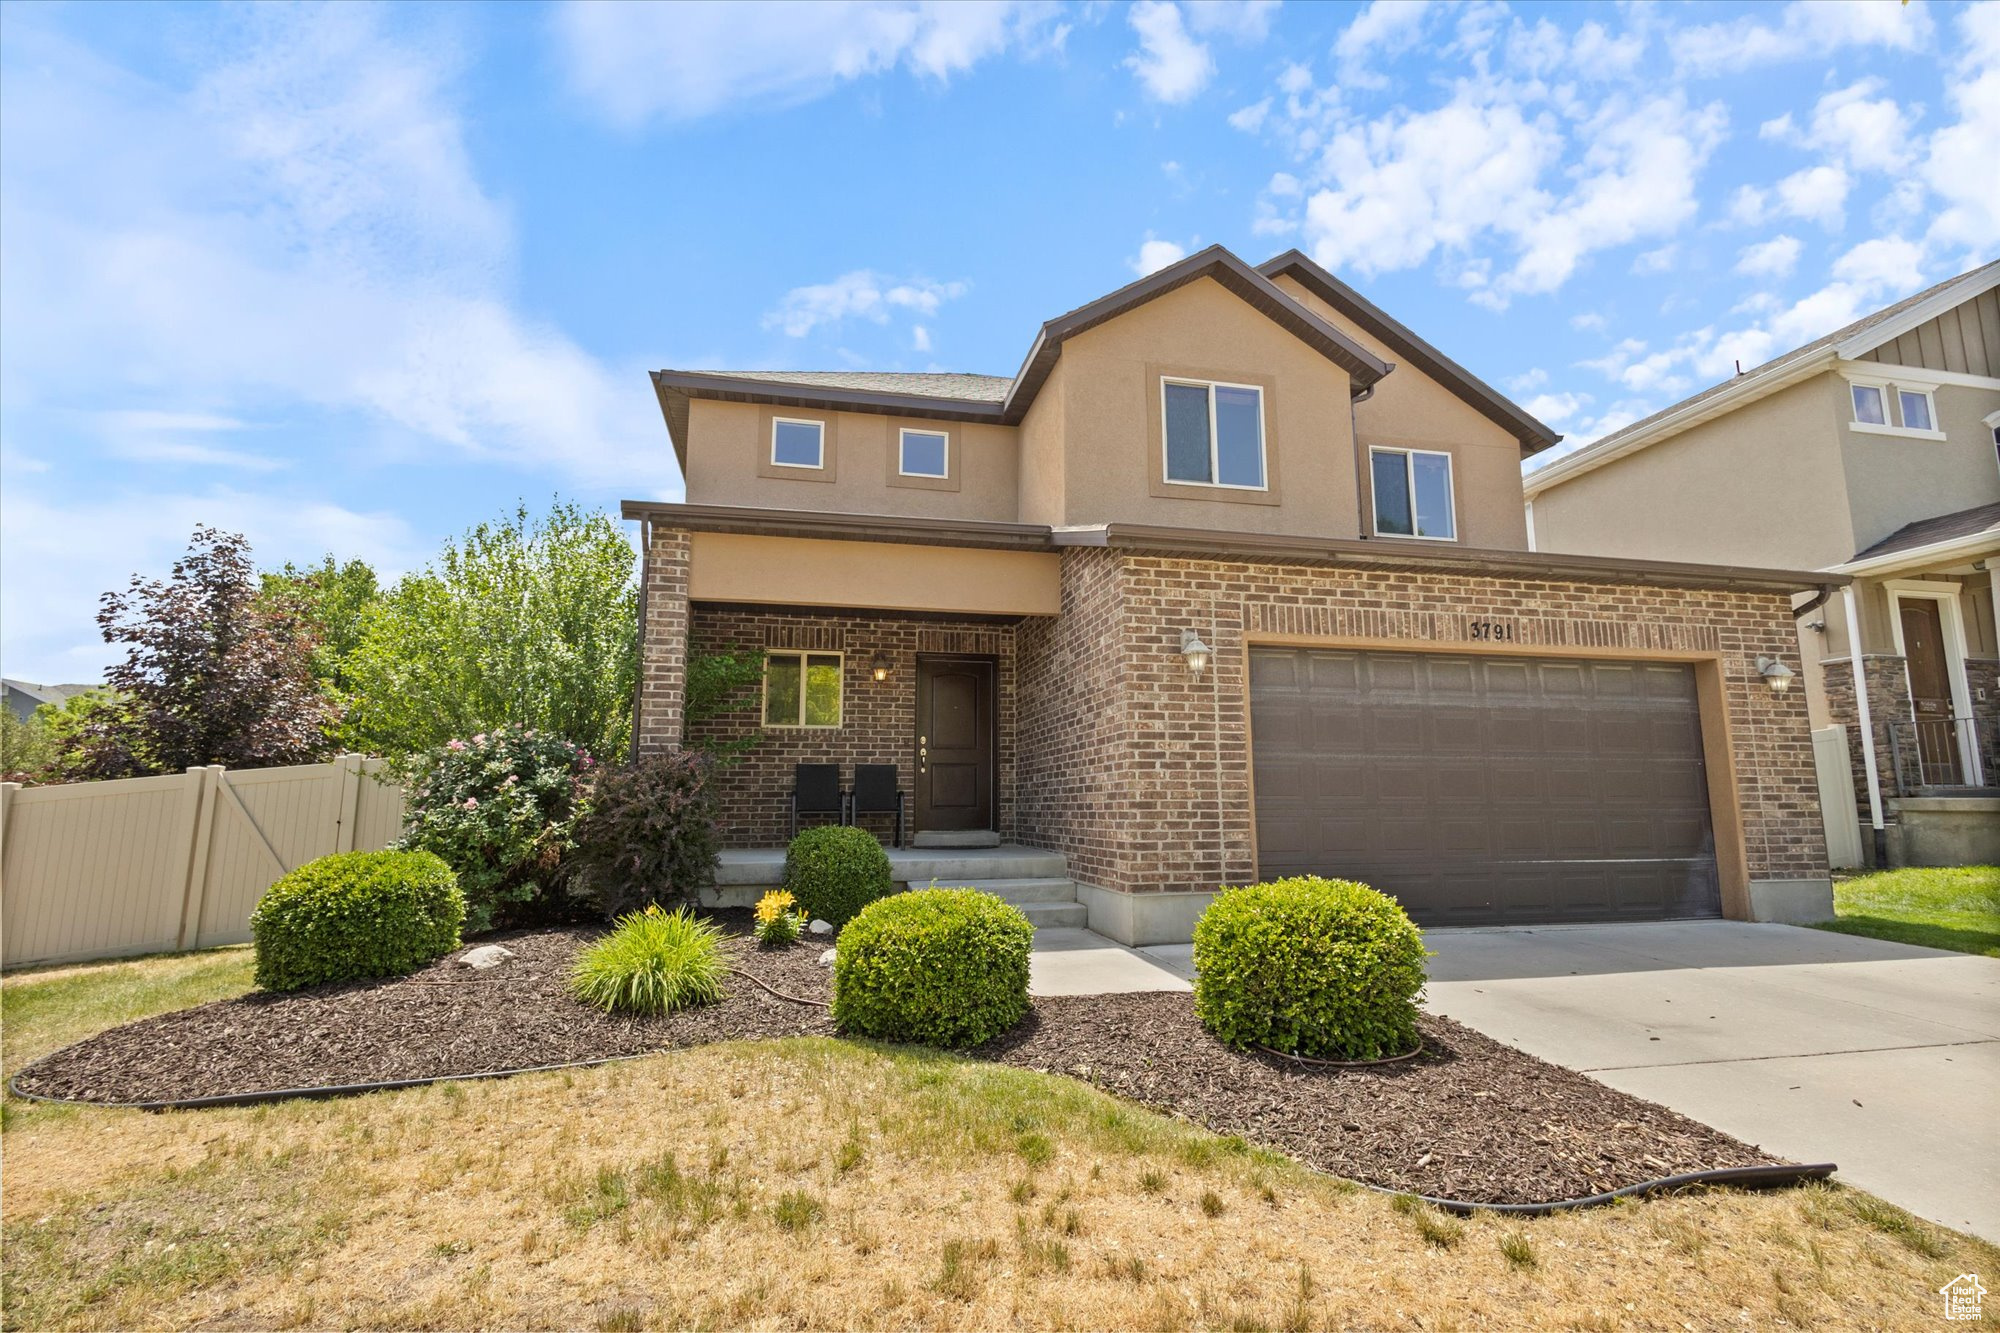
Active
$600,000
3
bds
|
4
ba
|
2,358
sqft
|
built
2009
3791 W Ivey Ranch Rd, South Jordan, UT 84009
$-1,486
Cash flow
-12.9%
Cash-on-Cash Return
3.3%
Cap rate
0.5%
Rent to Value Ratio
Active
$459,900
3
bds
|
4
ba
|
2,224
sqft
|
built
2013
4746 W South Jordan Pkwy, South Jordan, UT 84009
$-1,268
Cash flow
-14.4%
Cash-on-Cash Return
3.0%
Cap rate
0.5%
Rent to Value Ratio
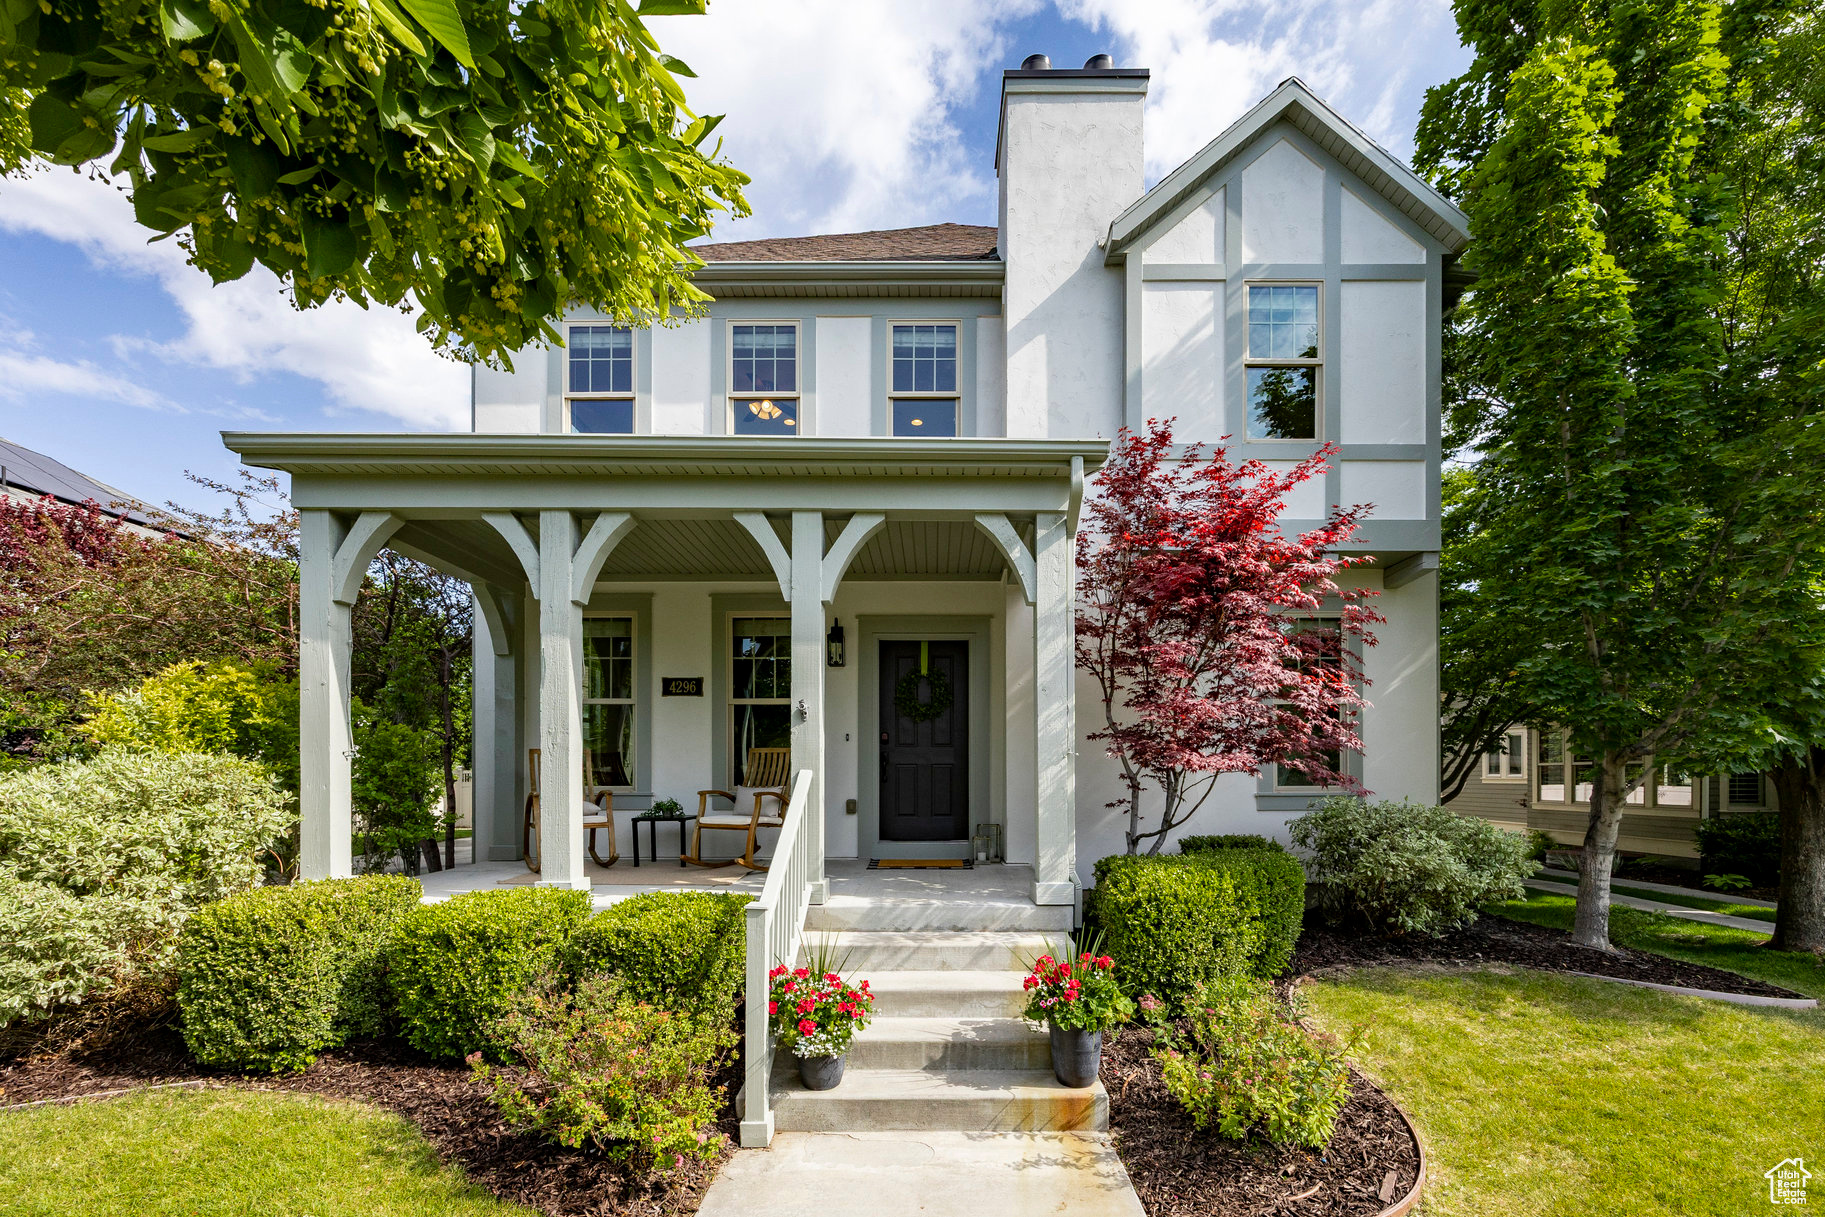
Active
$930,000
6
bds
|
4
ba
|
3,725
sqft
|
built
2009
4296 W Belleville Way, South Jordan, UT 84009
$-3,151
Cash flow
-17.7%
Cash-on-Cash Return
2.2%
Cap rate
0.3%
Rent to Value Ratio
Active
$435,000
3
bds
|
2
ba
|
1,376
sqft
|
built
2016
1712 W Naxos Ln, South Jordan, UT 84095
$-1,105
Cash flow
-13.3%
Cash-on-Cash Return
3.2%
Cap rate
0.5%
Rent to Value Ratio
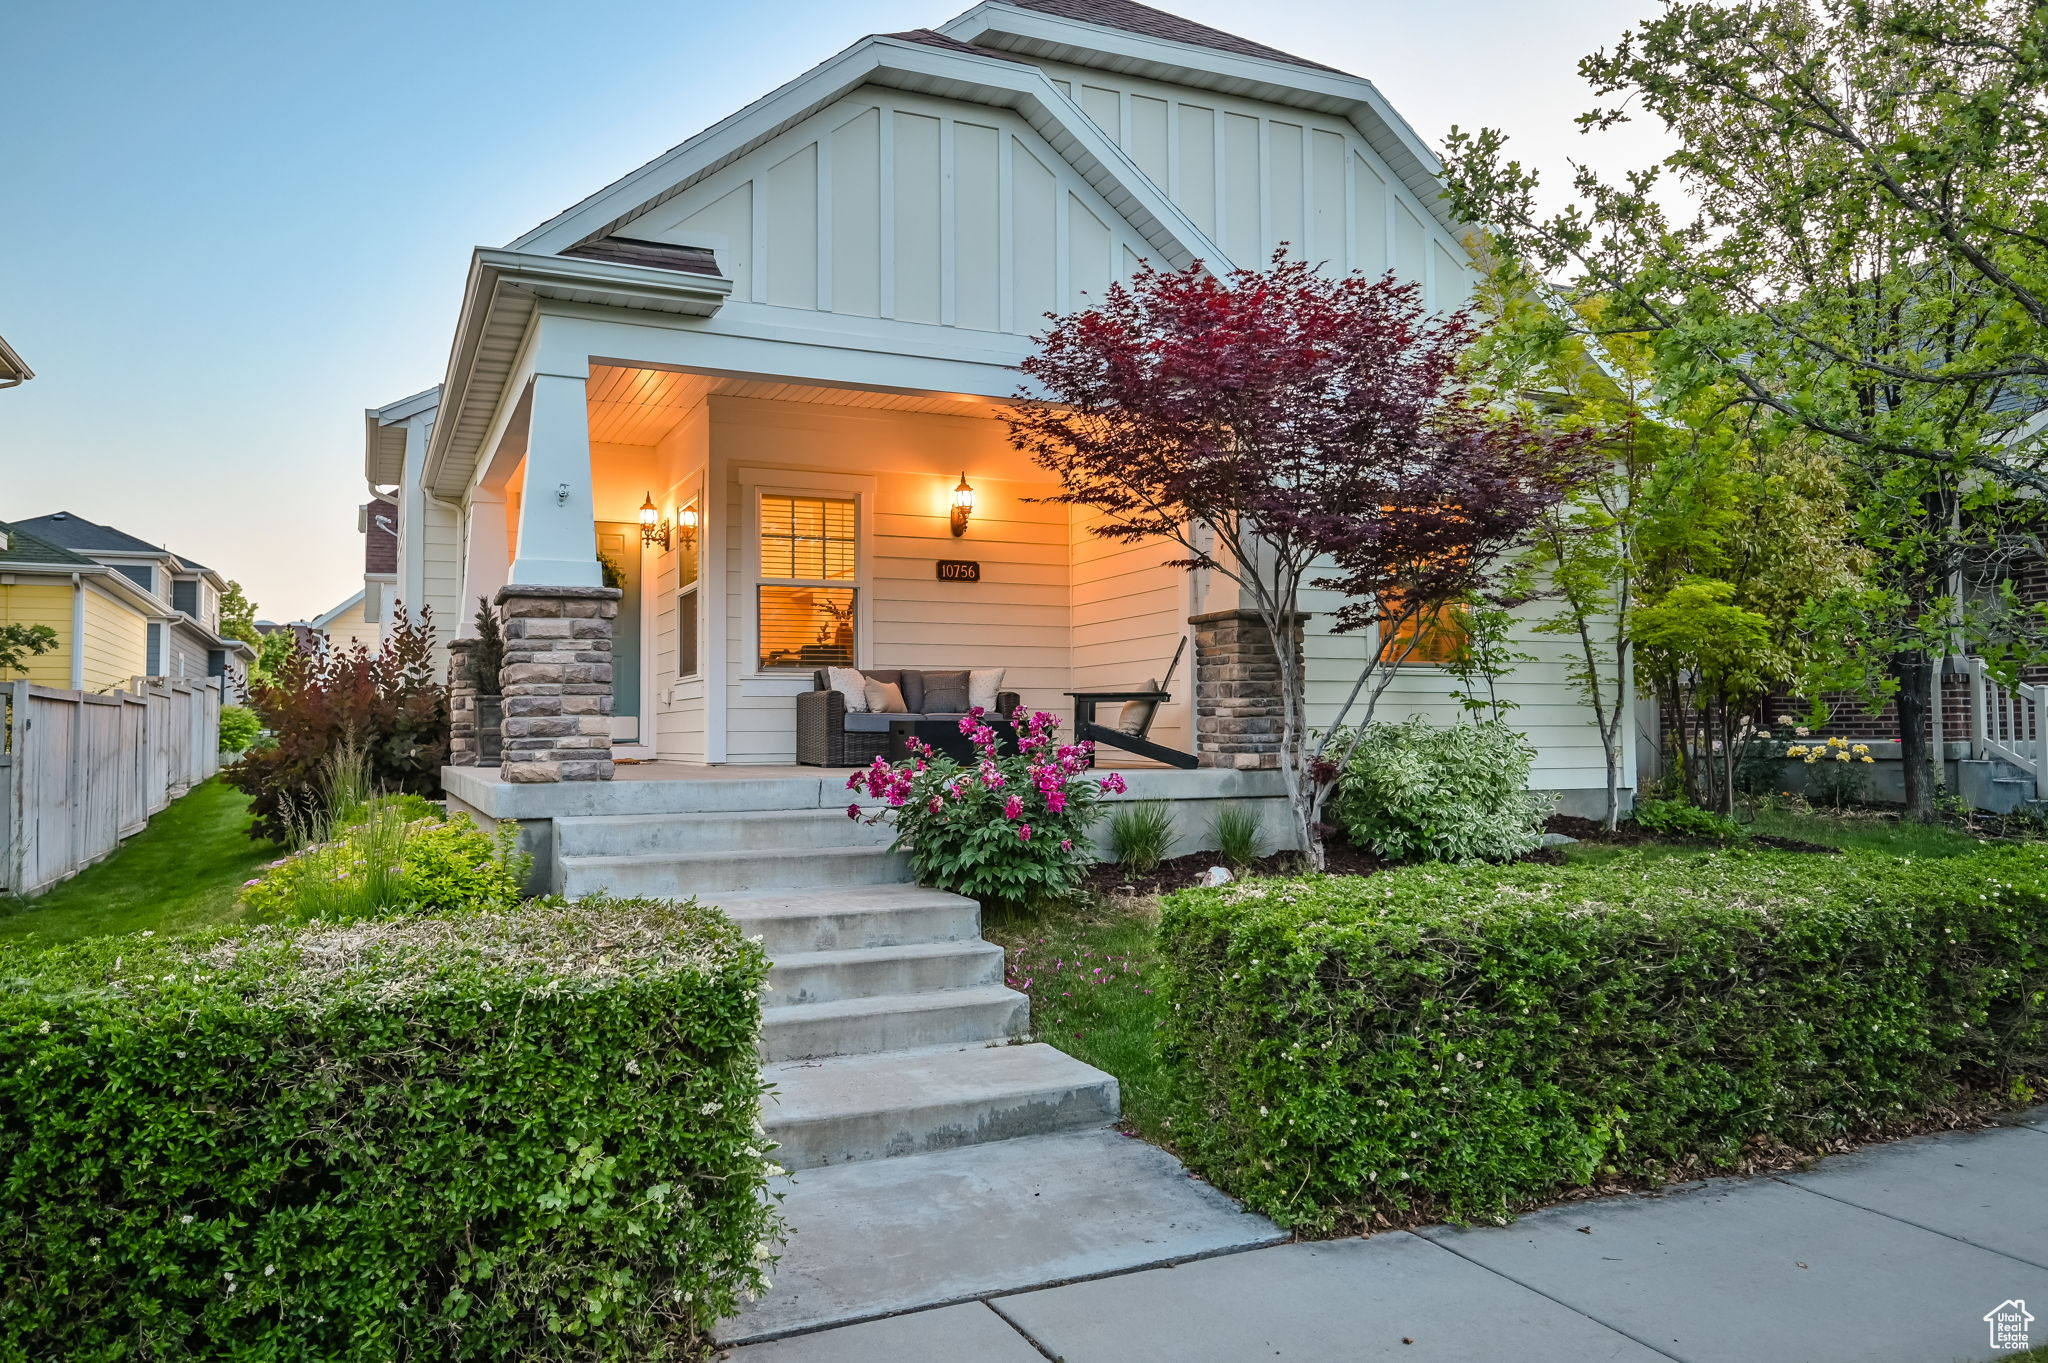
Active
$665,000
4
bds
|
3
ba
|
3,050
sqft
|
built
2008
10756 S Navarro Way, South Jordan, UT 84009
$-1,227
Cash flow
-9.6%
Cash-on-Cash Return
4.1%
Cap rate
0.6%
Rent to Value Ratio
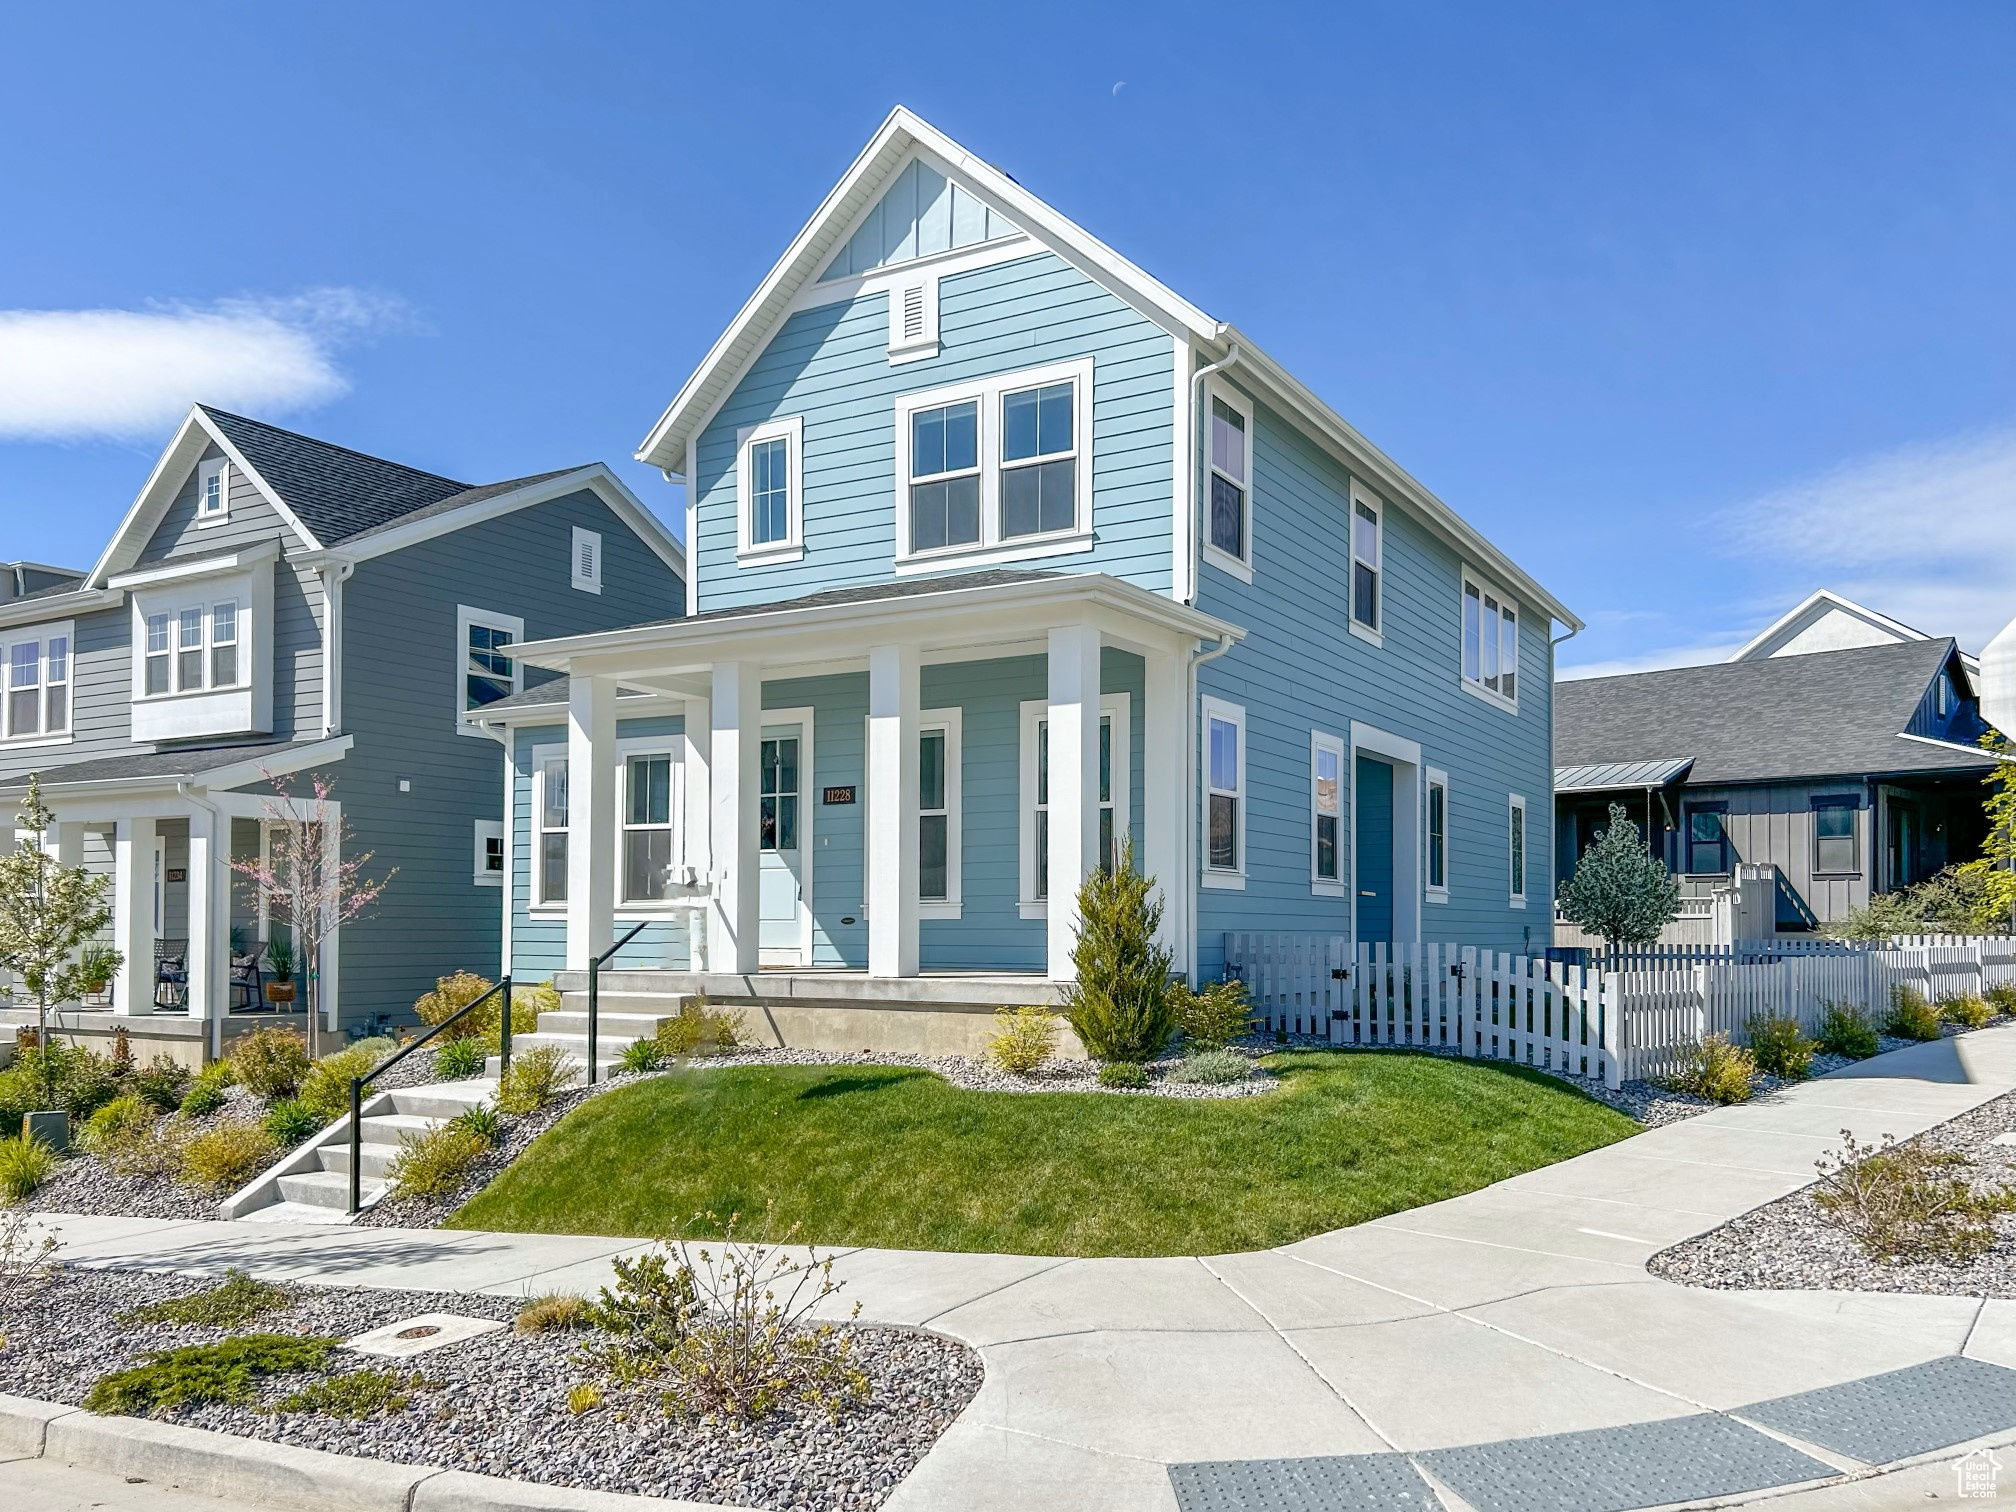
Active
$745,000
4
bds
|
4
ba
|
3,039
sqft
|
built
2022
11228 S Old Bridge Rd, South Jordan, UT 84009
$-1,895
Cash flow
-13.3%
Cash-on-Cash Return
3.2%
Cap rate
0.5%
Rent to Value Ratio
Active
$440,000
3
bds
|
3
ba
|
1,568
sqft
|
built
2001
3878 W Sage Willow Dr, South Jordan, UT 84009
$-1,382
Cash flow
-16.4%
Cash-on-Cash Return
2.5%
Cap rate
0.4%
Rent to Value Ratio
Active
$1,125,000
6
bds
|
3
ba
|
4,813
sqft
|
built
1990
1262 W Dusty Downs Cir, South Jordan, UT 84095
$-3,170
Cash flow
-14.7%
Cash-on-Cash Return
2.9%
Cap rate
0.4%
Rent to Value Ratio
Active
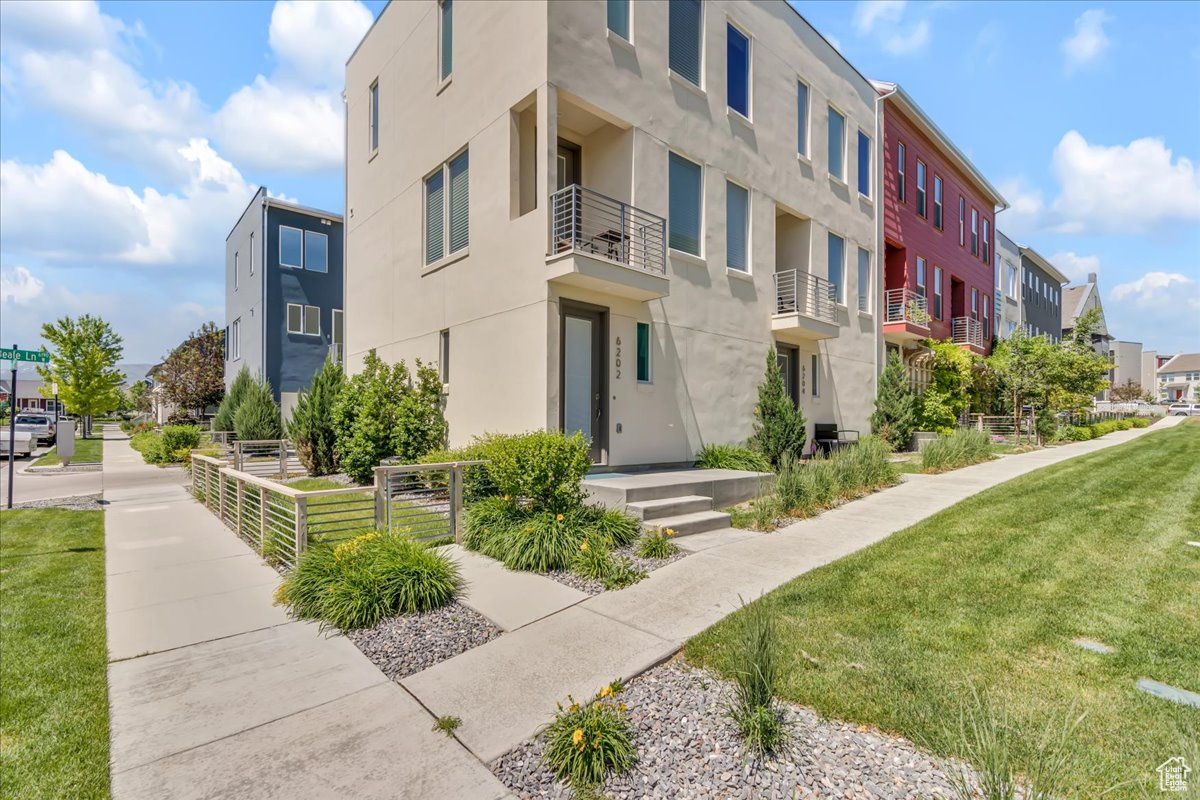
$419,000
2
bds
|
3
ba
|
1,233
sqft
|
built
2018
6202 W Birch Run Rd, South Jordan, UT 84009
$-1,317
Cash flow
-16.4%
Cash-on-Cash Return
2.5%
Cap rate
0.5%
Rent to Value Ratio
Active
$800,000
6
bds
|
4
ba
|
3,740
sqft
|
built
1974
10453 S 2775 W, South Jordan, UT 84095
$-2,075
Cash flow
-13.5%
Cash-on-Cash Return
3.2%
Cap rate
0.4%
Rent to Value Ratio
Active
$395,000
3
bds
|
2
ba
|
1,373
sqft
|
built
2019
4566 W Harvest Sun Ln, South Jordan, UT 84009
$-798
Cash flow
-10.5%
Cash-on-Cash Return
3.9%
Cap rate
0.6%
Rent to Value Ratio
Active
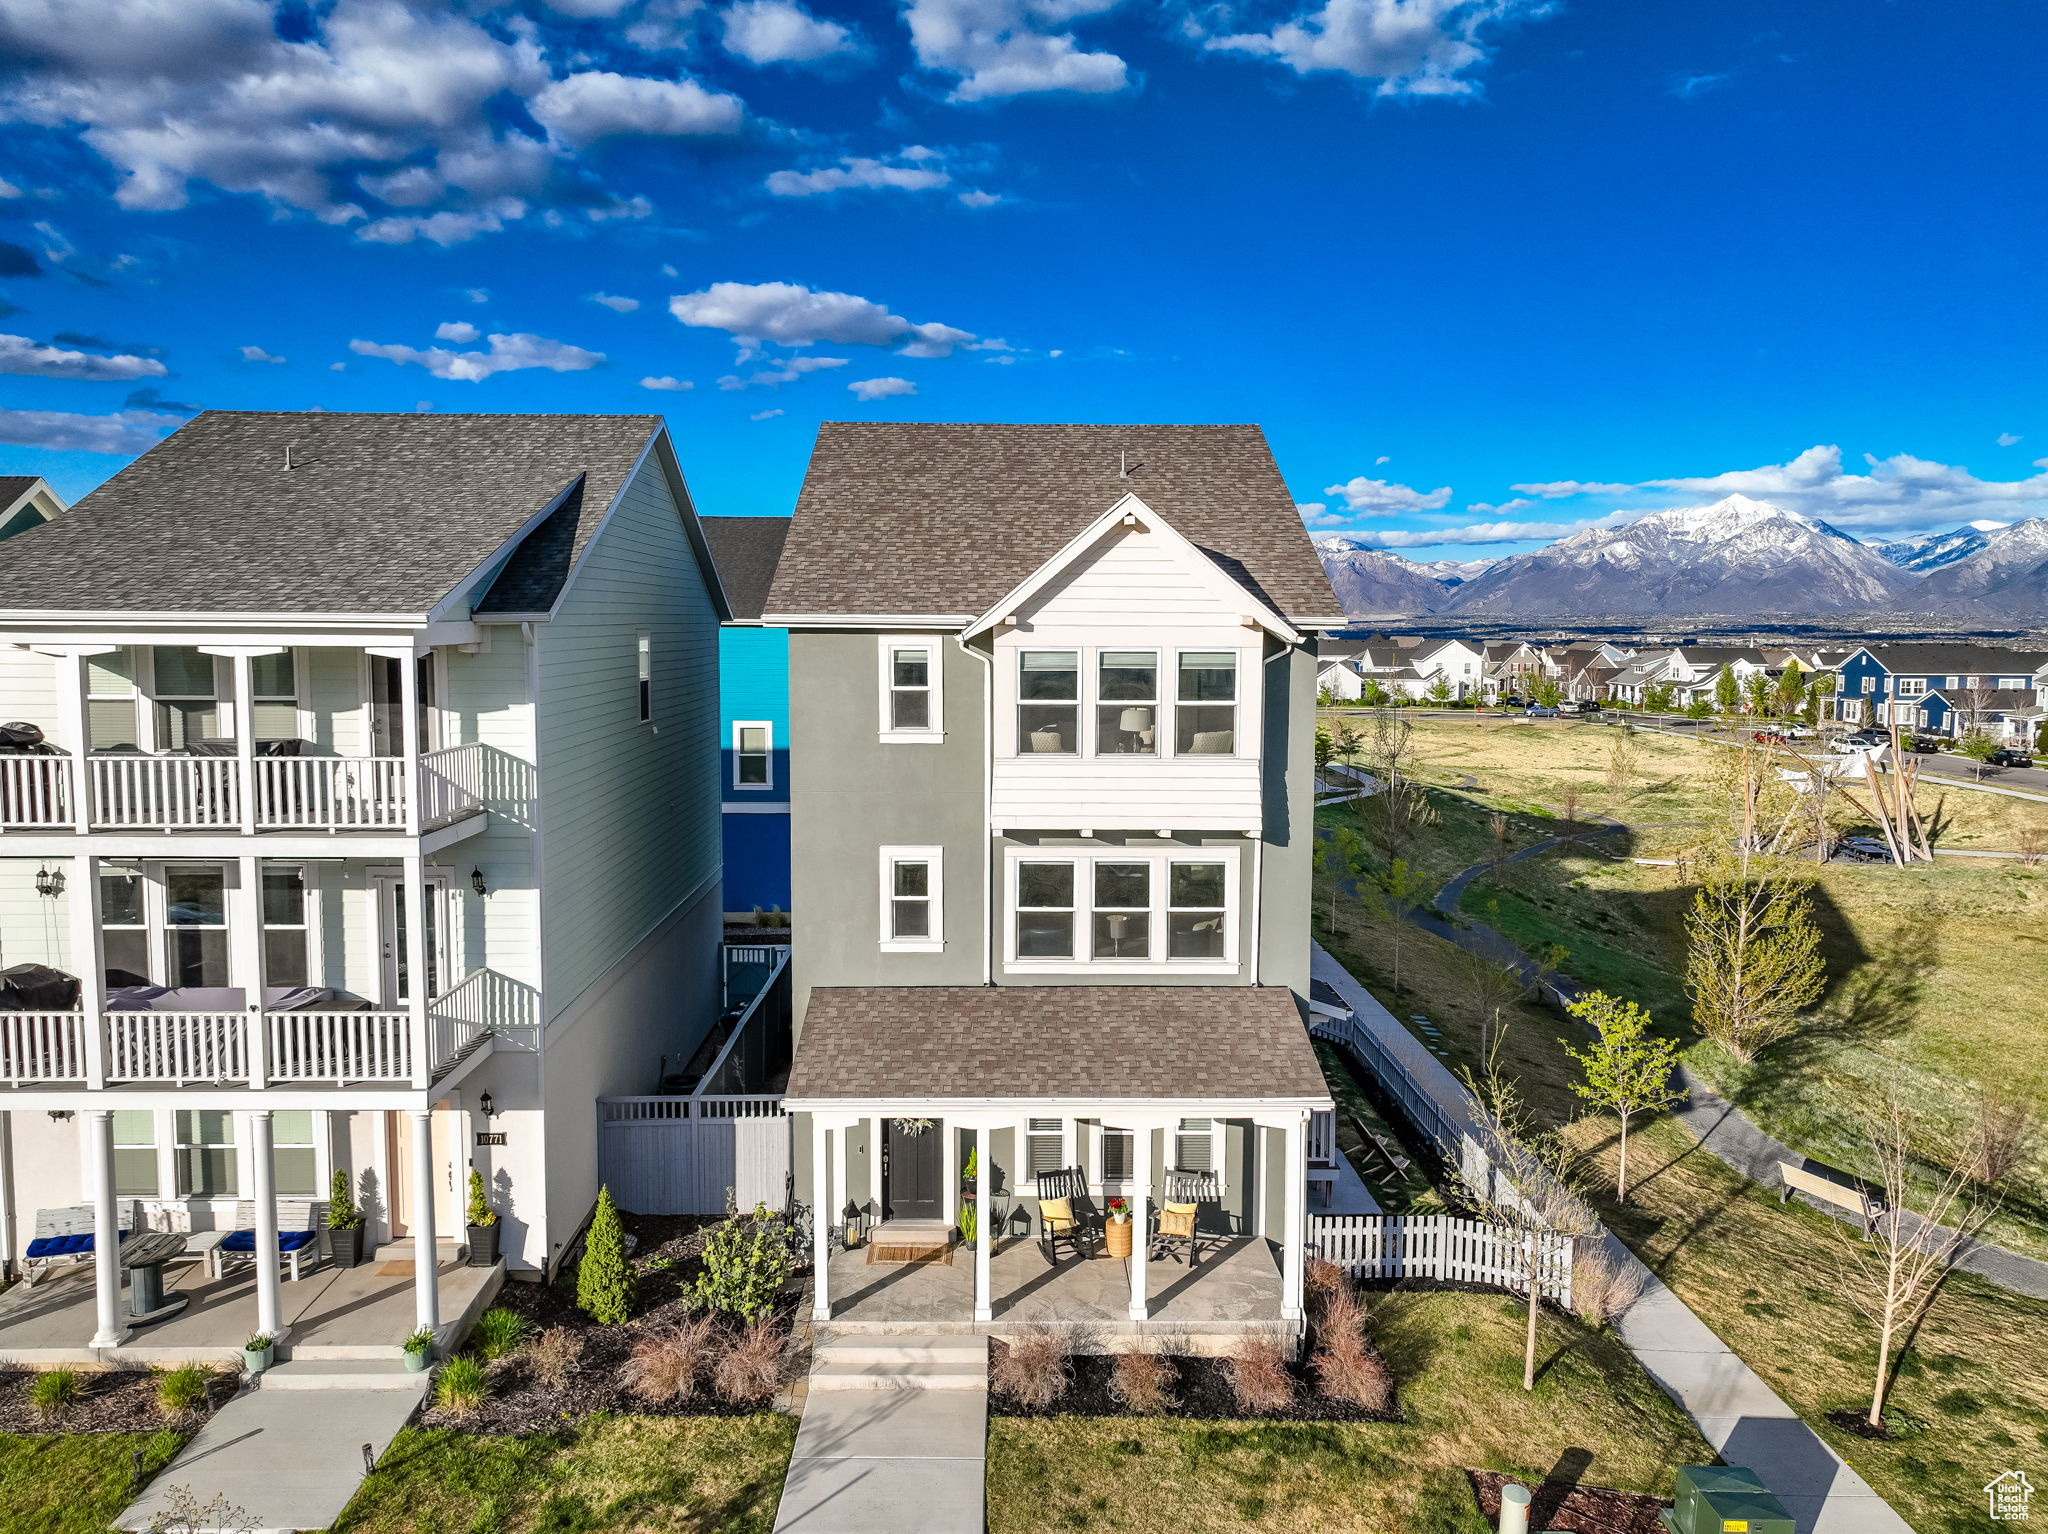
$695,000
3
bds
|
3
ba
|
2,976
sqft
|
built
2021
10777 S Lamond Dr, South Jordan, UT 84009
$-2,135
Cash flow
-16.0%
Cash-on-Cash Return
2.6%
Cap rate
0.4%
Rent to Value Ratio
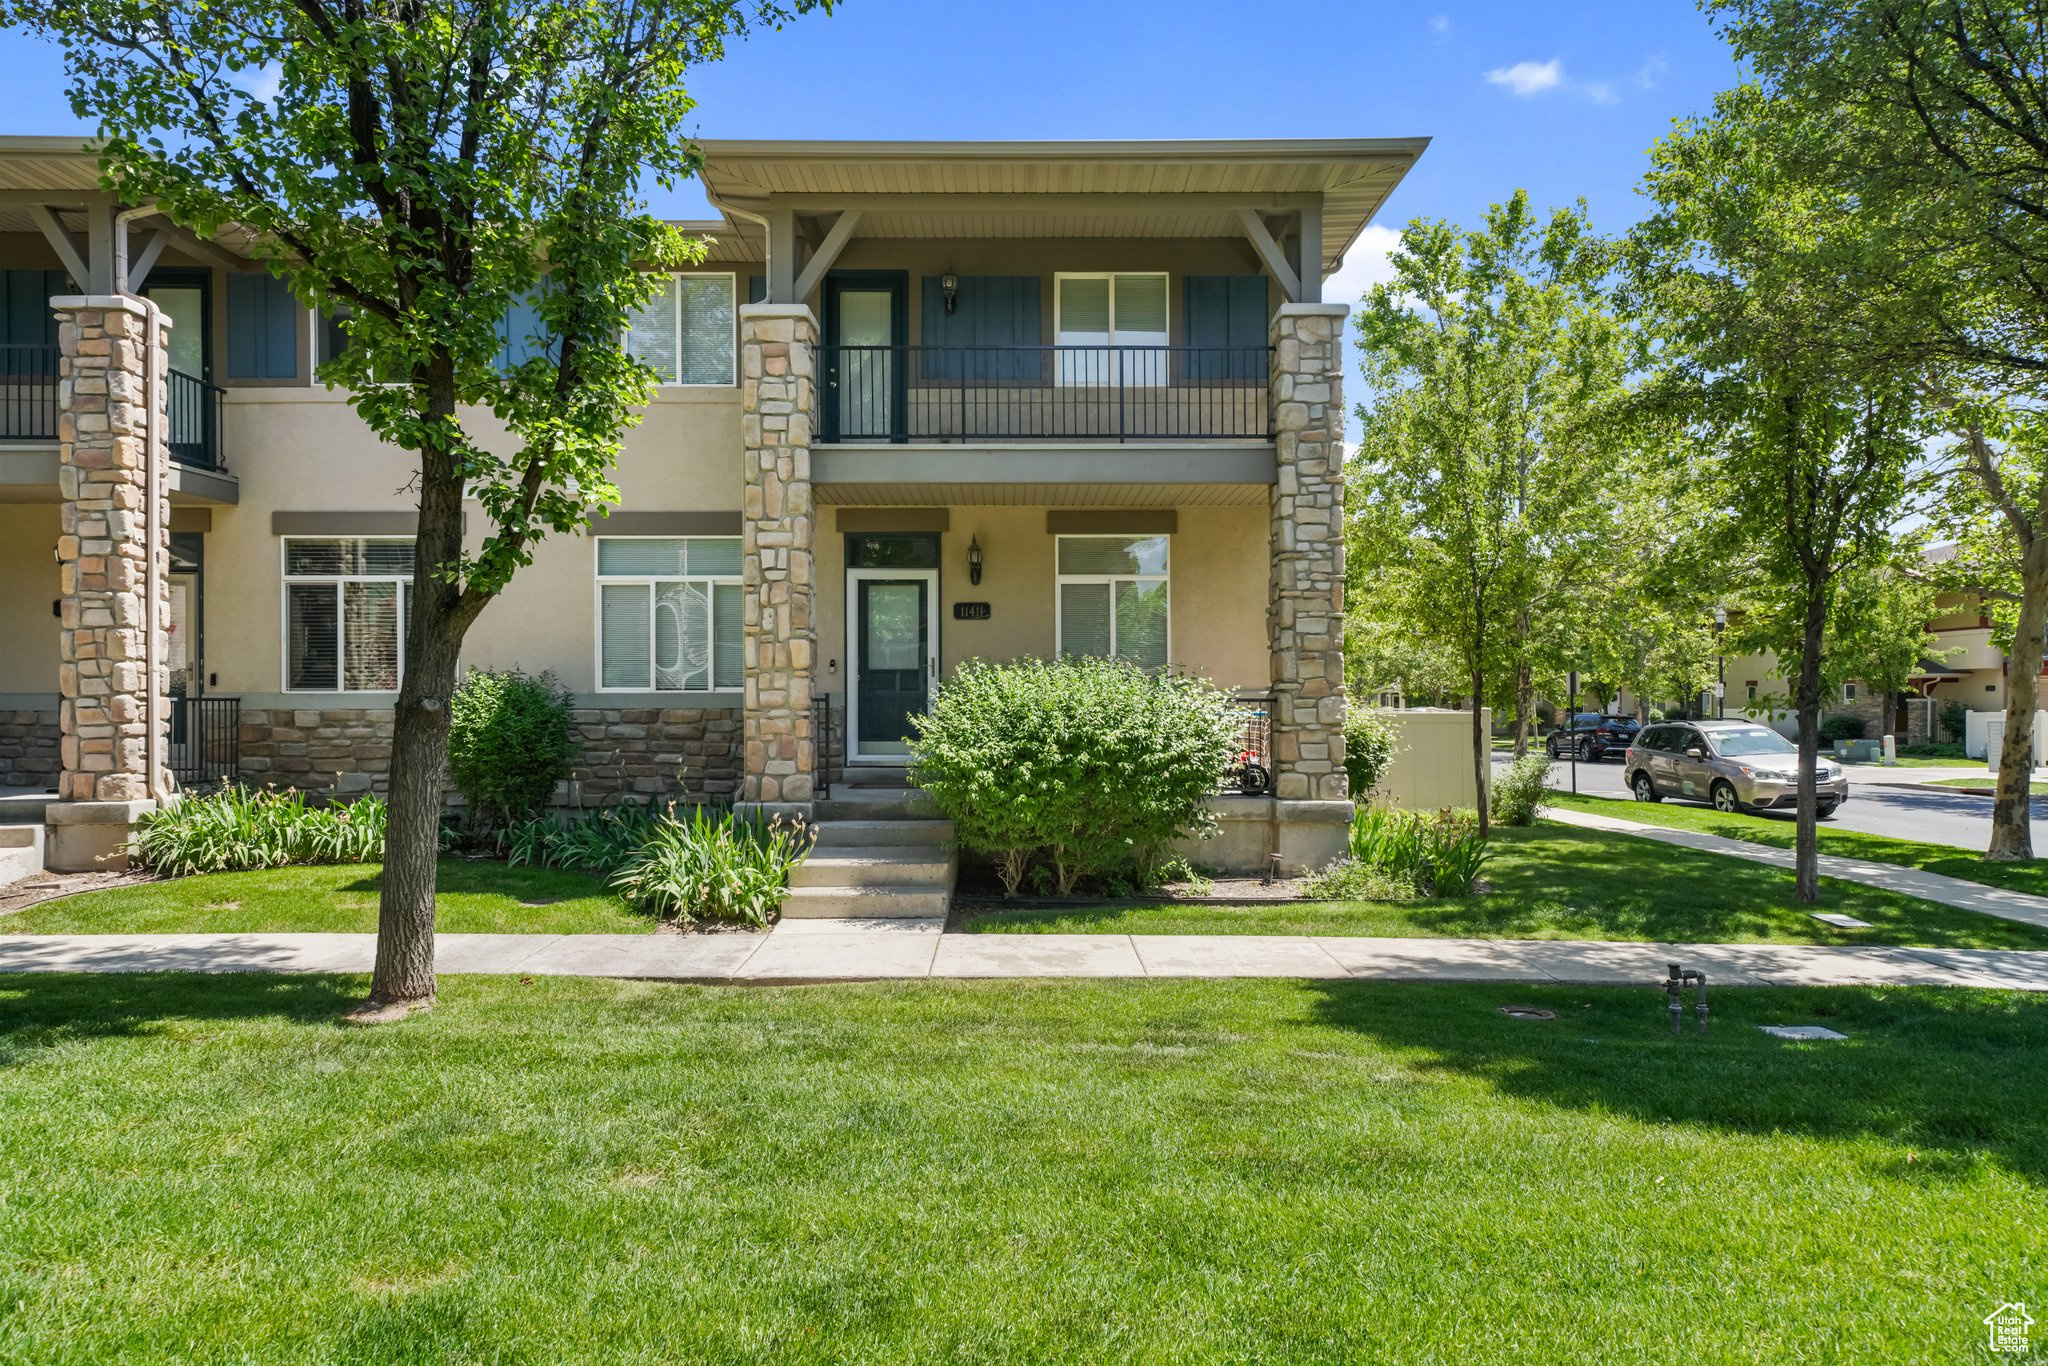
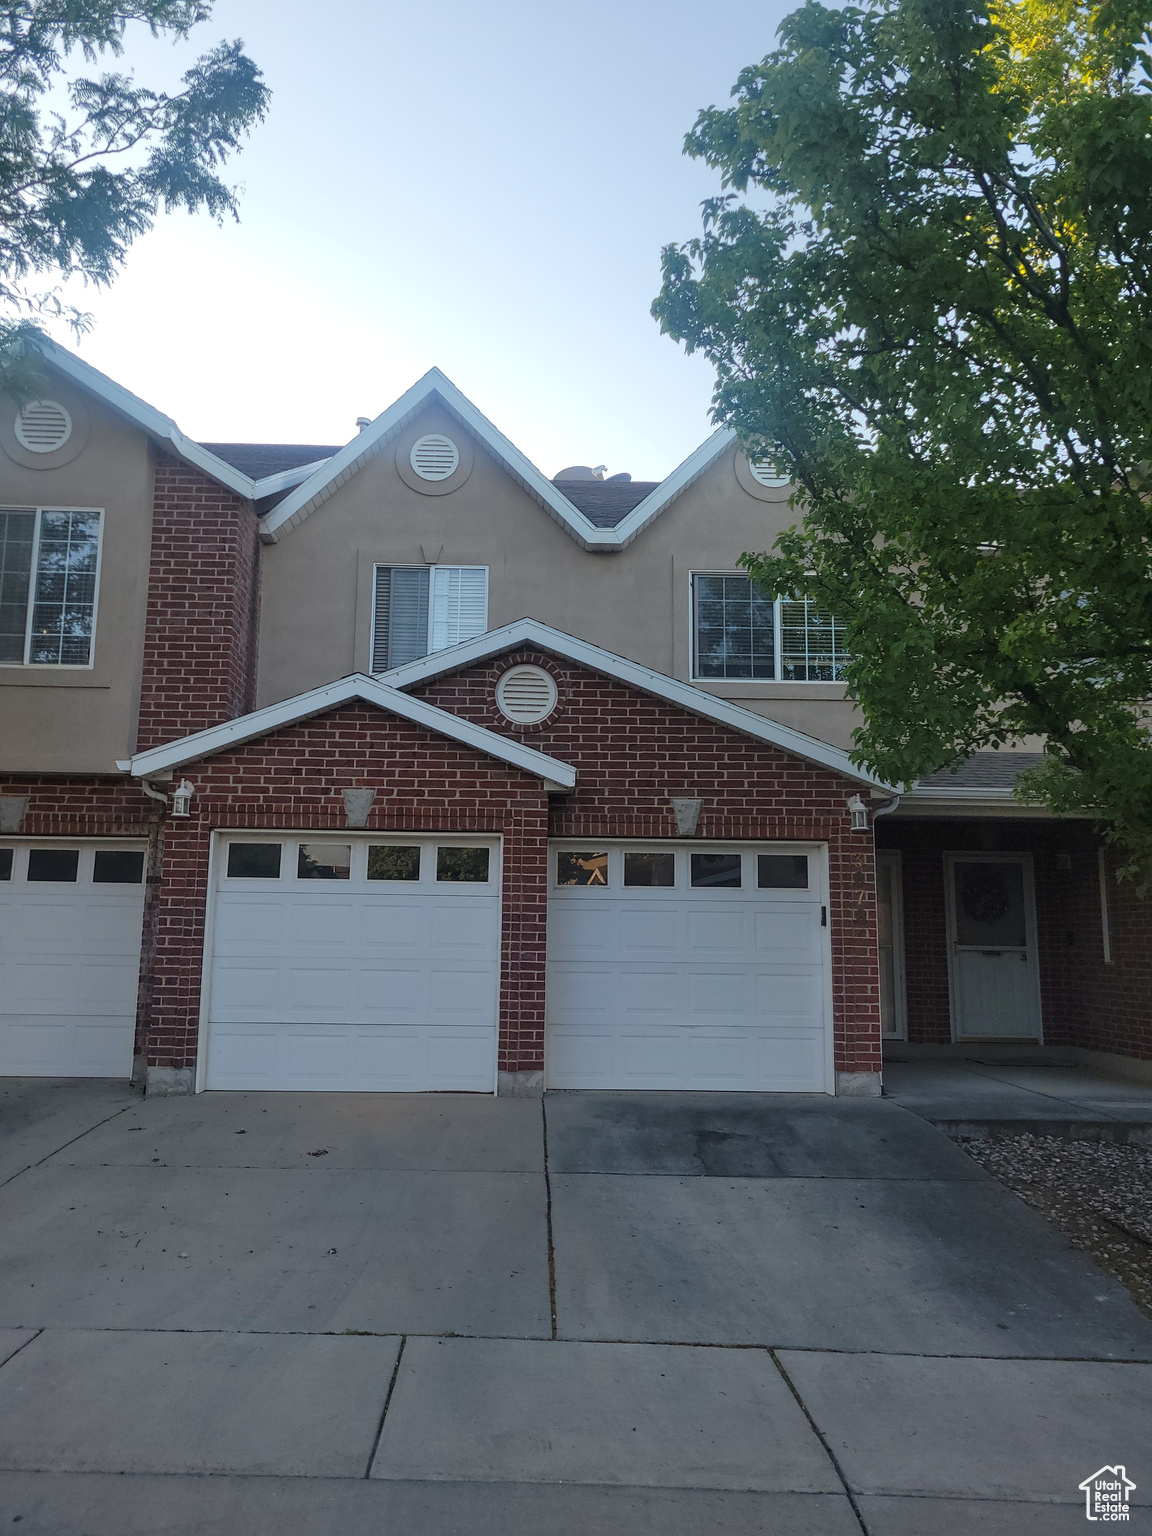
Active
$450,000
3
bds
|
4
ba
|
2,160
sqft
|
built
2006
11411 S Oakmond Rd, South Jordan, UT 84009
$-1,125
Cash flow
-13.0%
Cash-on-Cash Return
3.3%
Cap rate
0.6%
Rent to Value Ratio
Active
$680,000
6
bds
|
4
ba
|
3,330
sqft
|
built
2006
11569 S Oakmond Rd, South Jordan, UT 84009
$-1,936
Cash flow
-14.9%
Cash-on-Cash Return
2.9%
Cap rate
0.4%
Rent to Value Ratio
Active
$925,000
6
bds
|
4
ba
|
4,332
sqft
|
built
1994
3356 W Star Fire Rd, South Jordan, UT 84095
$-2,066
Cash flow
-11.7%
Cash-on-Cash Return
3.6%
Cap rate
0.5%
Rent to Value Ratio
Active
$1,050,000
5
bds
|
4
ba
|
5,104
sqft
|
built
2004
4554 W Birdie Way, South Jordan, UT 84009
$-1,996
Cash flow
-9.9%
Cash-on-Cash Return
4.0%
Cap rate
0.5%
Rent to Value Ratio
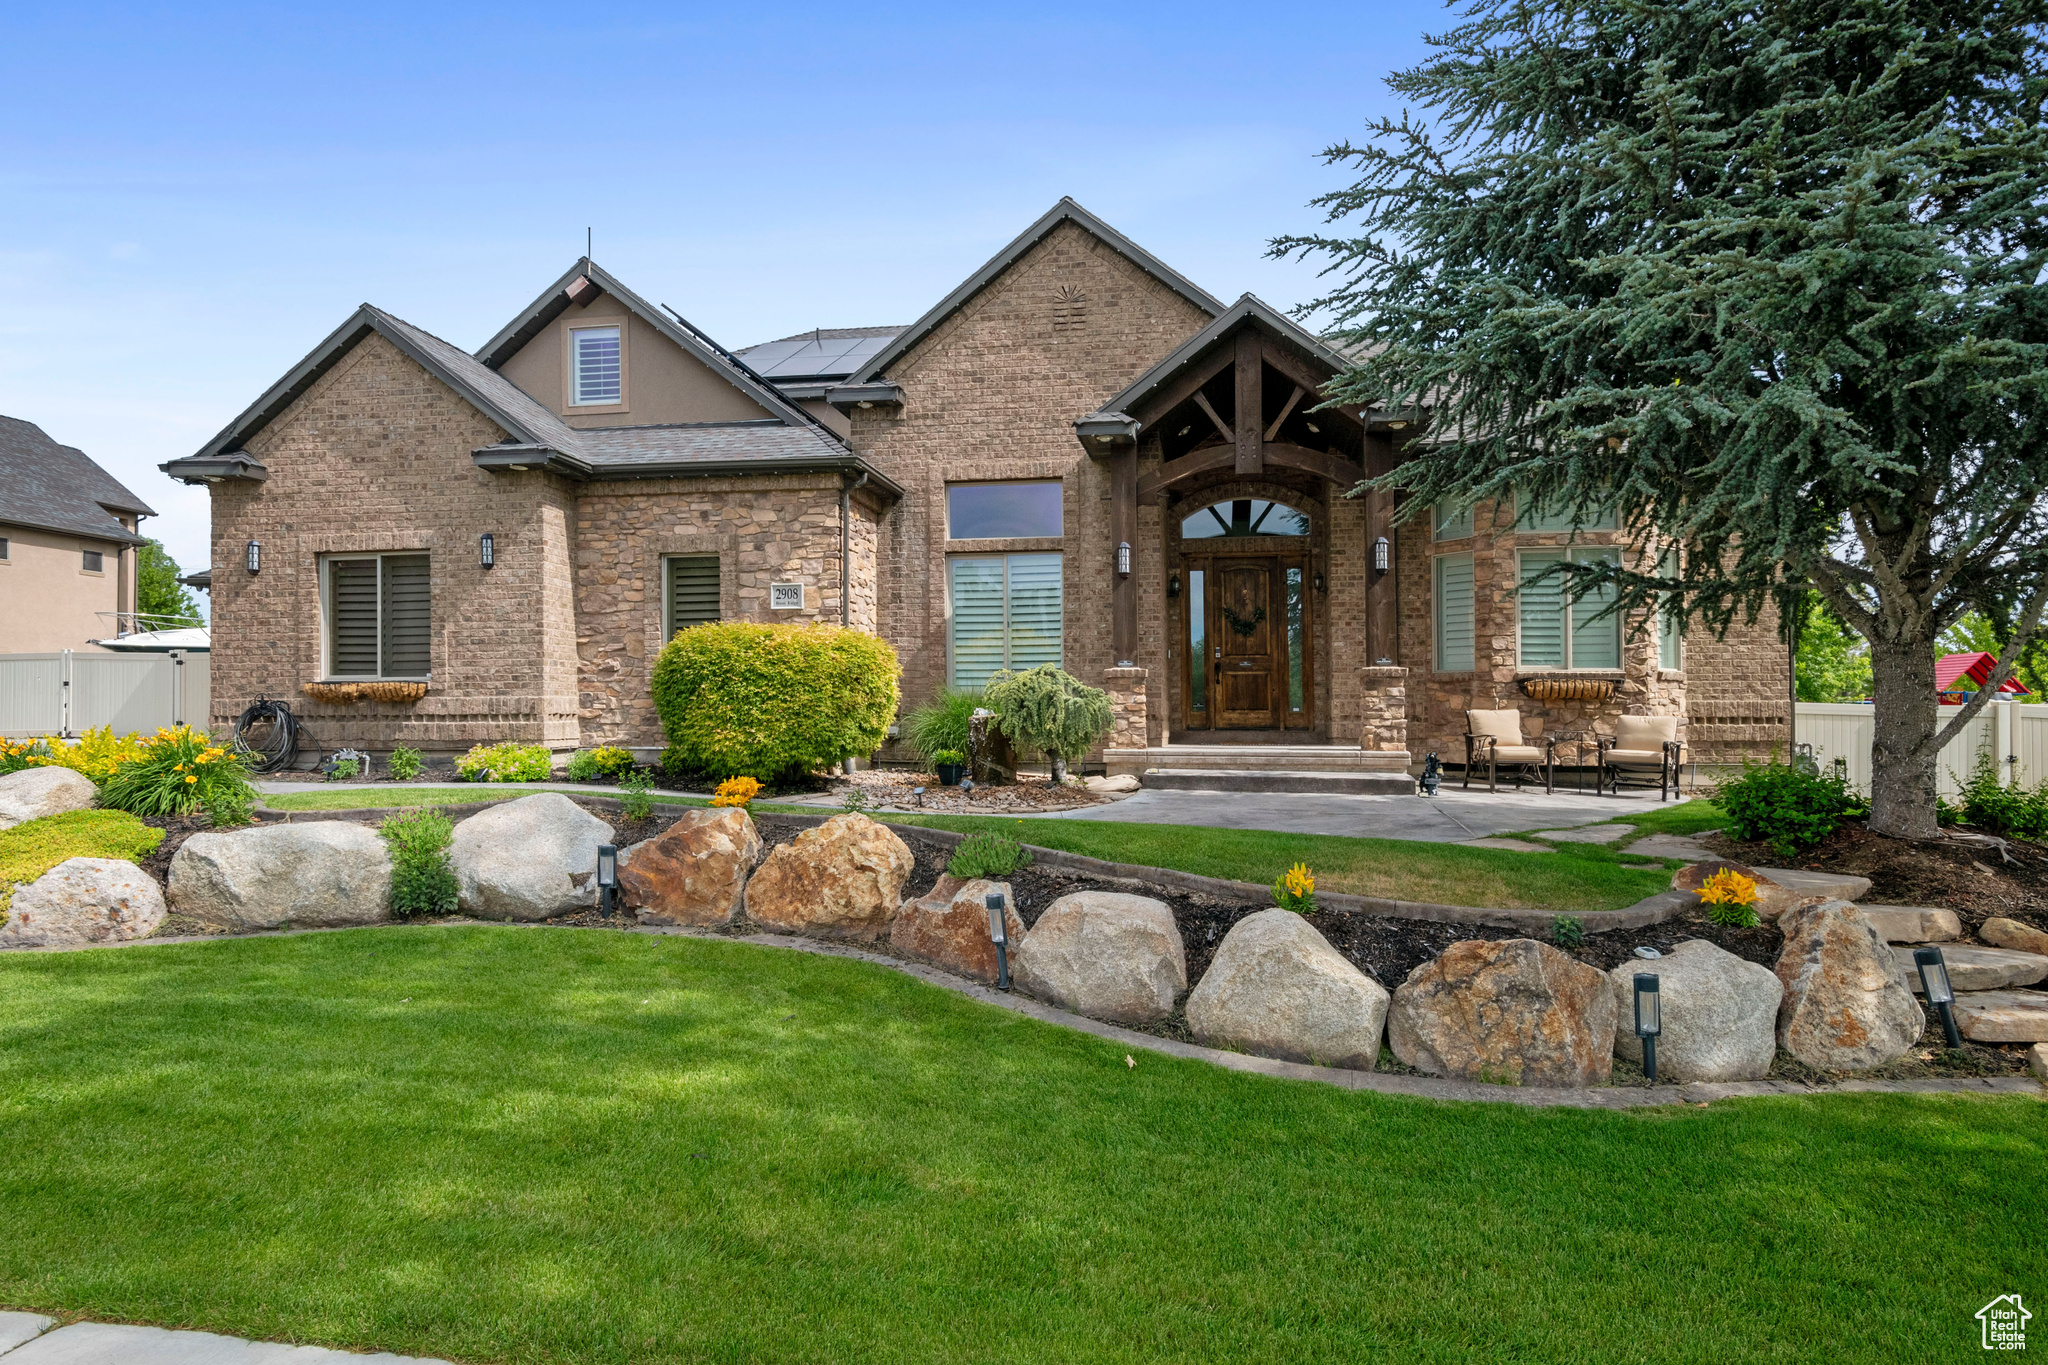
Active
$1,499,999
6
bds
|
6
ba
|
6,487
sqft
|
built
2007
2908 W Bison Ridge Rd, South Jordan, UT 84095
$-4,180
Cash flow
-14.5%
Cash-on-Cash Return
2.9%
Cap rate
0.4%
Rent to Value Ratio
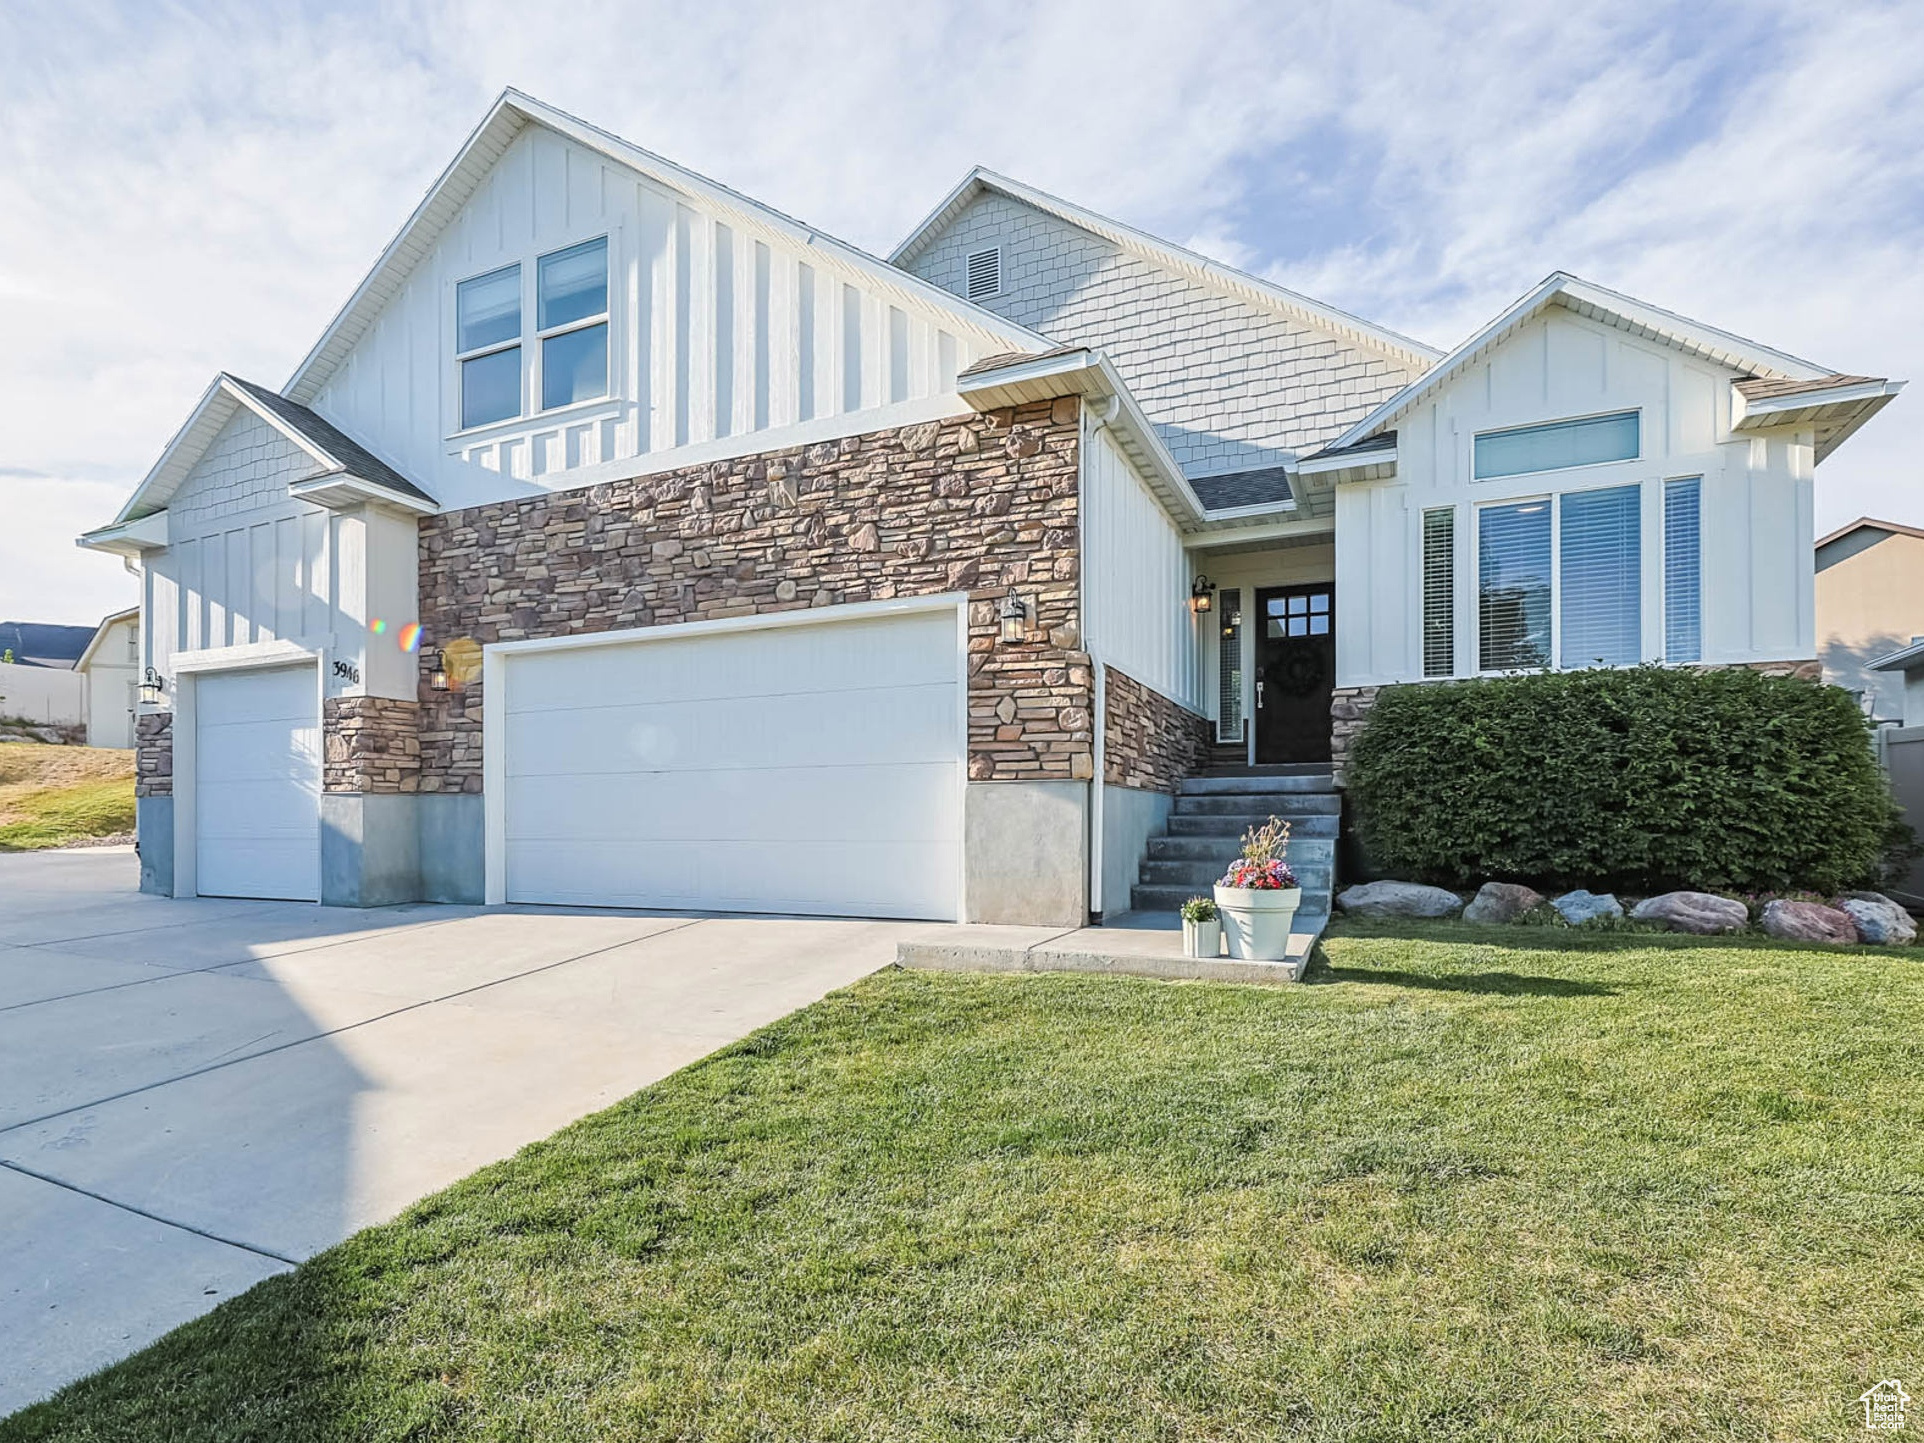
Active
$849,000
6
bds
|
4
ba
|
3,593
sqft
|
built
2011
3946 W Birmingham Cir, South Jordan, UT 84009
$-2,862
Cash flow
-17.6%
Cash-on-Cash Return
2.2%
Cap rate
0.3%
Rent to Value Ratio
Active
$449,900
3
bds
|
2
ba
|
1,415
sqft
|
built
2015
9681 S Zakro Ln, South Jordan, UT 84095
$-1,114
Cash flow
-12.9%
Cash-on-Cash Return
3.3%
Cap rate
0.5%
Rent to Value Ratio
Active
$1,050,000
6
bds
|
4
ba
|
4,518
sqft
|
built
2022
11579 S Pebble Pond Rd, South Jordan, UT 84009
$-3,897
Cash flow
-19.4%
Cash-on-Cash Return
1.8%
Cap rate
0.3%
Rent to Value Ratio
Pending
$3,195,000
5
bds
|
9
ba
|
9,160
sqft
|
built
2023
11527 S River Front Pkwy, South Jordan, UT 84095
$-14,407
Cash flow
-23.5%
Cash-on-Cash Return
0.9%
Cap rate
0.1%
Rent to Value Ratio
Active
$989,900
4
bds
|
4
ba
|
2,818
sqft
|
built
2024
11436 S Watercourse Rd, South Jordan, UT 84009
$-2,365
Cash flow
-12.5%
Cash-on-Cash Return
3.4%
Cap rate
0.4%
Rent to Value Ratio
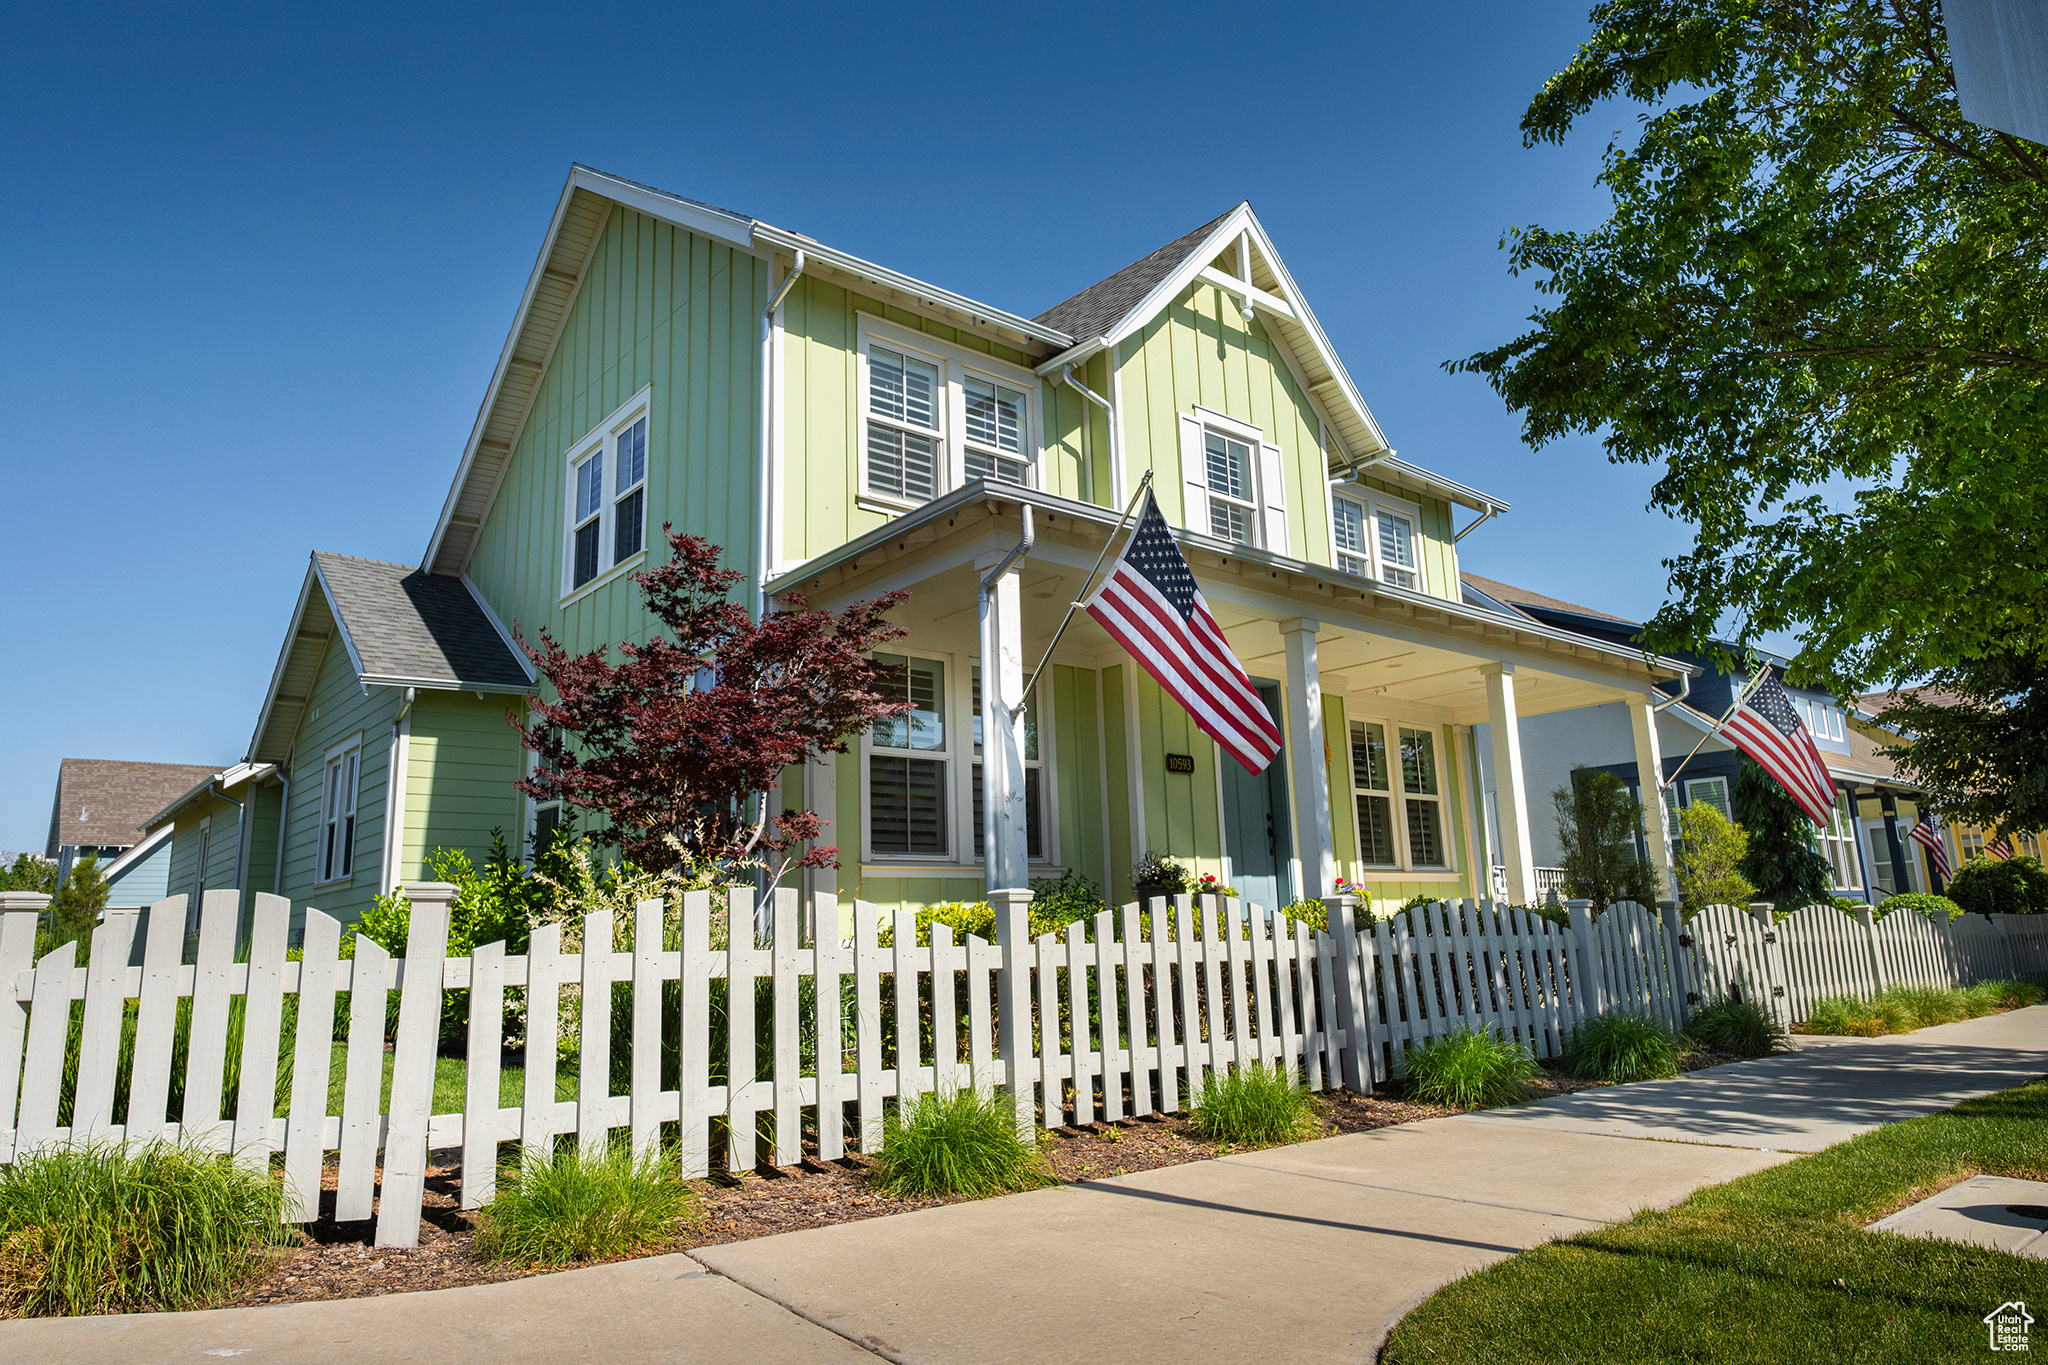
Active
$895,000
5
bds
|
4
ba
|
3,828
sqft
|
built
2017
10593 S Wistful Way, South Jordan, UT 84009
$-3,314
Cash flow
-19.3%
Cash-on-Cash Return
1.8%
Cap rate
0.3%
Rent to Value Ratio
Active
$725,000
4
bds
|
4
ba
|
2,690
sqft
|
built
2019
5206 W Mellow Way, South Jordan, UT 84009
$-2,024
Cash flow
-14.6%
Cash-on-Cash Return
2.9%
Cap rate
0.4%
Rent to Value Ratio
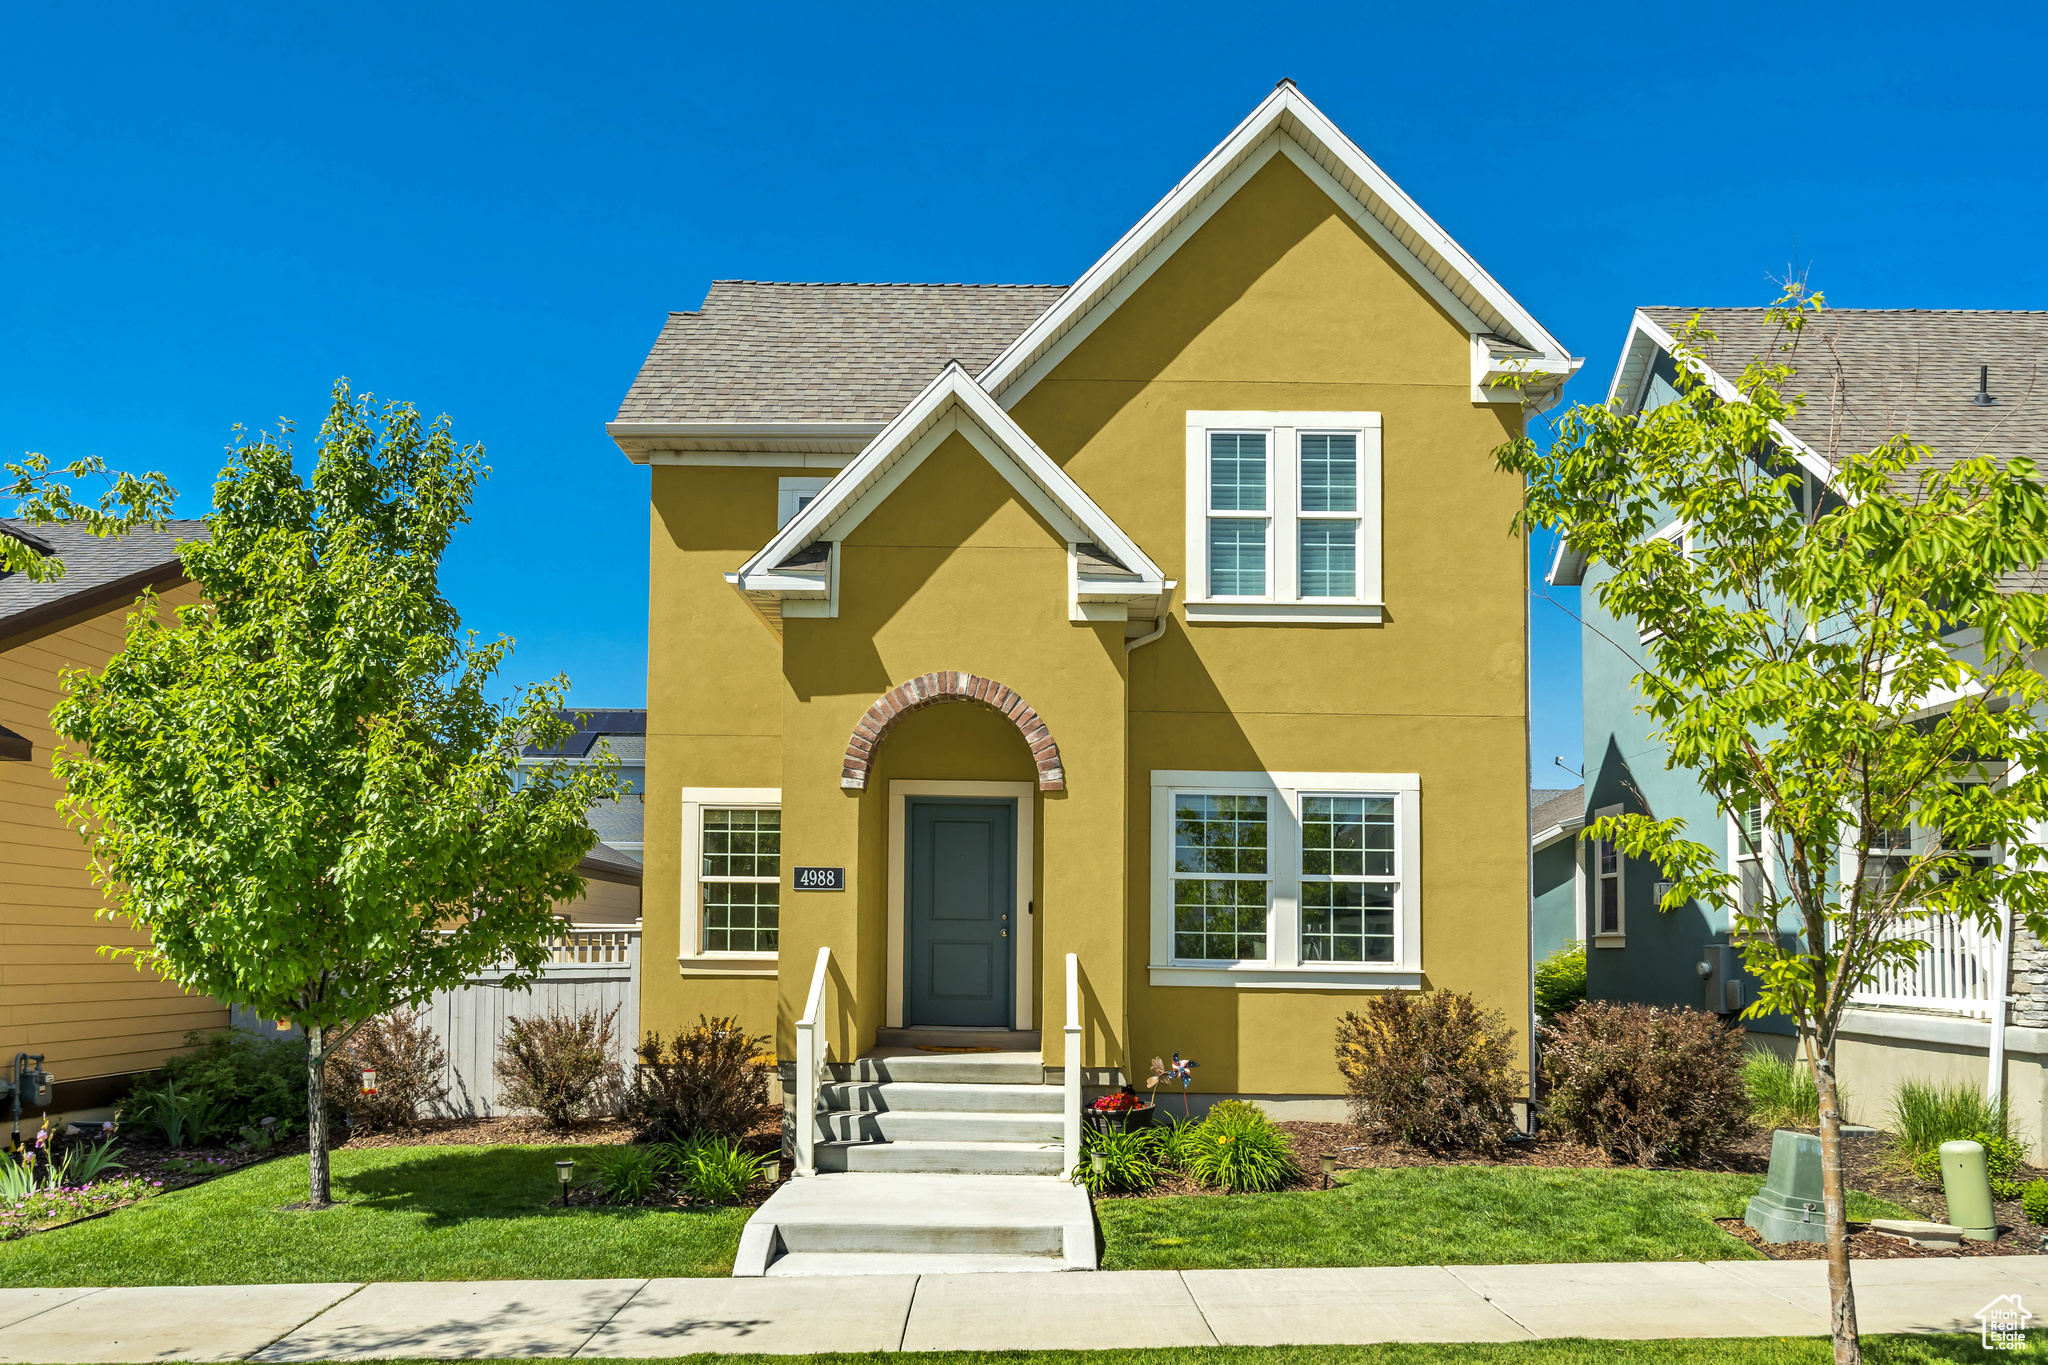
Active
$600,000
4
bds
|
4
ba
|
2,157
sqft
|
built
2017
4988 W Mellow Way, South Jordan, UT 84009
$-1,986
Cash flow
-17.3%
Cash-on-Cash Return
2.3%
Cap rate
0.4%
Rent to Value Ratio
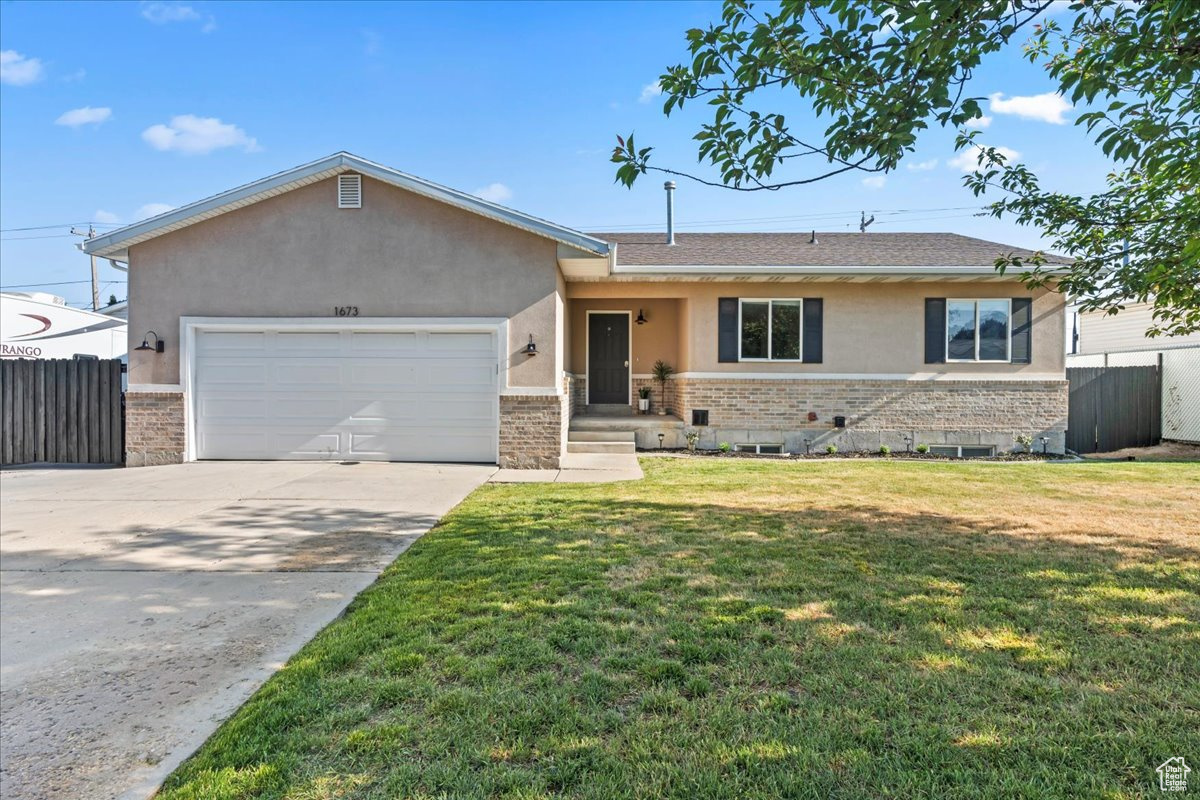
Active
$680,000
5
bds
|
2
ba
|
2,731
sqft
|
built
1996
1673 W 9775 S, South Jordan, UT 84095
$-1,699
Cash flow
-13.0%
Cash-on-Cash Return
3.3%
Cap rate
0.5%
Rent to Value Ratio
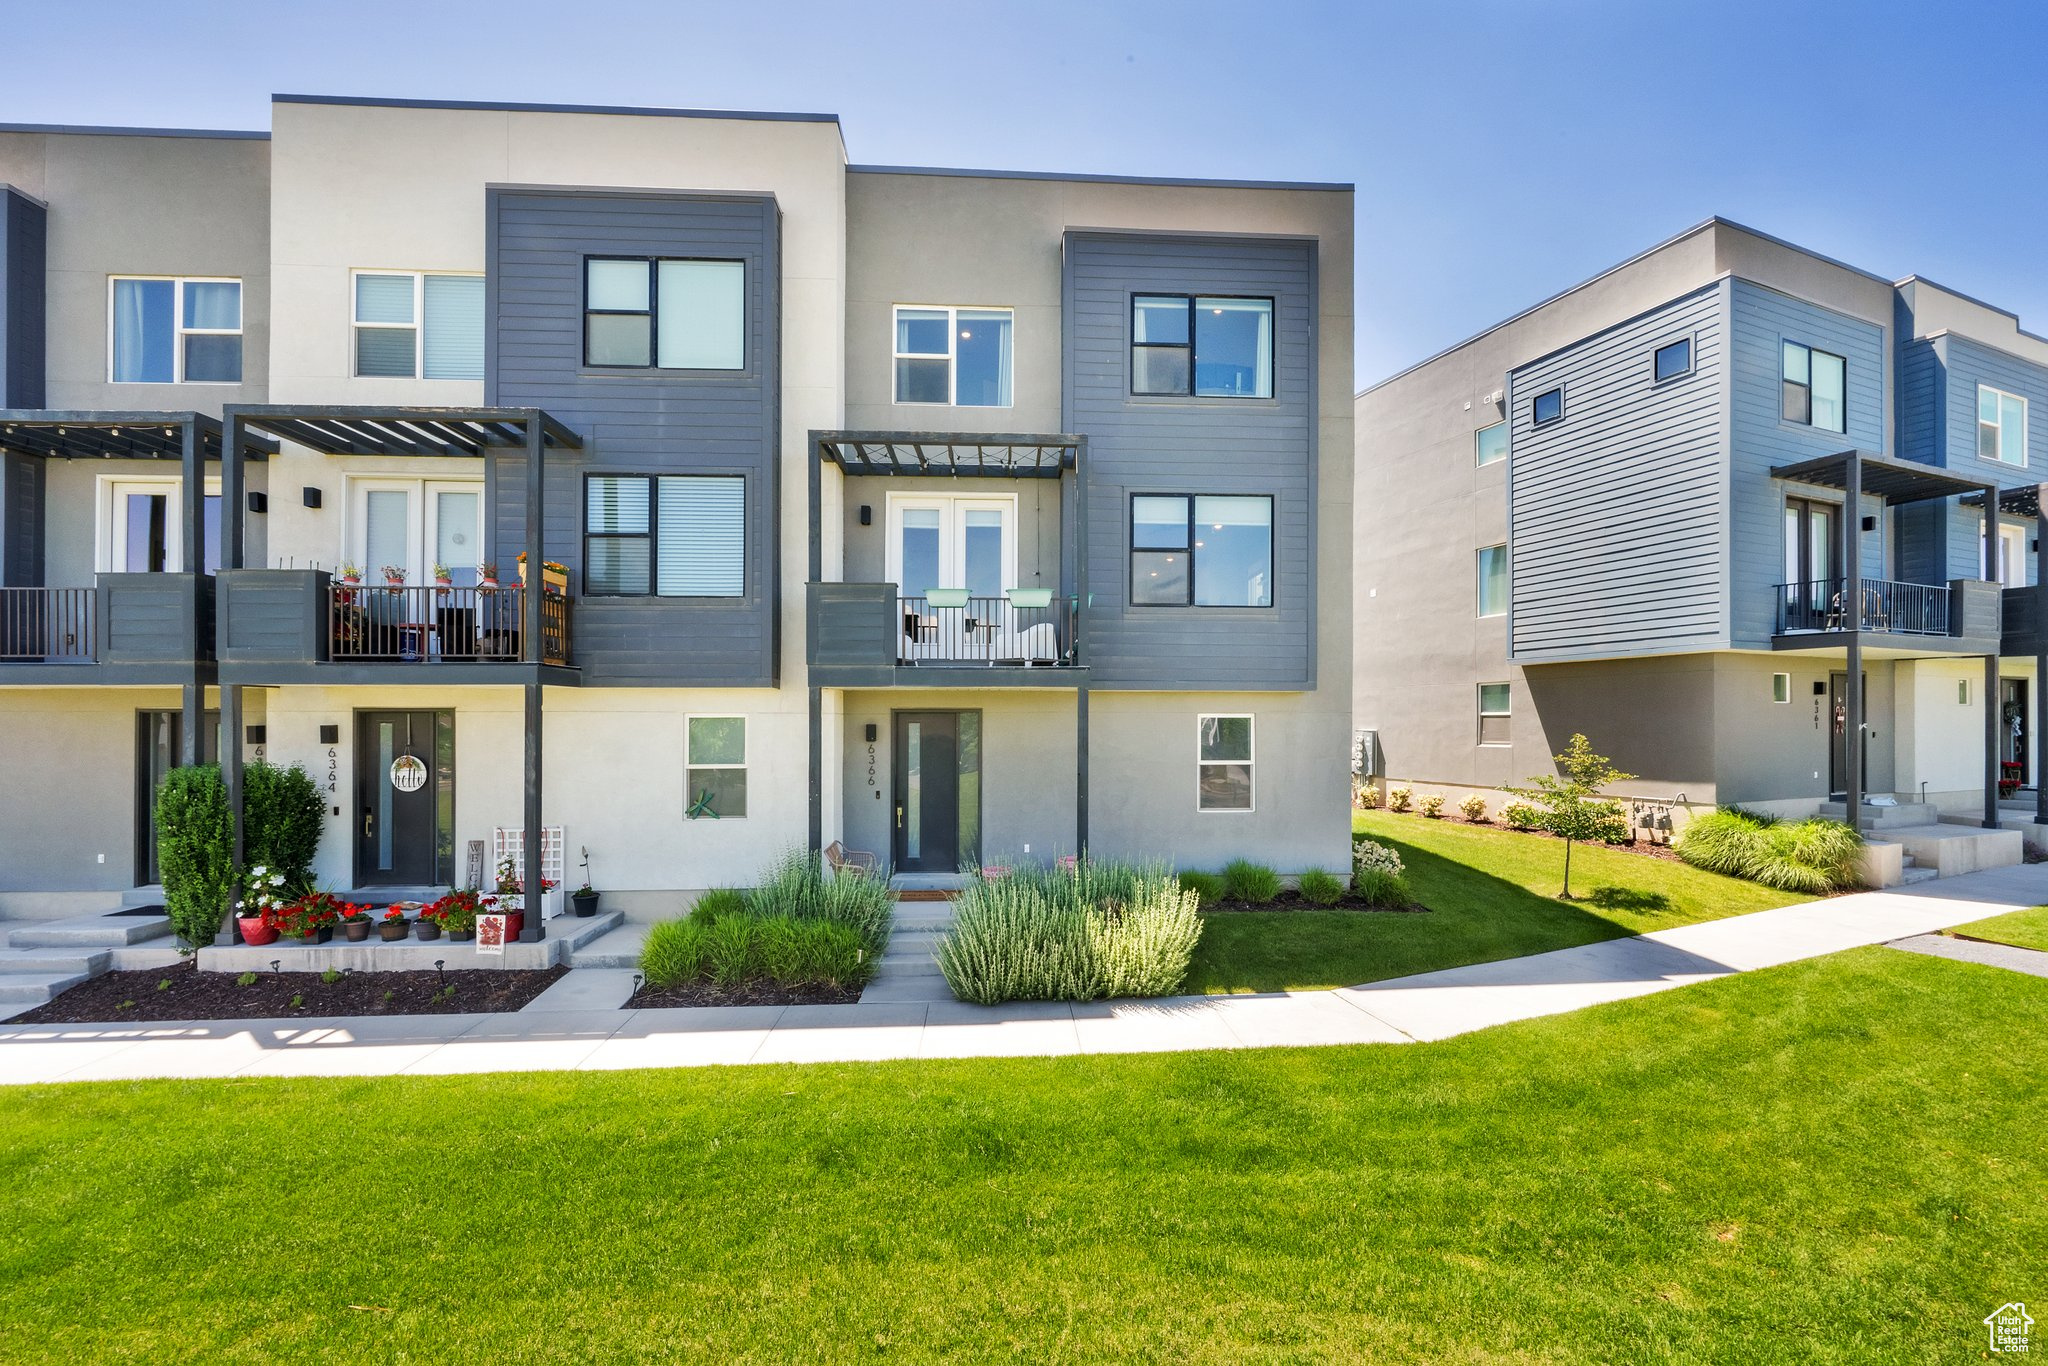
Active
$449,900
3
bds
|
3
ba
|
1,544
sqft
|
built
2019
6366 W Sugarcane Dr, South Jordan, UT 84009
$-1,118
Cash flow
-13.0%
Cash-on-Cash Return
3.3%
Cap rate
0.6%
Rent to Value Ratio
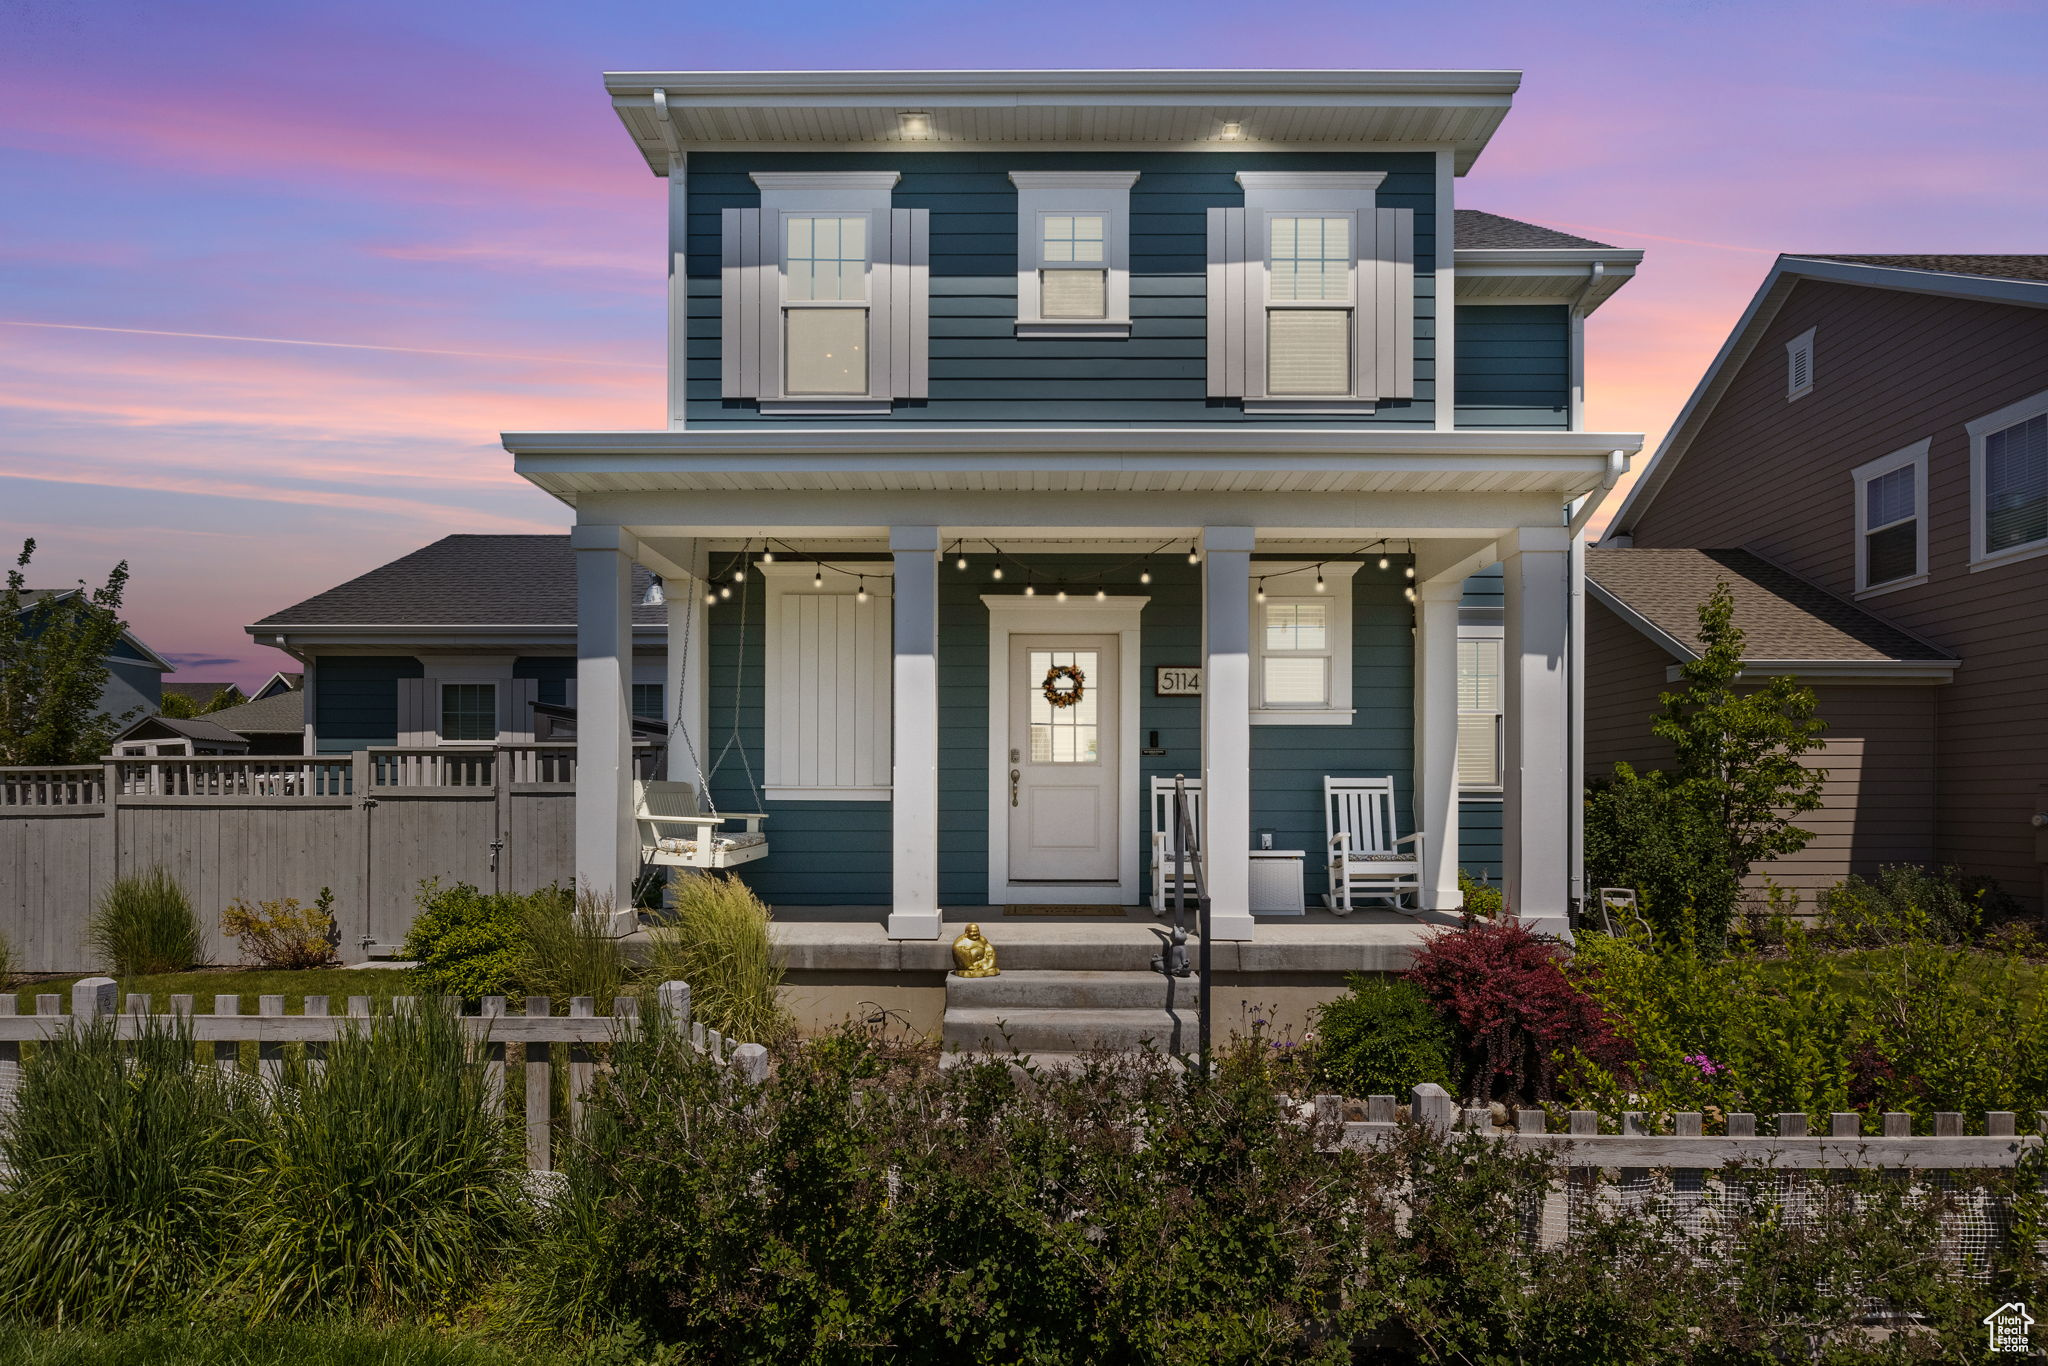
Active
$610,000
4
bds
|
4
ba
|
2,665
sqft
|
built
2018
5114 W Mellow Way, South Jordan, UT 84009
$-1,888
Cash flow
-16.1%
Cash-on-Cash Return
2.6%
Cap rate
0.4%
Rent to Value Ratio