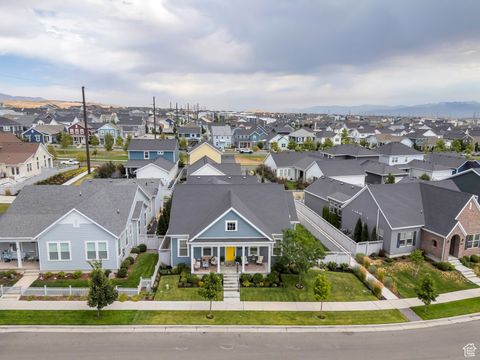
South Jordan, UT Investment Properties for Sale
Browse homes for sale and investment properties in South Jordan, UT. Refine your search by price, property type, or more.
Best cash flowing properties in South Jordan, UT
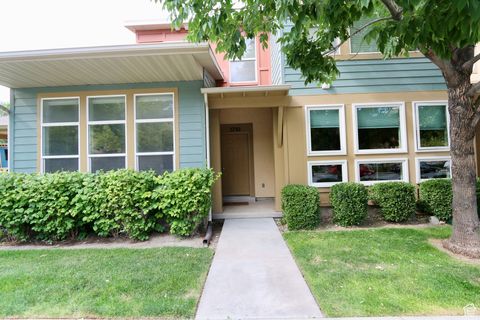
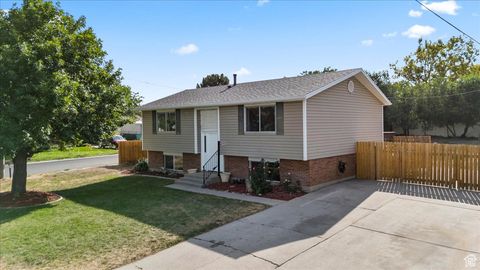
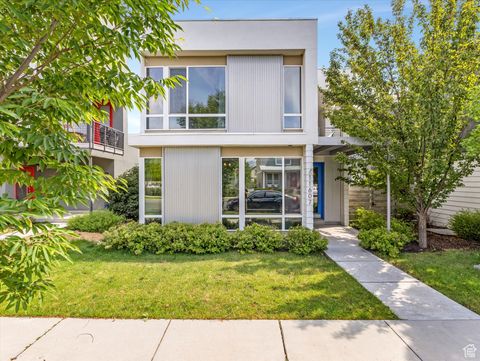
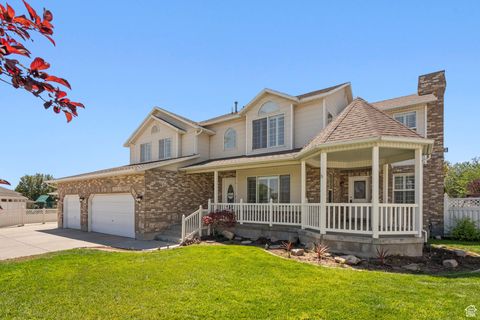
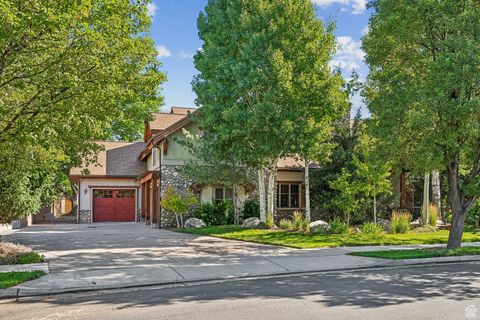
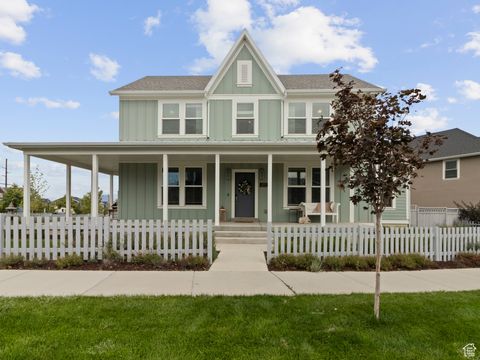
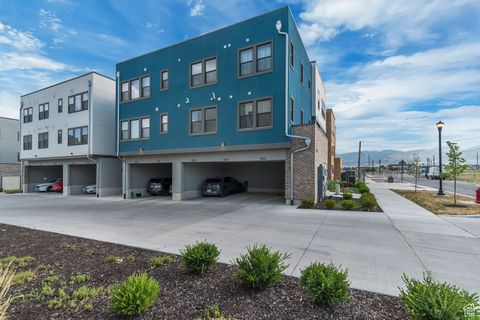
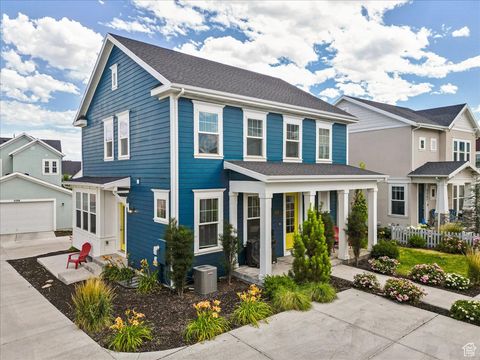
Active
$404,000
2
bds
|
3
ba
|
1,586
sqft
|
built
2008
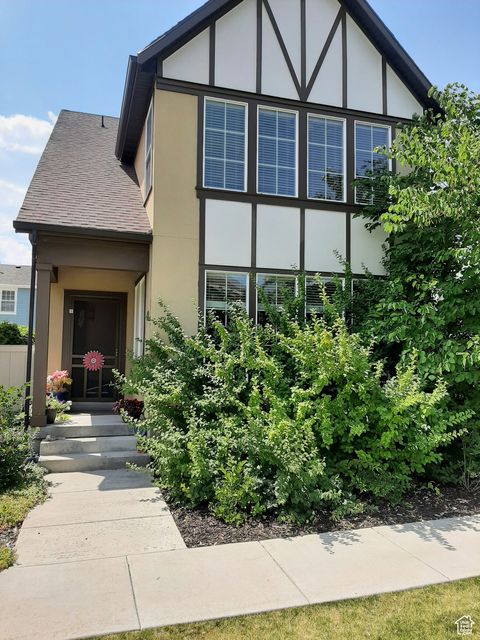
3792 W Lilac Heights Dr, South Jordan, UT 84095
$-741
Cash flow
-9.6%
Cash-on-Cash Return
3.5%
Cap rate
0.5%
Rent to Value Ratio
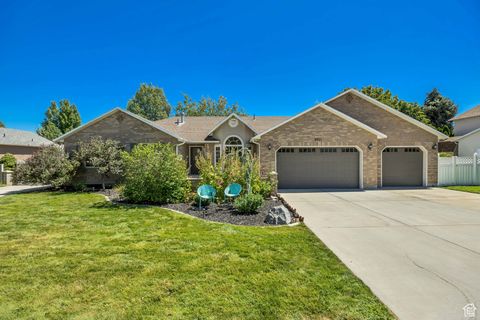
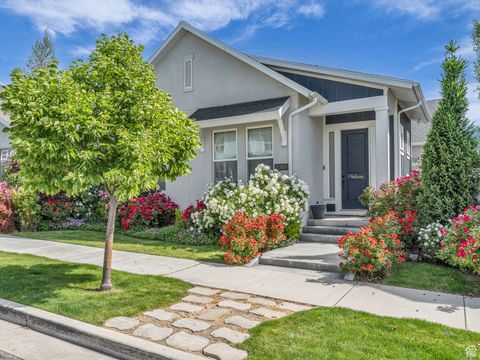
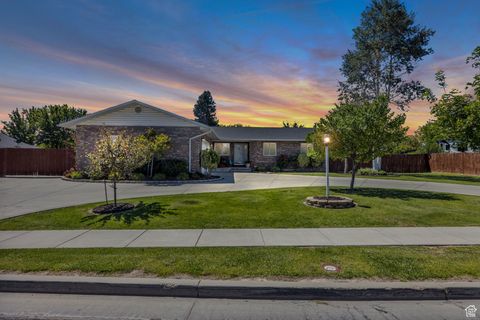
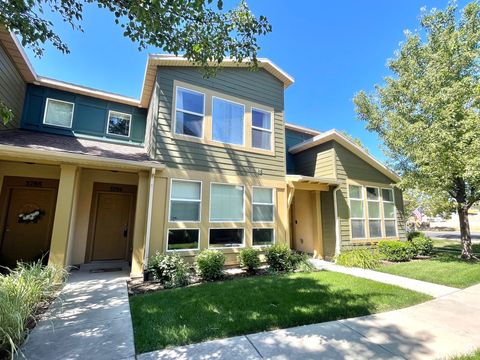
Active
$339,900
3
bds
|
2
ba
|
1,277
sqft
|
built
2008
11754 S Grandville Ave, South Jordan, UT 84009
$-904
Cash flow
-13.9%
Cash-on-Cash Return
2.5%
Cap rate
0.5%
Rent to Value Ratio
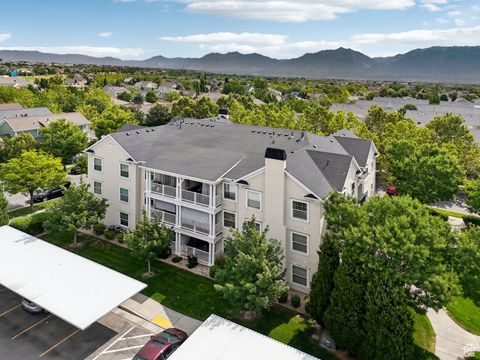
108 out of 145 properties for sale in South Jordan, UT
Limited Results Shown
Create a free account, or log in to reveal all property listings and enjoy the complete experience.
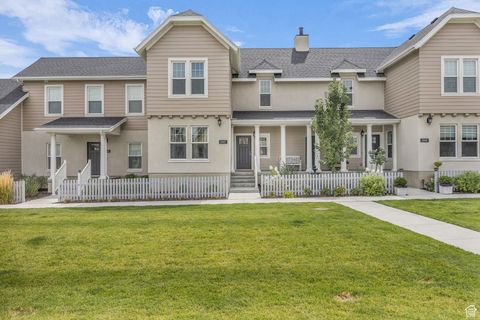
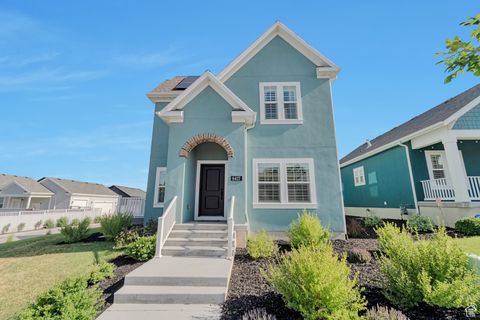
Active
$467,000
3
bds
|
3
ba
|
1,400
sqft
|
built
2022
11714 S Watercourse Rd, South Jordan, UT 84009
$-1,191
Cash flow
-13.3%
Cash-on-Cash Return
2.6%
Cap rate
0.5%
Rent to Value Ratio
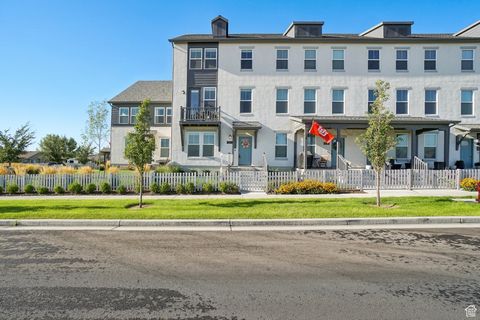
Active
$839,000
5
bds
|
4
ba
|
3,606
sqft
|
built
2016
10403 S Abbott Way, South Jordan, UT 84009
$-2,429
Cash flow
-15.1%
Cash-on-Cash Return
2.2%
Cap rate
0.3%
Rent to Value Ratio
Active
$535,000
4
bds
|
2
ba
|
1,971
sqft
|
built
1970
9770 S 1600 W, South Jordan, UT 84095
$-1,015
Cash flow
-9.9%
Cash-on-Cash Return
3.4%
Cap rate
0.5%
Rent to Value Ratio
Active
$848,000
5
bds
|
4
ba
|
4,328
sqft
|
built
1996
9851 S Birdie Way, South Jordan, UT 84009
$-1,908
Cash flow
-11.7%
Cash-on-Cash Return
3.0%
Cap rate
0.4%
Rent to Value Ratio
Active
$615,000
4
bds
|
3
ba
|
2,536
sqft
|
built
1997
4246 W Ascot Downs Dr, South Jordan, UT 84009
$-1,230
Cash flow
-10.4%
Cash-on-Cash Return
3.3%
Cap rate
0.5%
Rent to Value Ratio
Active
$740,000
4
bds
|
4
ba
|
3,420
sqft
|
built
2009
4498 W Talquin Ln, South Jordan, UT 84009
$-2,185
Cash flow
-15.4%
Cash-on-Cash Return
2.1%
Cap rate
0.3%
Rent to Value Ratio
Active
$665,000
3
bds
|
4
ba
|
2,783
sqft
|
built
2014
11607 S Alexandria Dr, South Jordan, UT 84009
$-1,675
Cash flow
-13.1%
Cash-on-Cash Return
2.7%
Cap rate
0.4%
Rent to Value Ratio
Active
$1,149,999
6
bds
|
5
ba
|
5,006
sqft
|
built
2014
4821 W Dock St, South Jordan, UT 84009
$-2,232
Cash flow
-10.1%
Cash-on-Cash Return
3.3%
Cap rate
0.5%
Rent to Value Ratio
Active
$925,000
5
bds
|
4
ba
|
3,316
sqft
|
built
2019
10954 S Paddle Board Way, South Jordan, UT 84009
$-1,561
Cash flow
-8.8%
Cash-on-Cash Return
3.7%
Cap rate
0.5%
Rent to Value Ratio
Active
$849,900
7
bds
|
4
ba
|
4,234
sqft
|
built
1992
2532 W 11275 S, South Jordan, UT 84095
$-1,287
Cash flow
-7.9%
Cash-on-Cash Return
3.9%
Cap rate
0.5%
Rent to Value Ratio
Active
$875,000
5
bds
|
4
ba
|
4,219
sqft
|
built
1996
9982 S Eden View Ct, South Jordan, UT 84095
$-2,034
Cash flow
-12.1%
Cash-on-Cash Return
2.9%
Cap rate
0.4%
Rent to Value Ratio
Active
$600,000
6
bds
|
4
ba
|
3,485
sqft
|
built
2007
4251 W Lake Bridge Dr, South Jordan, UT 84009
$-1,004
Cash flow
-8.7%
Cash-on-Cash Return
3.7%
Cap rate
0.5%
Rent to Value Ratio
Active
$420,000
3
bds
|
3
ba
|
1,445
sqft
|
built
2022
6642 W Skip Rock Rd, South Jordan, UT 84009
$-1,115
Cash flow
-13.9%
Cash-on-Cash Return
2.5%
Cap rate
0.5%
Rent to Value Ratio
Active
$2,274,999
7
bds
|
5
ba
|
7,050
sqft
|
built
1997
1064 W Park Palisade Dr, South Jordan, UT 84095
$-7,766
Cash flow
-17.8%
Cash-on-Cash Return
1.6%
Cap rate
0.2%
Rent to Value Ratio
Active
$1,095,000
5
bds
|
5
ba
|
4,430
sqft
|
built
2003
2732 W Lizzi Cv, South Jordan, UT 84095
$-1,133
Cash flow
-5.4%
Cash-on-Cash Return
4.4%
Cap rate
0.6%
Rent to Value Ratio
Active
$719,000
4
bds
|
4
ba
|
3,106
sqft
|
built
2017
11383 S New Bern Way, South Jordan, UT 84009
$-1,629
Cash flow
-11.8%
Cash-on-Cash Return
3.0%
Cap rate
0.4%
Rent to Value Ratio
Active
$540,000
2
bds
|
3
ba
|
1,725
sqft
|
built
2020
11007 S Kestrel Rise Rd, South Jordan, UT 84009
$-1,707
Cash flow
-16.5%
Cash-on-Cash Return
1.9%
Cap rate
0.4%
Rent to Value Ratio
Active
$450,000
4
bds
|
3
ba
|
2,184
sqft
|
built
2020
5753 W Lake Ave, South Jordan, UT 84009
$-1,073
Cash flow
-12.4%
Cash-on-Cash Return
2.8%
Cap rate
0.5%
Rent to Value Ratio
Active
$999,950
6
bds
|
4
ba
|
5,433
sqft
|
built
2019
11571 S Skyward Rd, South Jordan, UT 84009
$-1,880
Cash flow
-9.8%
Cash-on-Cash Return
3.4%
Cap rate
0.5%
Rent to Value Ratio
Active
$417,000
2
bds
|
3
ba
|
1,598
sqft
|
built
2020
11011 S Lake Run Rd, South Jordan, UT 84009
$-1,026
Cash flow
-12.8%
Cash-on-Cash Return
2.7%
Cap rate
0.5%
Rent to Value Ratio
Active
$399,000
2
bds
|
3
ba
|
1,250
sqft
|
built
2020
10577 S Redknife Dr, South Jordan, UT 84009
$-1,213
Cash flow
-15.9%
Cash-on-Cash Return
2.0%
Cap rate
0.5%
Rent to Value Ratio
Active
$519,000
3
bds
|
2
ba
|
1,835
sqft
|
built
2007
11692 S Grandville Ave, South Jordan, UT 84009
$-1,091
Cash flow
-11.0%
Cash-on-Cash Return
3.2%
Cap rate
0.5%
Rent to Value Ratio
Active
$519,500
3
bds
|
3
ba
|
1,718
sqft
|
built
2010
10603 S Topview Rd, South Jordan, UT 84009
$-1,219
Cash flow
-12.2%
Cash-on-Cash Return
2.9%
Cap rate
0.4%
Rent to Value Ratio
Active
$459,900
3
bds
|
3
ba
|
1,812
sqft
|
built
2013
4811 W Daybreak Pkwy, South Jordan, UT 84009
$-977
Cash flow
-11.1%
Cash-on-Cash Return
3.1%
Cap rate
0.5%
Rent to Value Ratio
Active
$982,000
6
bds
|
5
ba
|
4,840
sqft
|
built
1999
10027 S Eden Ridge Dr, South Jordan, UT 84095
$-3,090
Cash flow
-16.4%
Cash-on-Cash Return
1.9%
Cap rate
0.3%
Rent to Value Ratio
Active
$598,700
5
bds
|
4
ba
|
2,666
sqft
|
built
2019
6468 W Sunrise Field Dr, South Jordan, UT 84009
$-1,498
Cash flow
-13.1%
Cash-on-Cash Return
2.7%
Cap rate
0.4%
Rent to Value Ratio
Active
$928,400
5
bds
|
5
ba
|
4,528
sqft
|
built
2018
6378 W Verdant Hills Way, South Jordan, UT 84009
$-2,136
Cash flow
-12.0%
Cash-on-Cash Return
2.9%
Cap rate
0.4%
Rent to Value Ratio
Active
$540,000
3
bds
|
3
ba
|
2,820
sqft
|
built
2023
11623 S Silver Pond Dr, South Jordan, UT 84009
$-1,122
Cash flow
-10.8%
Cash-on-Cash Return
3.2%
Cap rate
0.5%
Rent to Value Ratio
Active
$539,900
3
bds
|
3
ba
|
2,541
sqft
|
built
2007
5023 W Currant Dr, South Jordan, UT 84009
$-1,172
Cash flow
-11.3%
Cash-on-Cash Return
3.1%
Cap rate
0.5%
Rent to Value Ratio
Active
$539,870
3
bds
|
3
ba
|
2,353
sqft
|
built
2022
6711 W Skip Rock Rd, South Jordan, UT 84009
$-1,404
Cash flow
-13.6%
Cash-on-Cash Return
2.6%
Cap rate
0.4%
Rent to Value Ratio
Active
$453,000
3
bds
|
2
ba
|
1,329
sqft
|
built
2023
5243 W Reventon Dr, South Jordan, UT 84009
$-930
Cash flow
-10.7%
Cash-on-Cash Return
3.2%
Cap rate
0.6%
Rent to Value Ratio
Active
$780,000
6
bds
|
4
ba
|
3,244
sqft
|
built
1993
10366 S 2200 W, South Jordan, UT 84095
$-2,043
Cash flow
-13.7%
Cash-on-Cash Return
2.5%
Cap rate
0.4%
Rent to Value Ratio
Active
$699,000
4
bds
|
3
ba
|
2,699
sqft
|
built
2011
10353 S Cold Moon Pl, South Jordan, UT 84095
$-1,562
Cash flow
-11.7%
Cash-on-Cash Return
3.0%
Cap rate
0.5%
Rent to Value Ratio
Active
$629,900
4
bds
|
4
ba
|
2,774
sqft
|
built
2017
11087 S Owen Ridge Way, South Jordan, UT 84095
$-1,729
Cash flow
-14.3%
Cash-on-Cash Return
2.4%
Cap rate
0.3%
Rent to Value Ratio
Active
$599,000
4
bds
|
4
ba
|
2,822
sqft
|
built
2019
5239 W Mellow Way, South Jordan, UT 84009
$-1,531
Cash flow
-13.3%
Cash-on-Cash Return
2.6%
Cap rate
0.4%
Rent to Value Ratio
Active
$439,999
3
bds
|
3
ba
|
1,670
sqft
|
built
2008
3794 W Angelica View Ct, South Jordan, UT 84095
$-917
Cash flow
-10.9%
Cash-on-Cash Return
3.2%
Cap rate
0.5%
Rent to Value Ratio
Active
$549,900
4
bds
|
4
ba
|
2,073
sqft
|
built
2020
6427 W Arranmore Dr, South Jordan, UT 84009
$-1,405
Cash flow
-13.3%
Cash-on-Cash Return
2.6%
Cap rate
0.4%
Rent to Value Ratio
Active
$489,800
3
bds
|
3
ba
|
1,898
sqft
|
built
2017
10606 S Redknife Dr, South Jordan, UT 84009
$-956
Cash flow
-10.2%
Cash-on-Cash Return
3.3%
Cap rate
0.6%
Rent to Value Ratio