South Jordan, UT Investment Properties for Sale
Browse homes for sale and investment properties in South Jordan, UT. Refine your search by price, property type, or more.
Best cash flowing properties in South Jordan, UT
Active
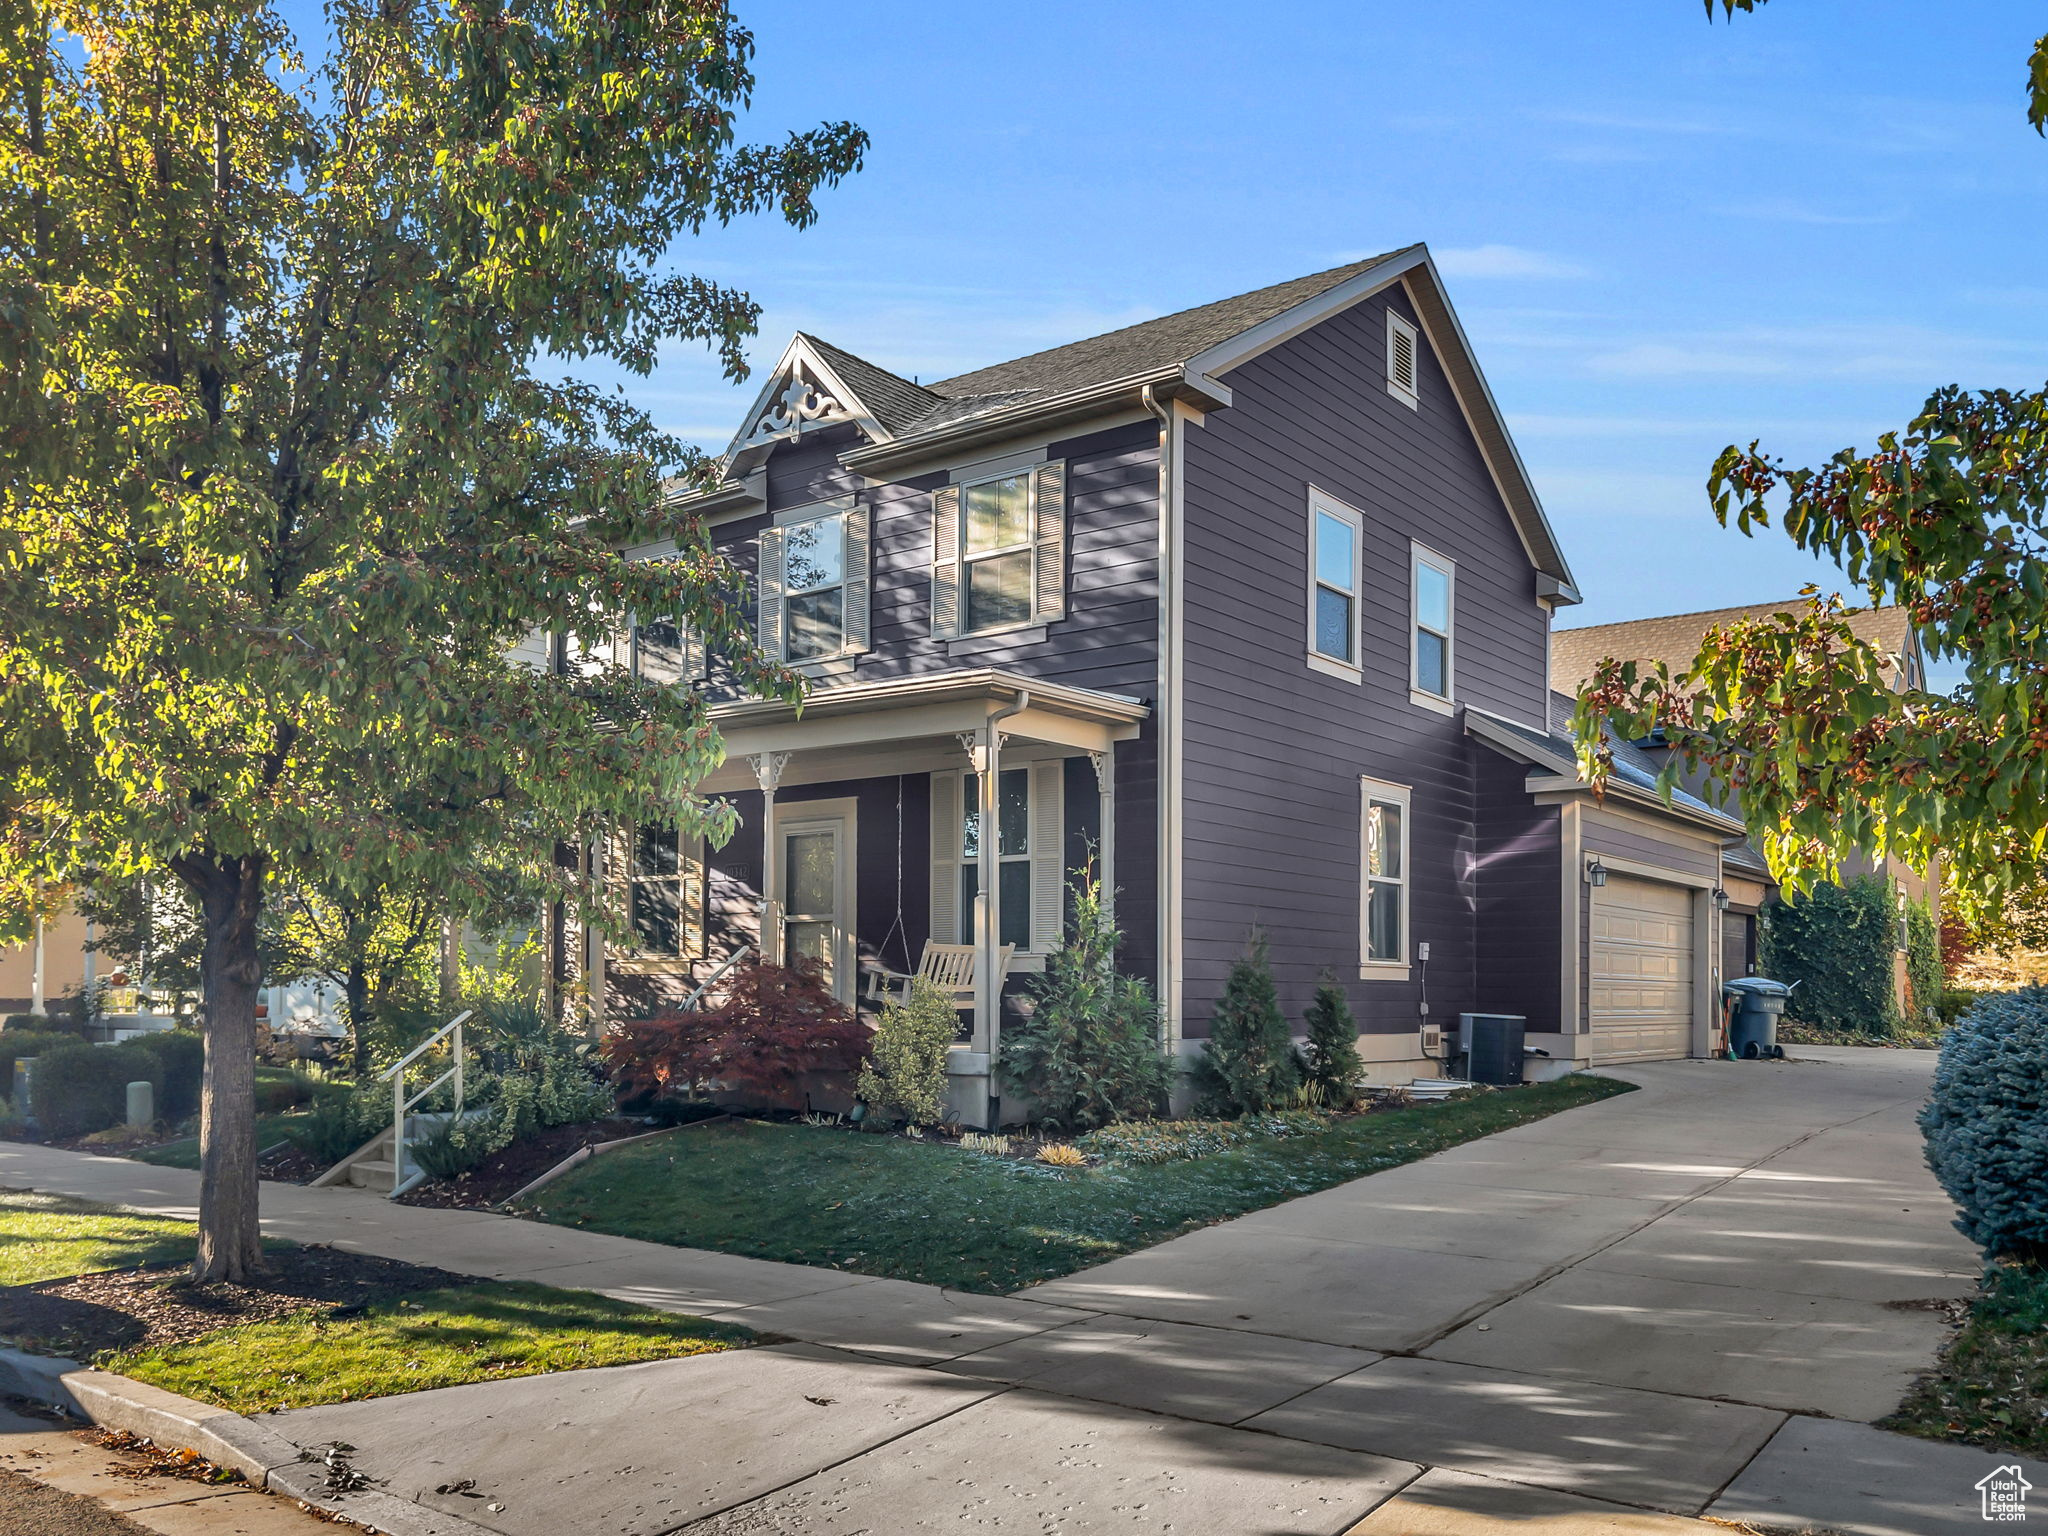
$454,900
3
bds
|
2
ba
|
1,415
sqft
|
built
2015
1741 W Nikos Ln, South Jordan, UT 84095
$-1,114
Cash flow
-12.8%
Cash-on-Cash Return
3.4%
Cap rate
0.5%
Rent to Value Ratio
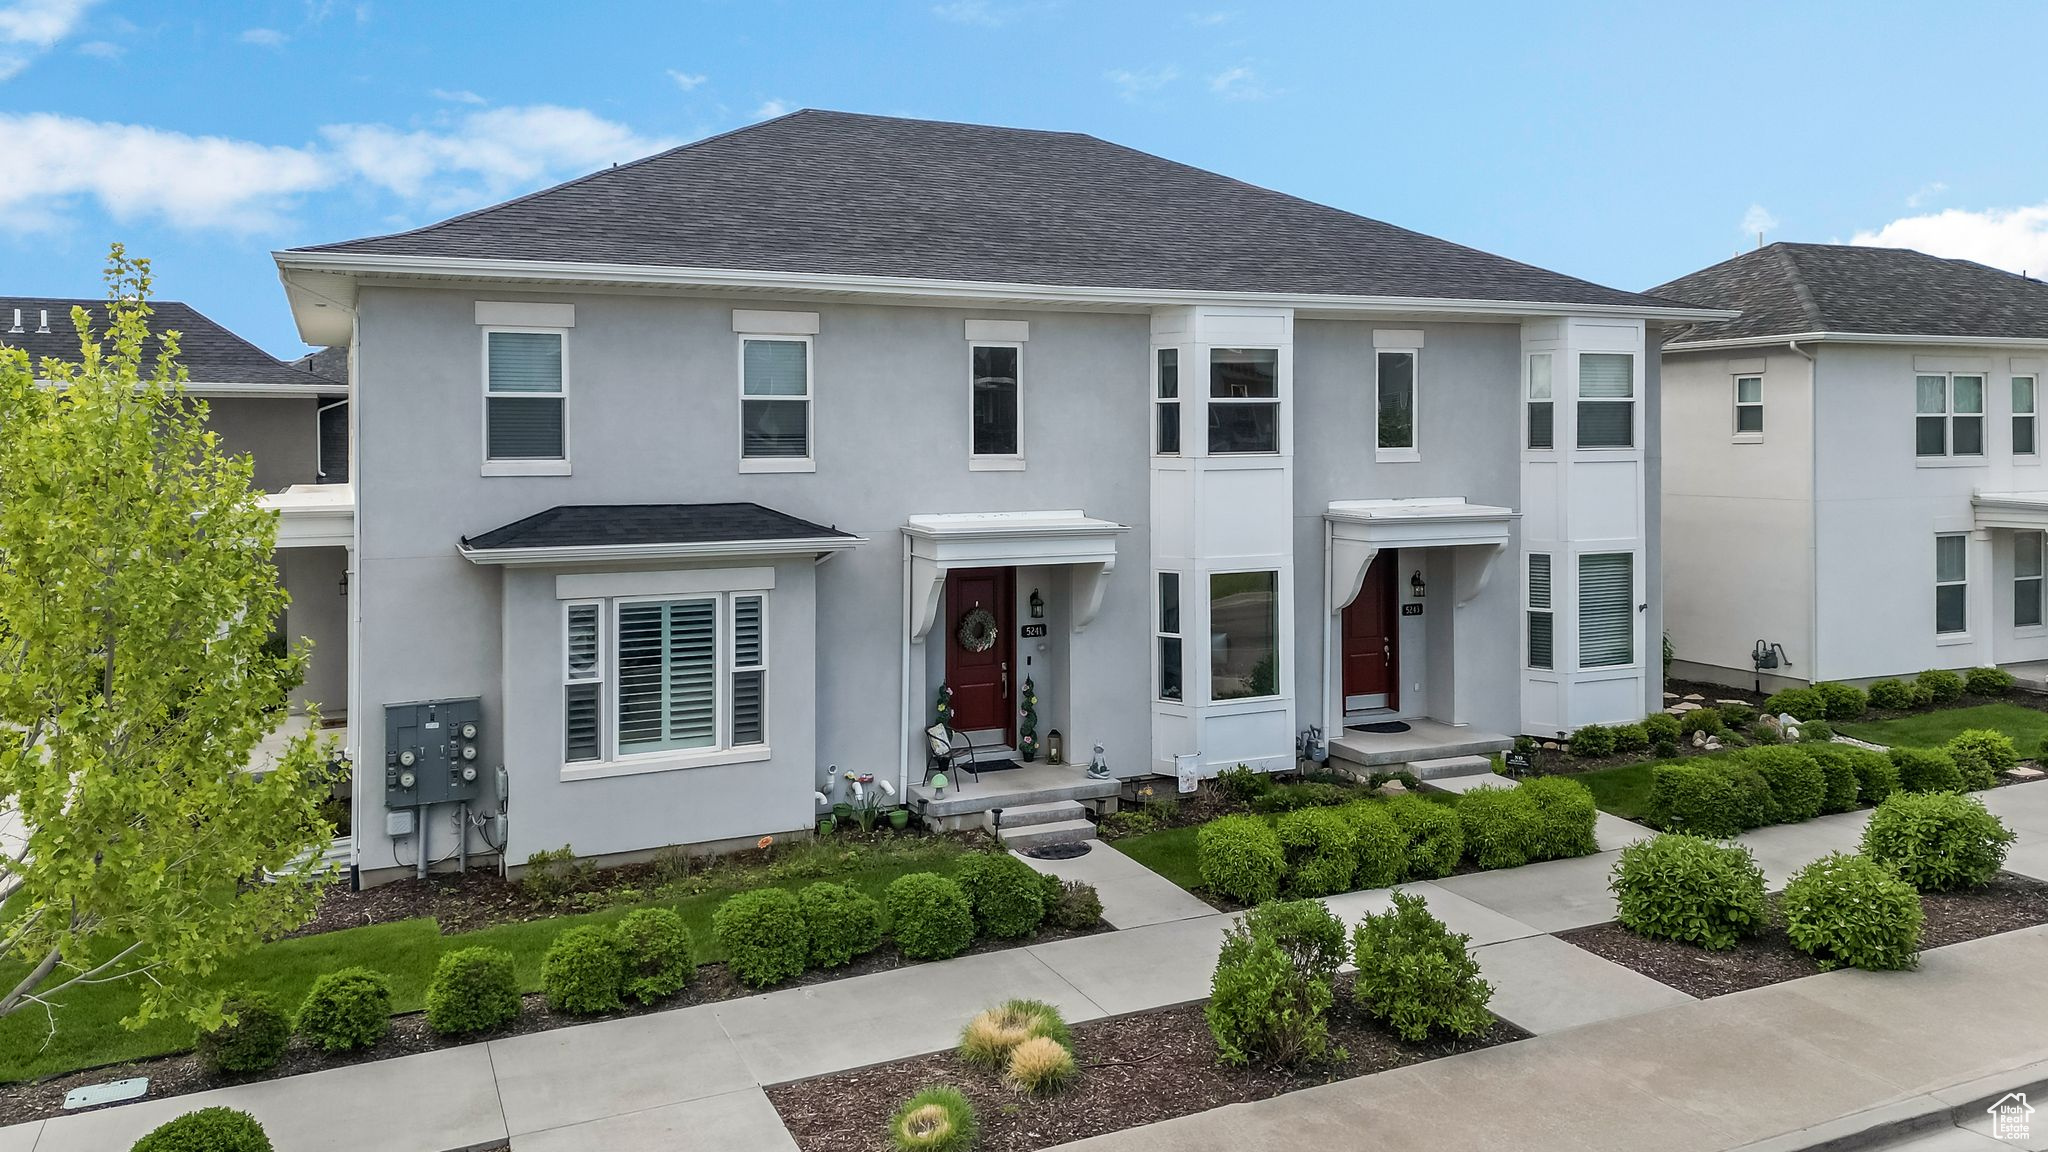
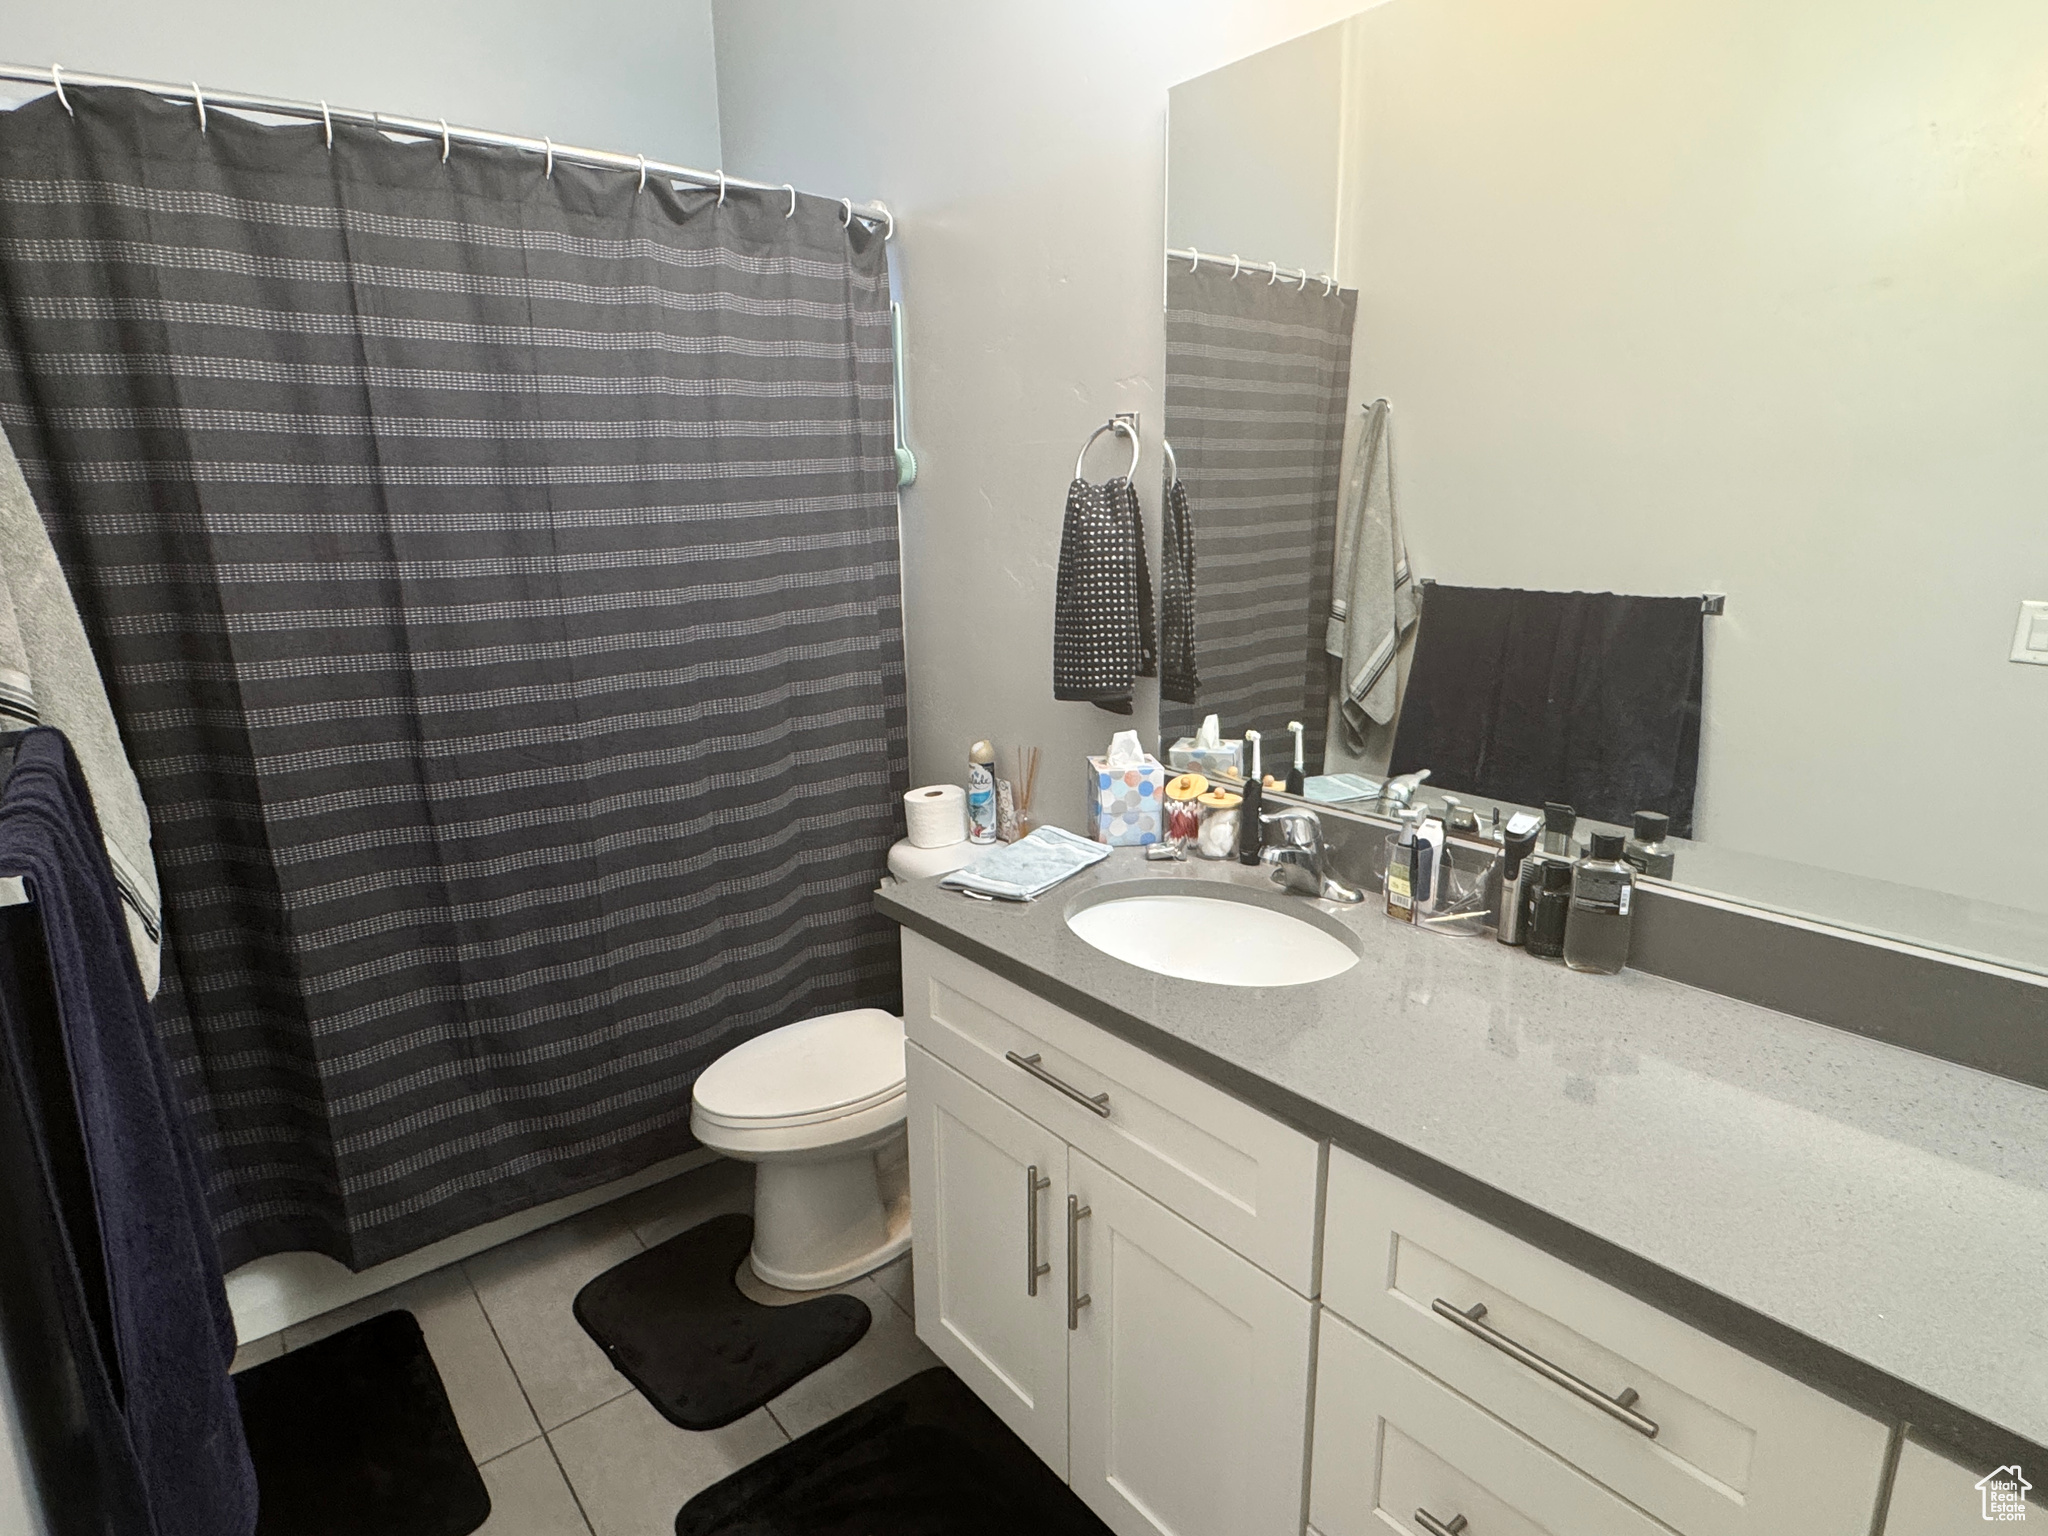
Active
$520,000
5
bds
|
4
ba
|
2,763
sqft
|
built
2017
5241 W South Jordan Pkwy, South Jordan, UT 84009
$-1,125
Cash flow
-11.3%
Cash-on-Cash Return
3.7%
Cap rate
0.6%
Rent to Value Ratio
255 out of 313 properties for sale in South Jordan, UT
Limited Results Shown
Create a free account, or log in to reveal all property listings and enjoy the complete experience.
Active
$676,900
4
bds
|
3
ba
|
3,010
sqft
|
built
1998
4980 W Woodridge Dr, South Jordan, UT 84009
$-1,614
Cash flow
-12.4%
Cash-on-Cash Return
3.4%
Cap rate
0.5%
Rent to Value Ratio
Active
$520,000
5
bds
|
4
ba
|
2,763
sqft
|
built
2017
5241 W South Jordan Pkwy, South Jordan, UT 84009
$-1,125
Cash flow
-11.3%
Cash-on-Cash Return
3.7%
Cap rate
0.6%
Rent to Value Ratio
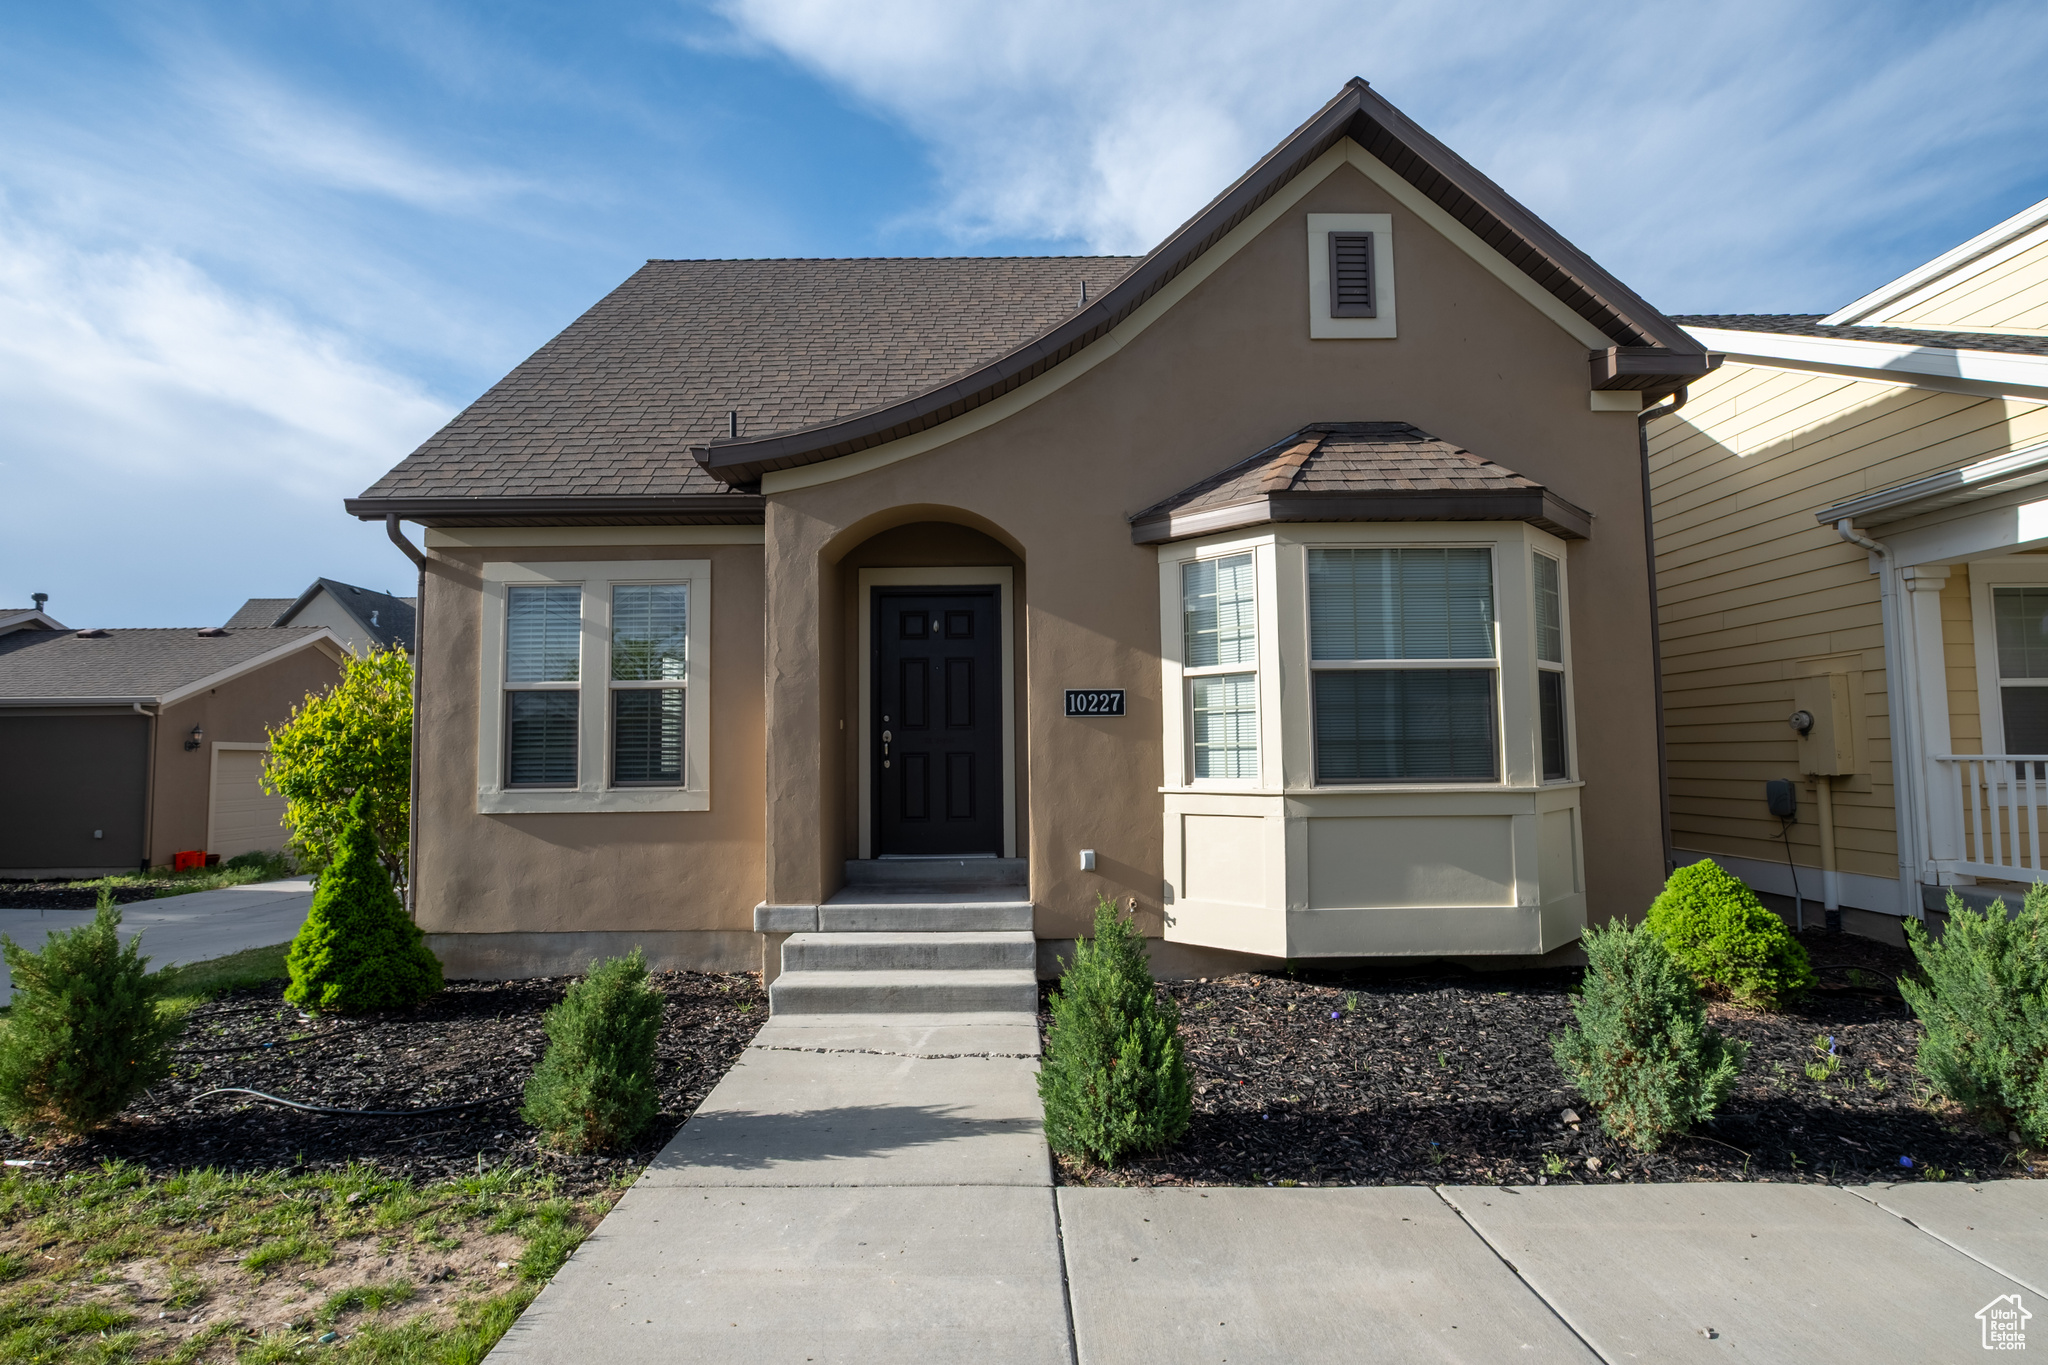
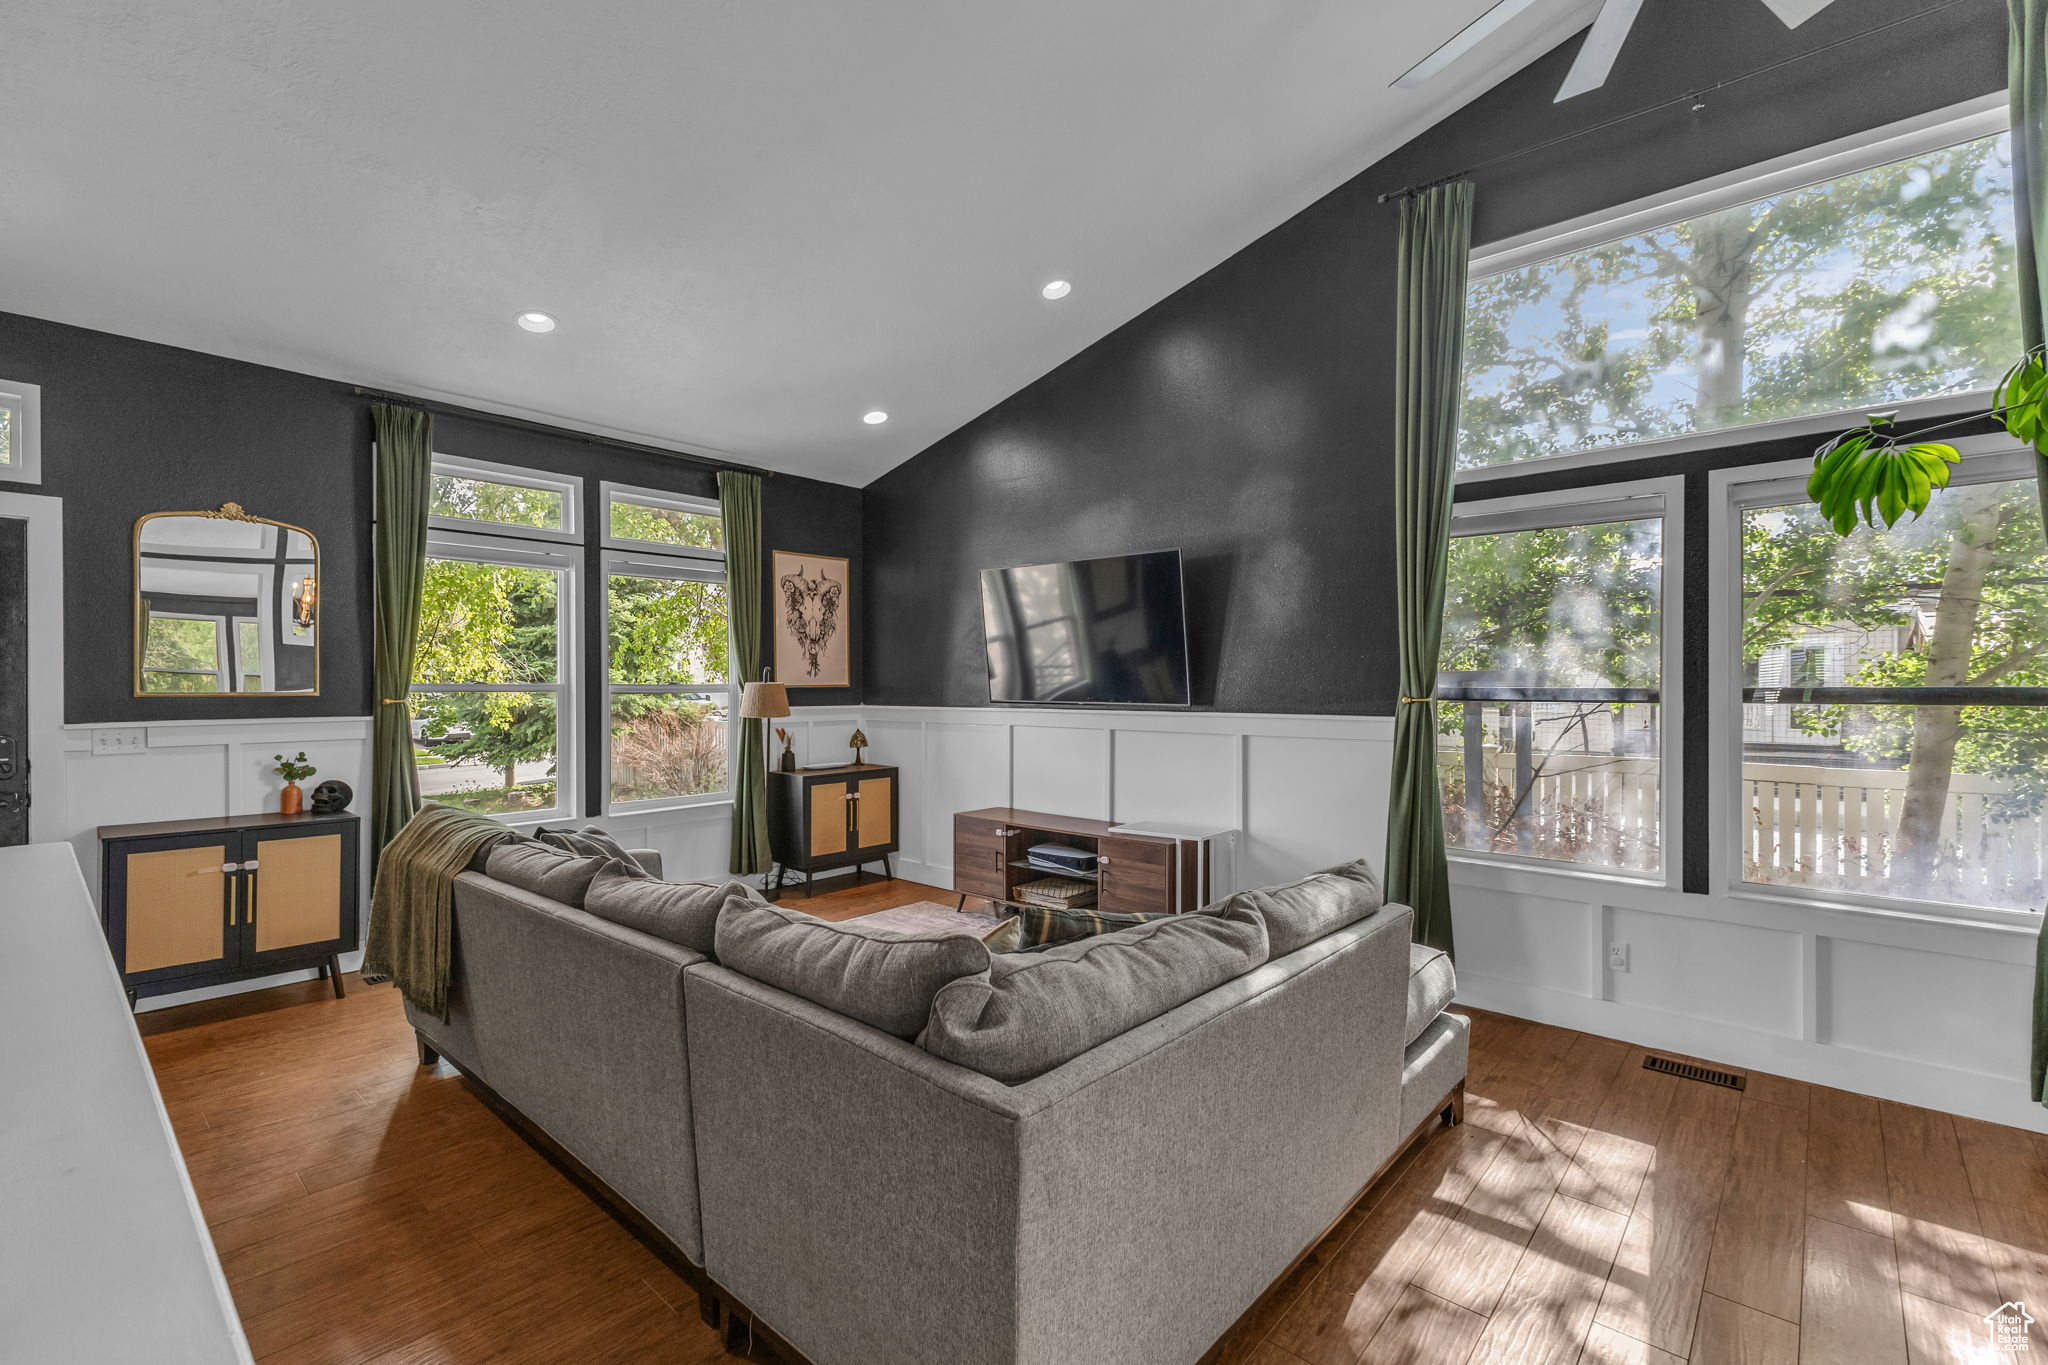
Active
$549,999
2
bds
|
2
ba
|
2,568
sqft
|
built
2009
10227 S Oquirrh Lake Rd, South Jordan, UT 84009
$-1,995
Cash flow
-18.9%
Cash-on-Cash Return
1.9%
Cap rate
0.3%
Rent to Value Ratio
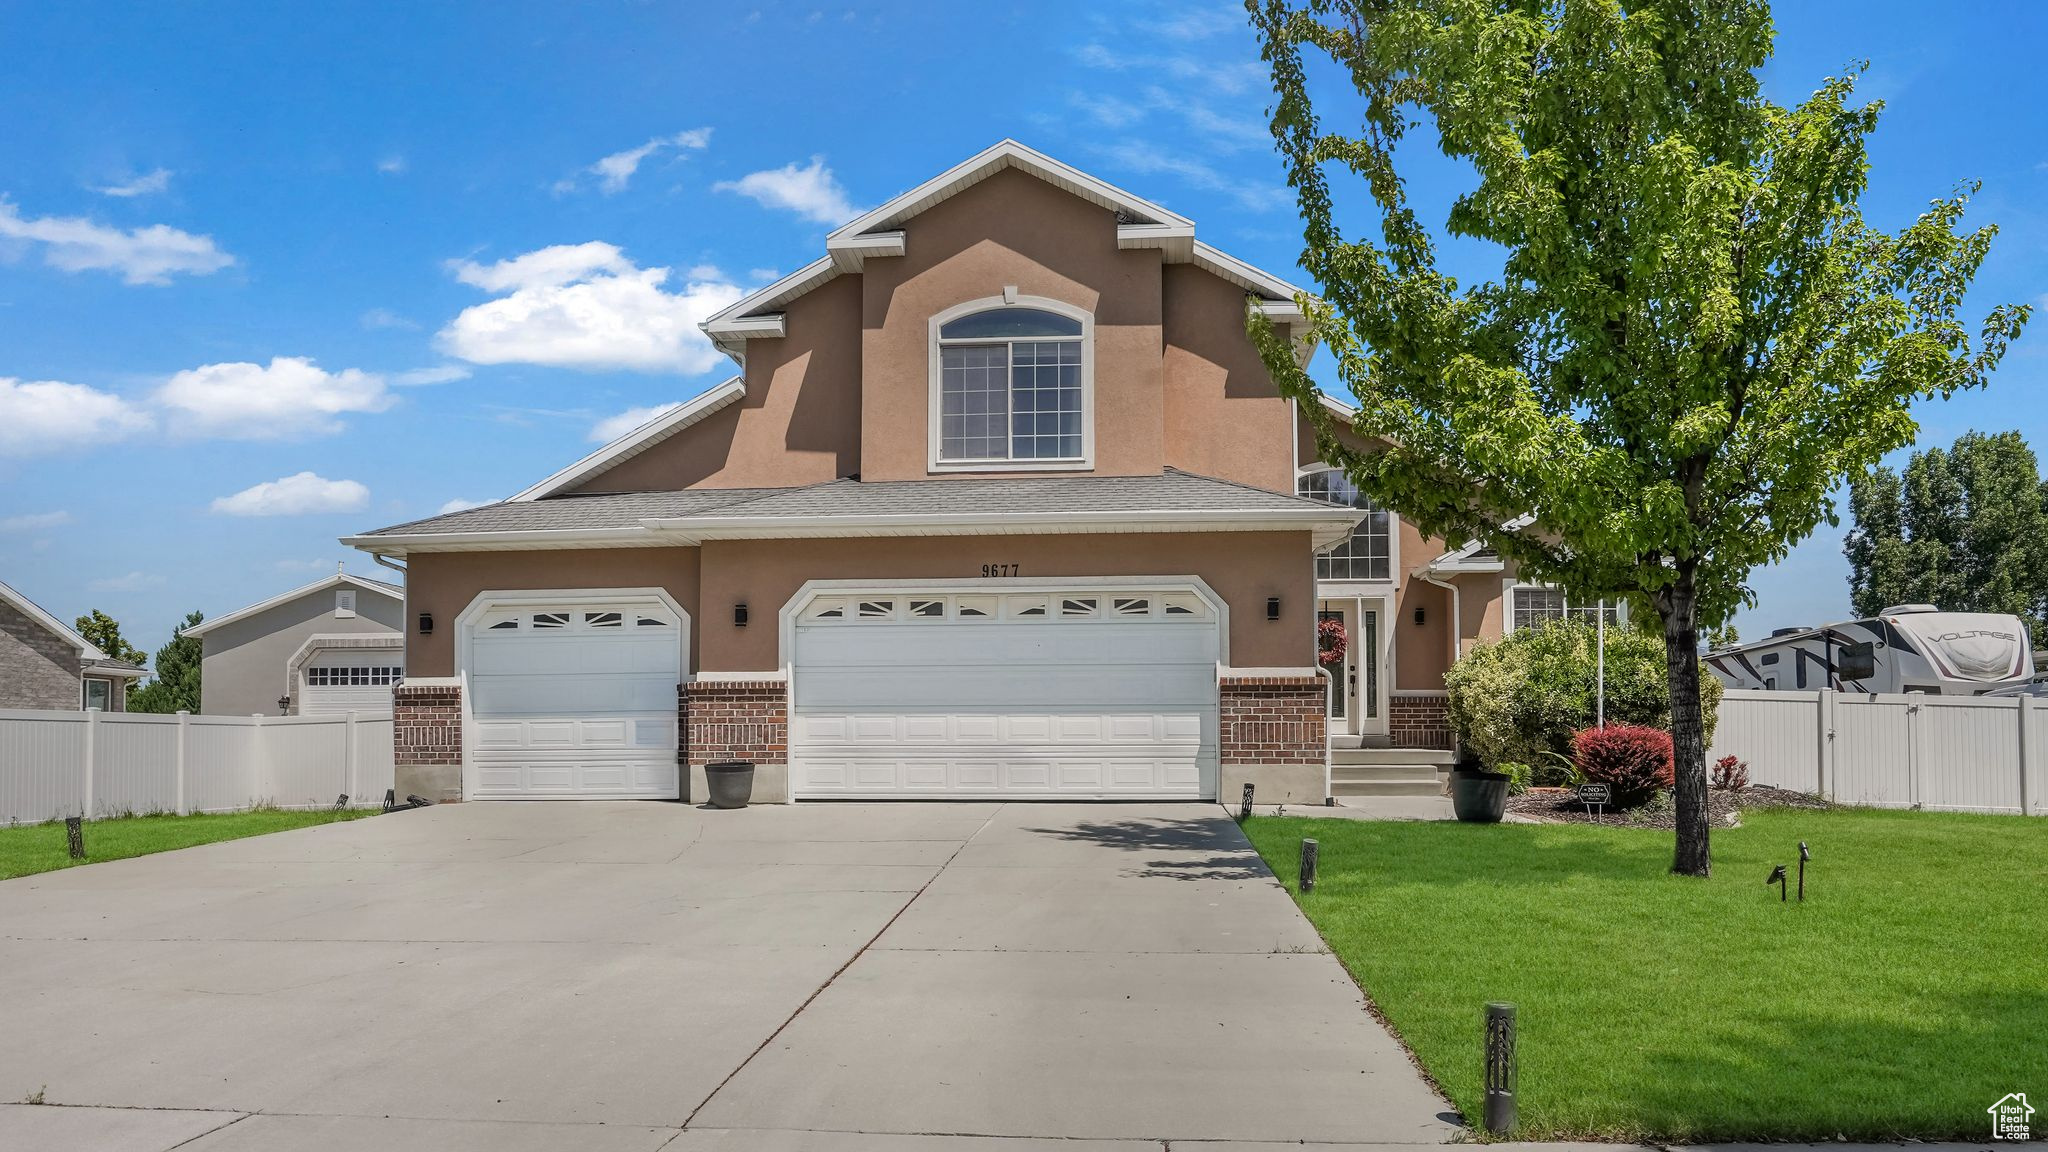
Active
$695,000
5
bds
|
4
ba
|
2,657
sqft
|
built
1996
9677 S Iron Gate Rd, South Jordan, UT 84095
$-1,711
Cash flow
-12.8%
Cash-on-Cash Return
3.3%
Cap rate
0.5%
Rent to Value Ratio
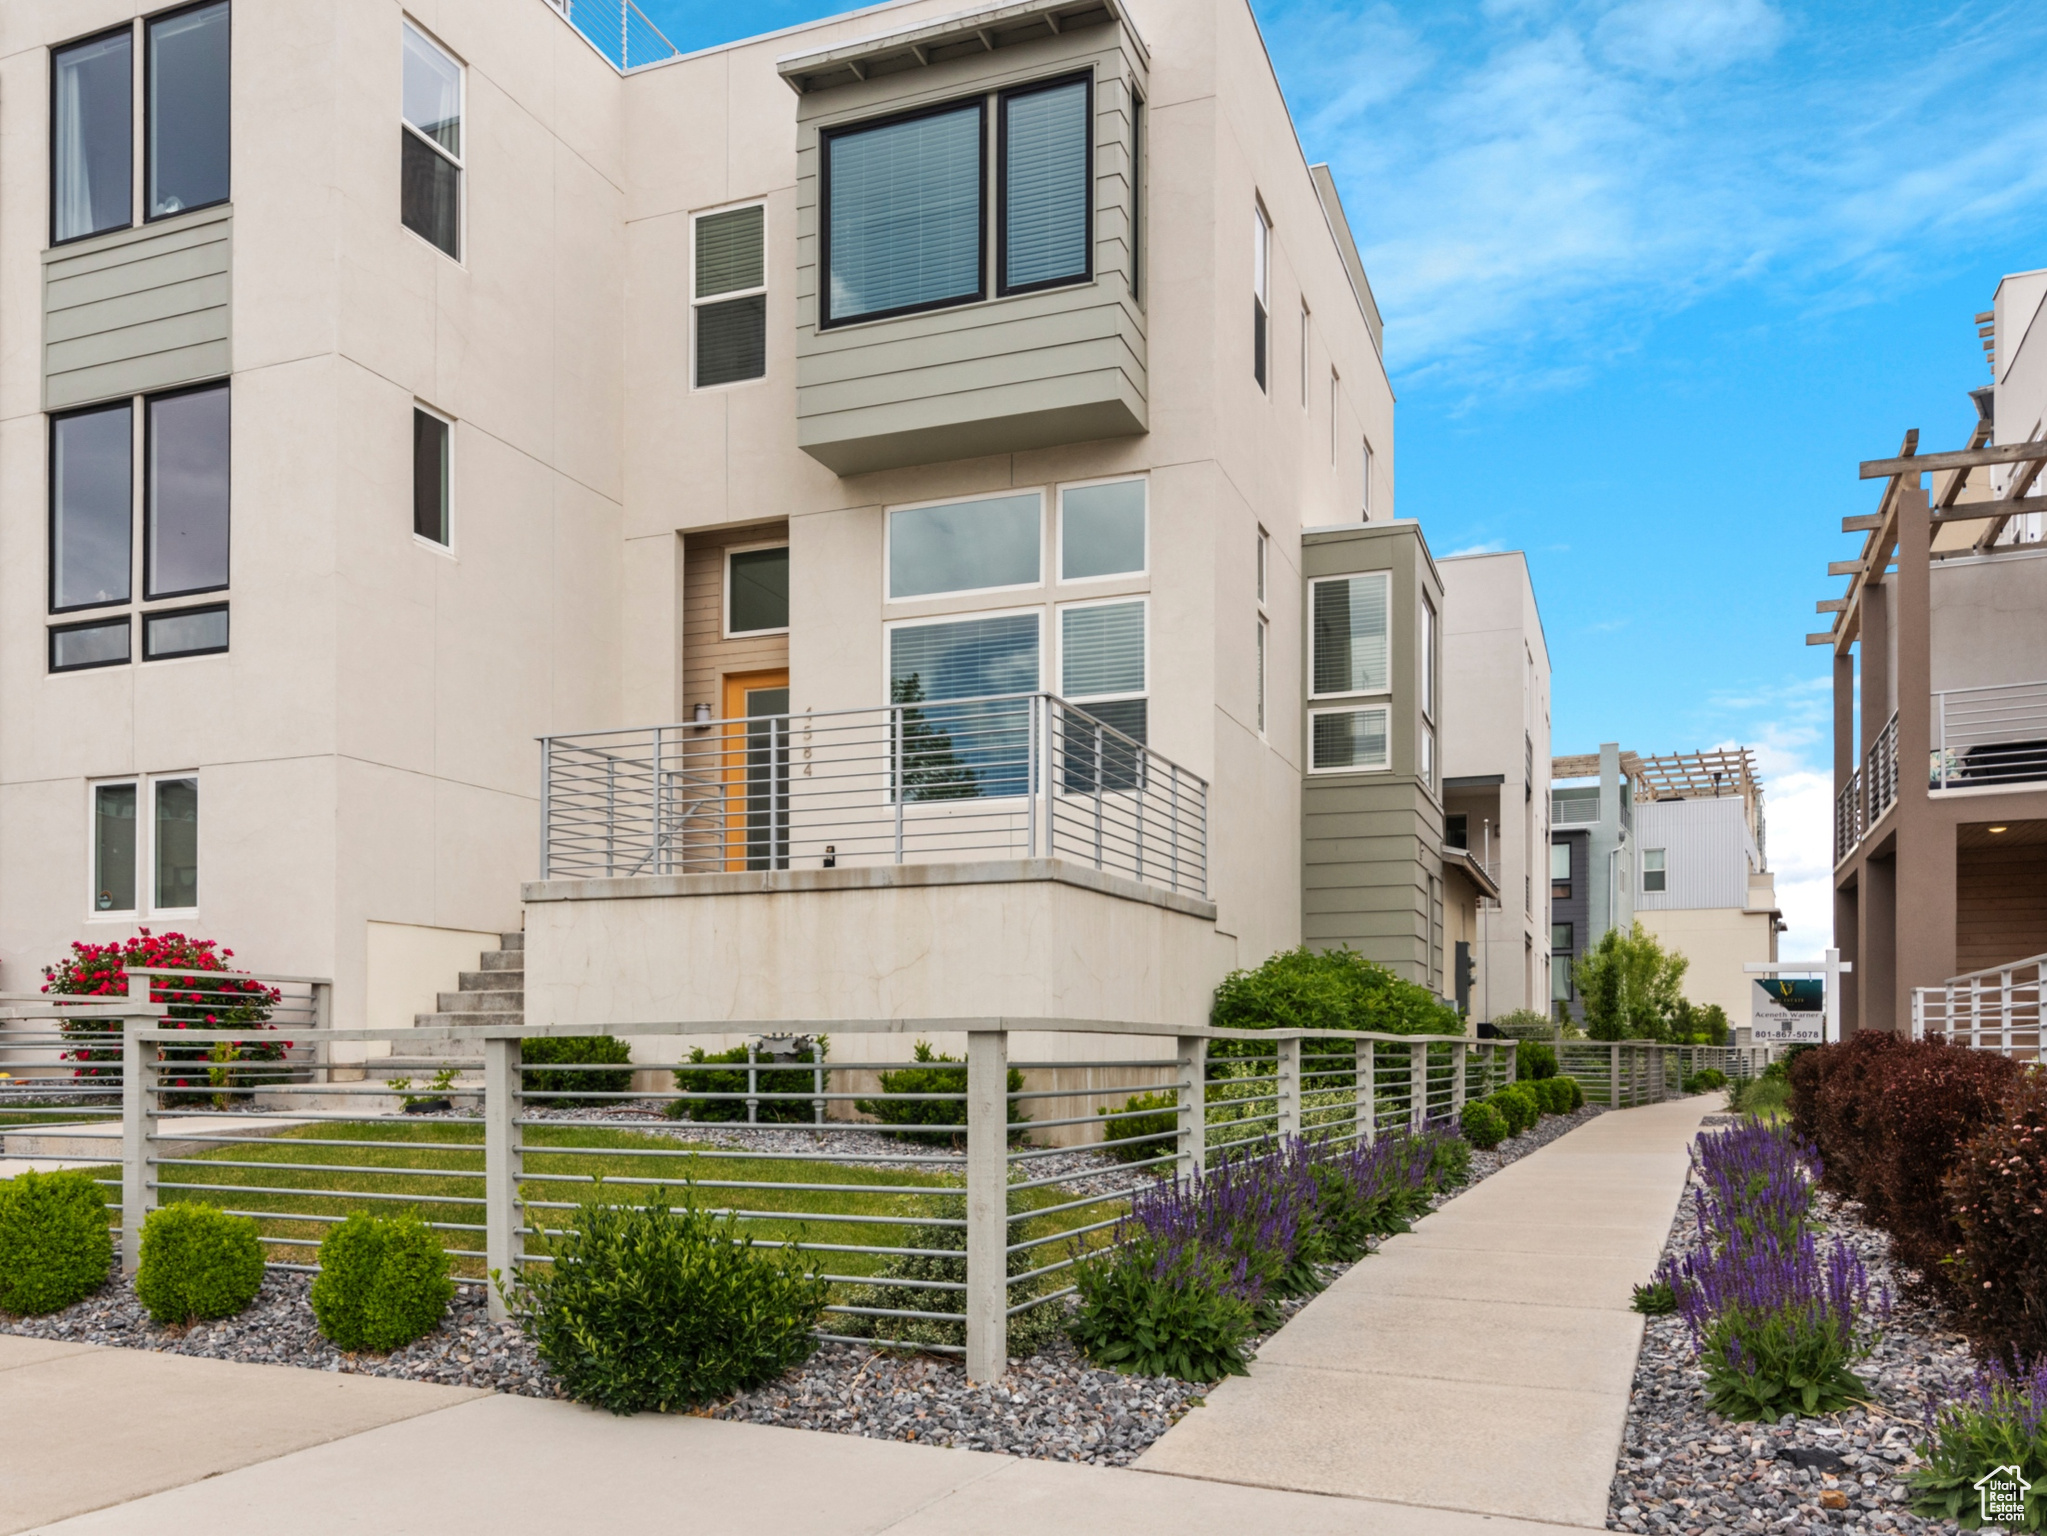
Active
$535,000
3
bds
|
3
ba
|
1,932
sqft
|
built
2019
4584 W Daybreak Rim Way, South Jordan, UT 84009
$-1,428
Cash flow
-13.9%
Cash-on-Cash Return
3.1%
Cap rate
0.5%
Rent to Value Ratio
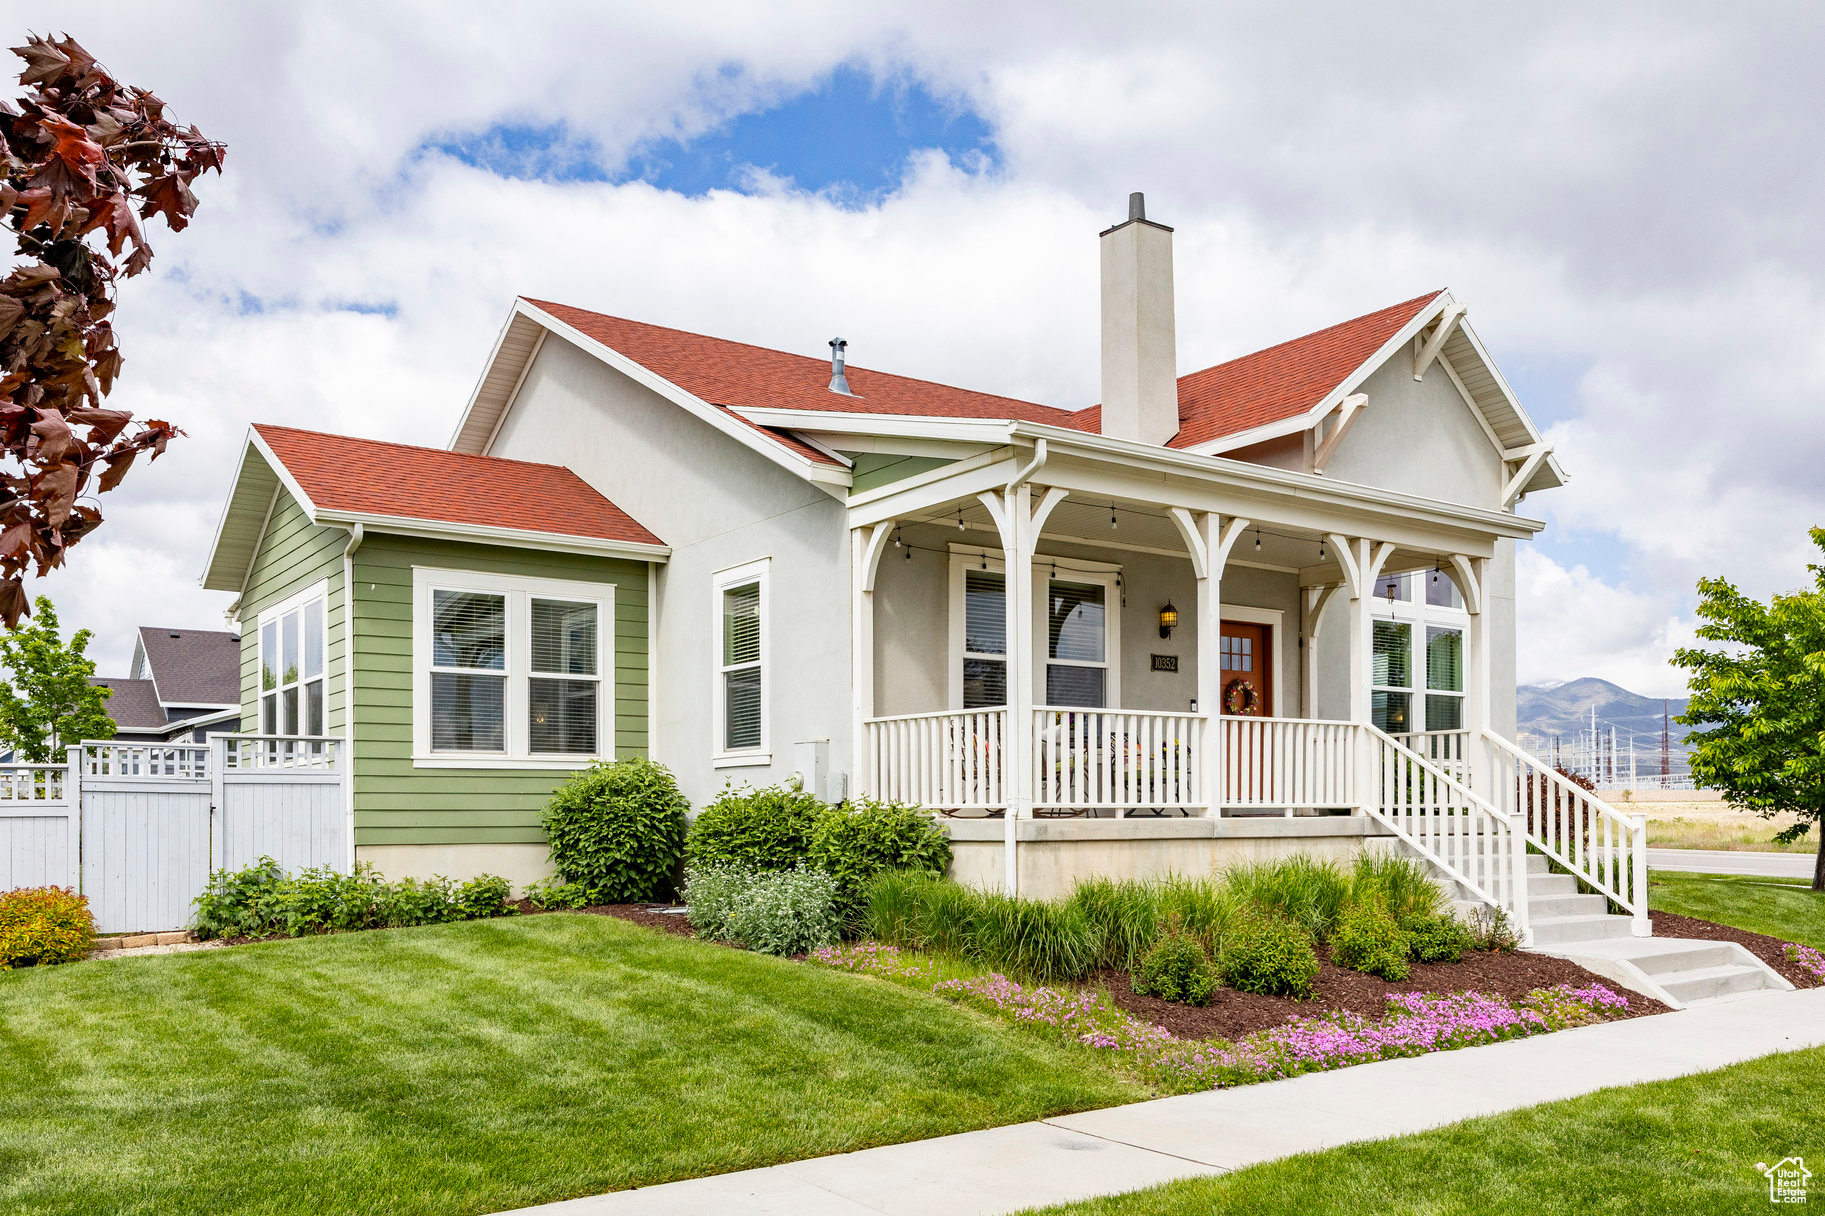
Active
$889,000
5
bds
|
3
ba
|
4,364
sqft
|
built
2016
10352 S Sturgeon Dr, South Jordan, UT 84009
$-2,705
Cash flow
-15.9%
Cash-on-Cash Return
2.6%
Cap rate
0.4%
Rent to Value Ratio
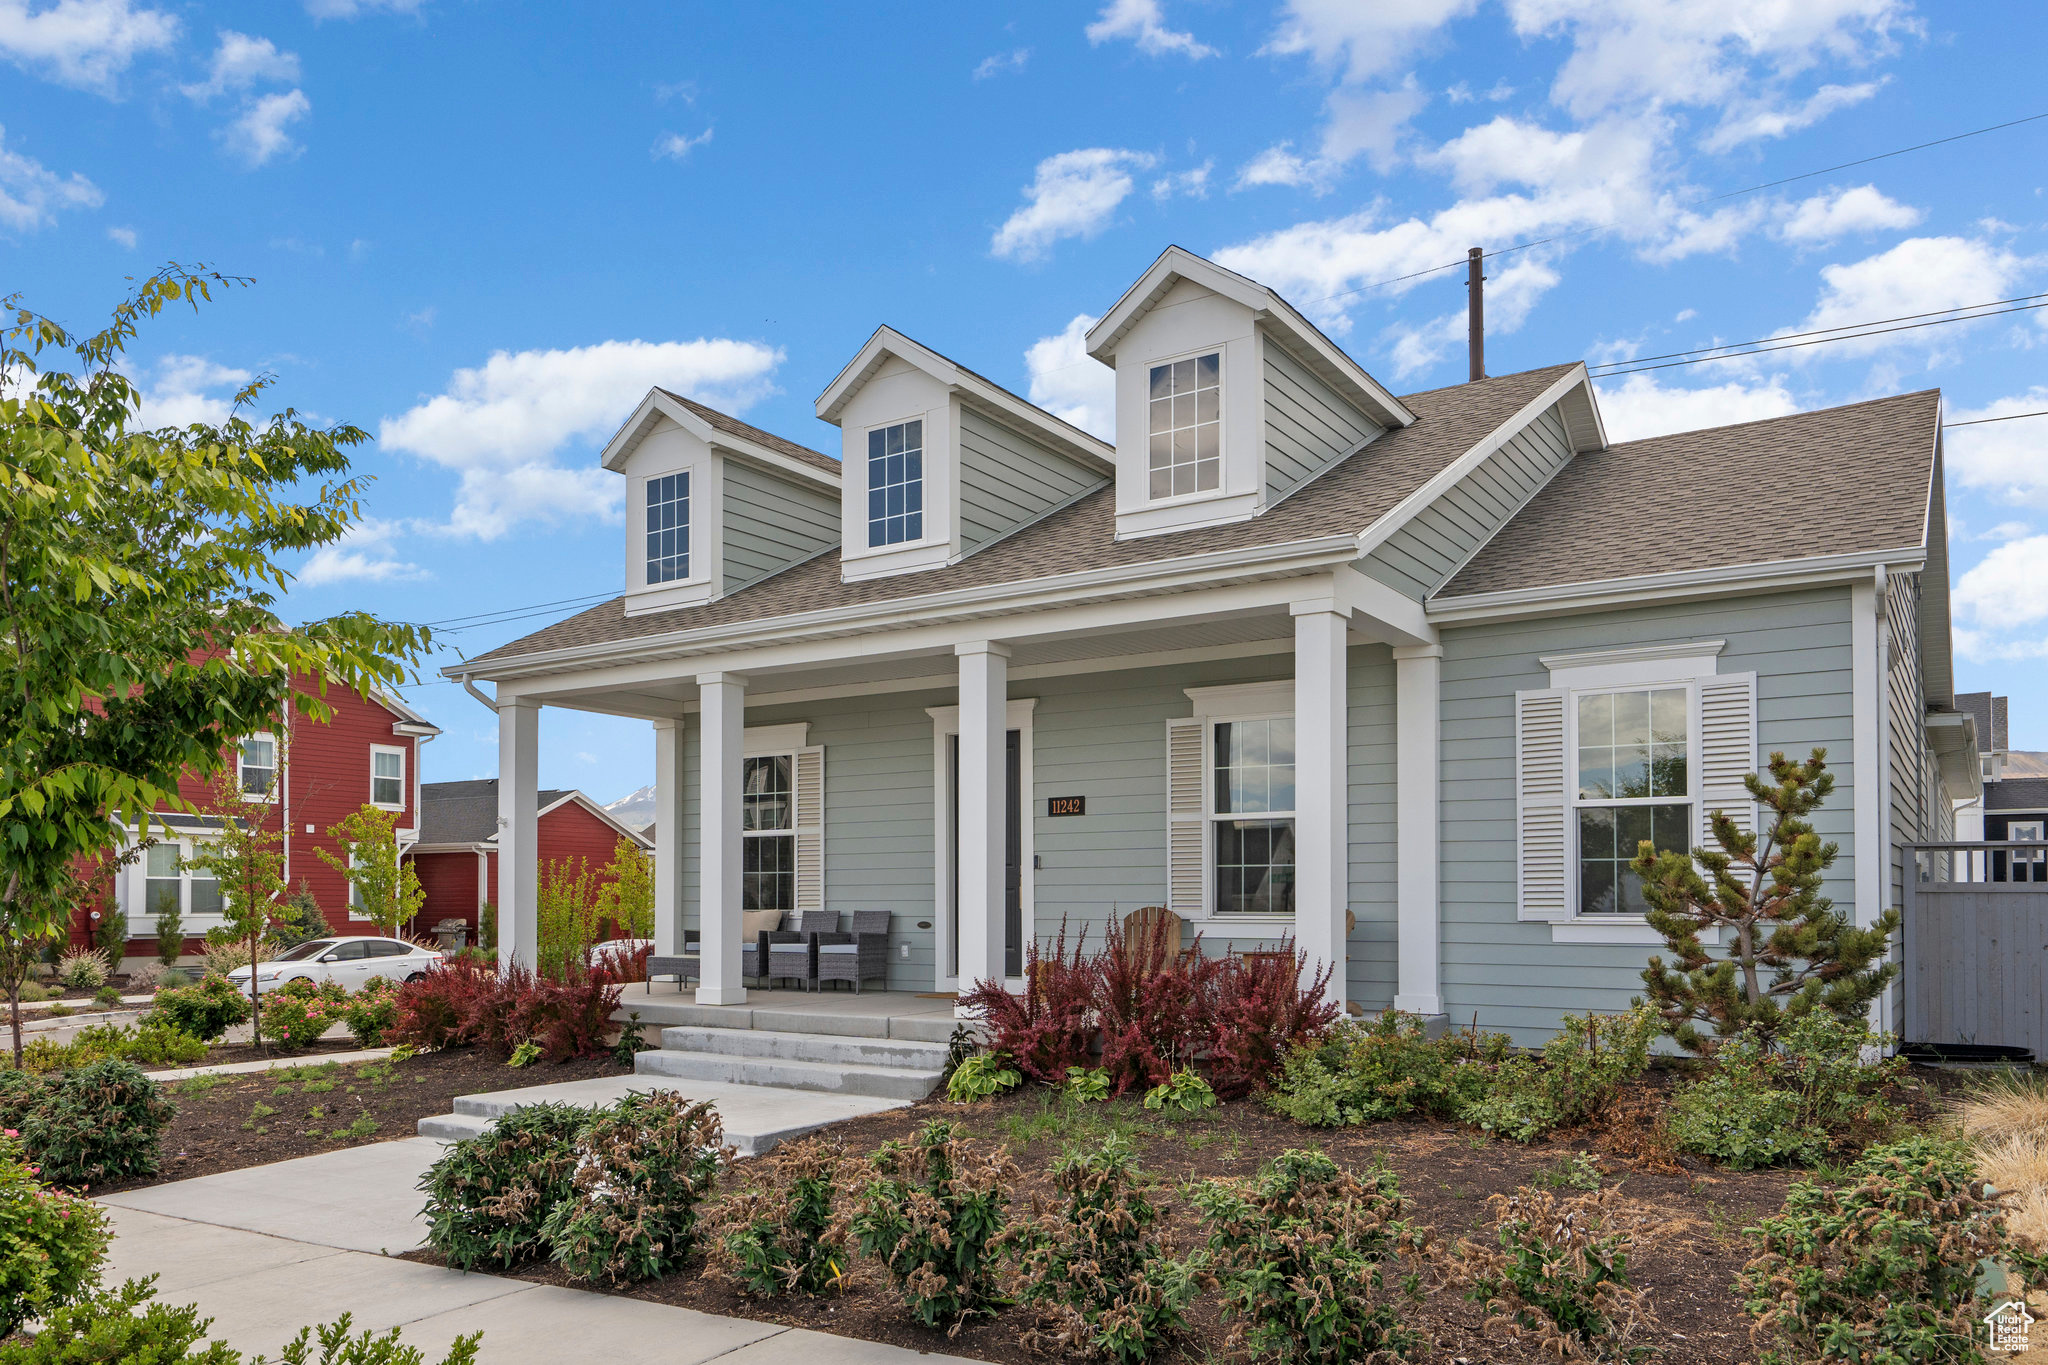
Active
$799,000
5
bds
|
4
ba
|
3,824
sqft
|
built
2021
11242 S Willow Walk Dr, South Jordan, UT 84009
$-2,850
Cash flow
-18.6%
Cash-on-Cash Return
2.0%
Cap rate
0.3%
Rent to Value Ratio
Active
$769,900
5
bds
|
3
ba
|
3,380
sqft
|
built
2019
5153 W Lake Terrace Ave, South Jordan, UT 84009
$-2,806
Cash flow
-19.0%
Cash-on-Cash Return
1.9%
Cap rate
0.3%
Rent to Value Ratio
Active
$454,900
3
bds
|
2
ba
|
1,415
sqft
|
built
2015
1741 W Nikos Ln, South Jordan, UT 84095
$-1,114
Cash flow
-12.8%
Cash-on-Cash Return
3.4%
Cap rate
0.5%
Rent to Value Ratio
Active
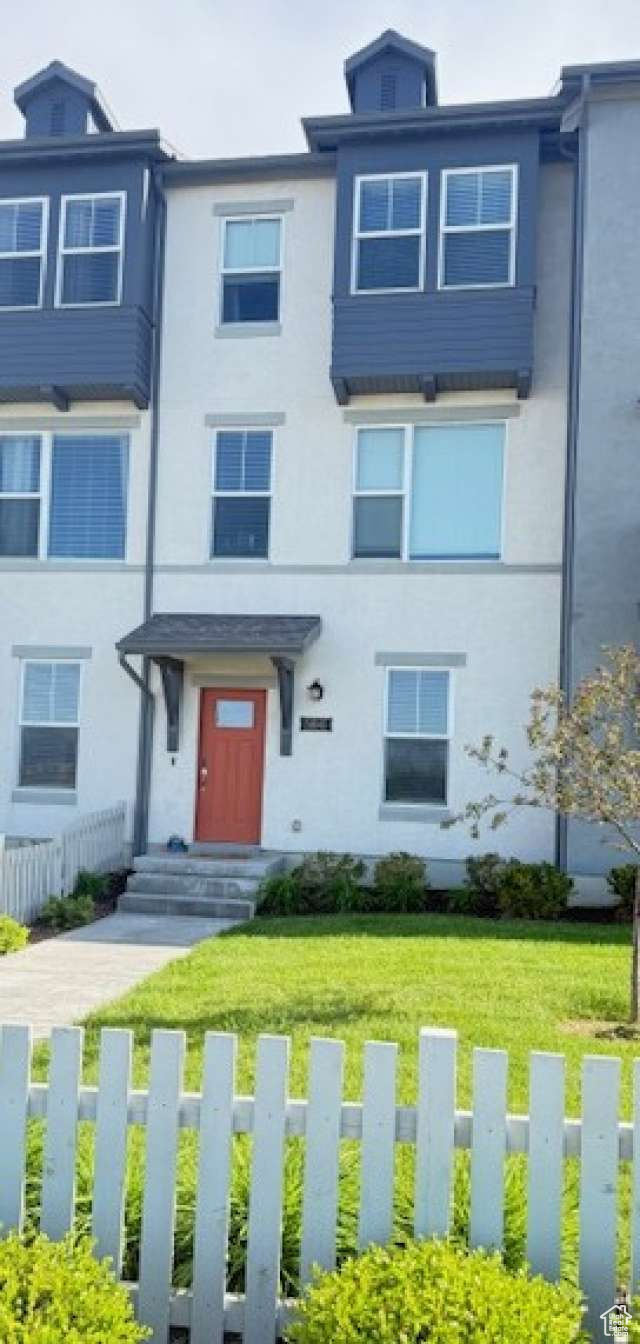
$440,000
2
bds
|
3
ba
|
1,750
sqft
|
built
2019
5841 W Lake Ave, South Jordan, UT 84009
$-1,182
Cash flow
-14.0%
Cash-on-Cash Return
3.1%
Cap rate
0.5%
Rent to Value Ratio
Active
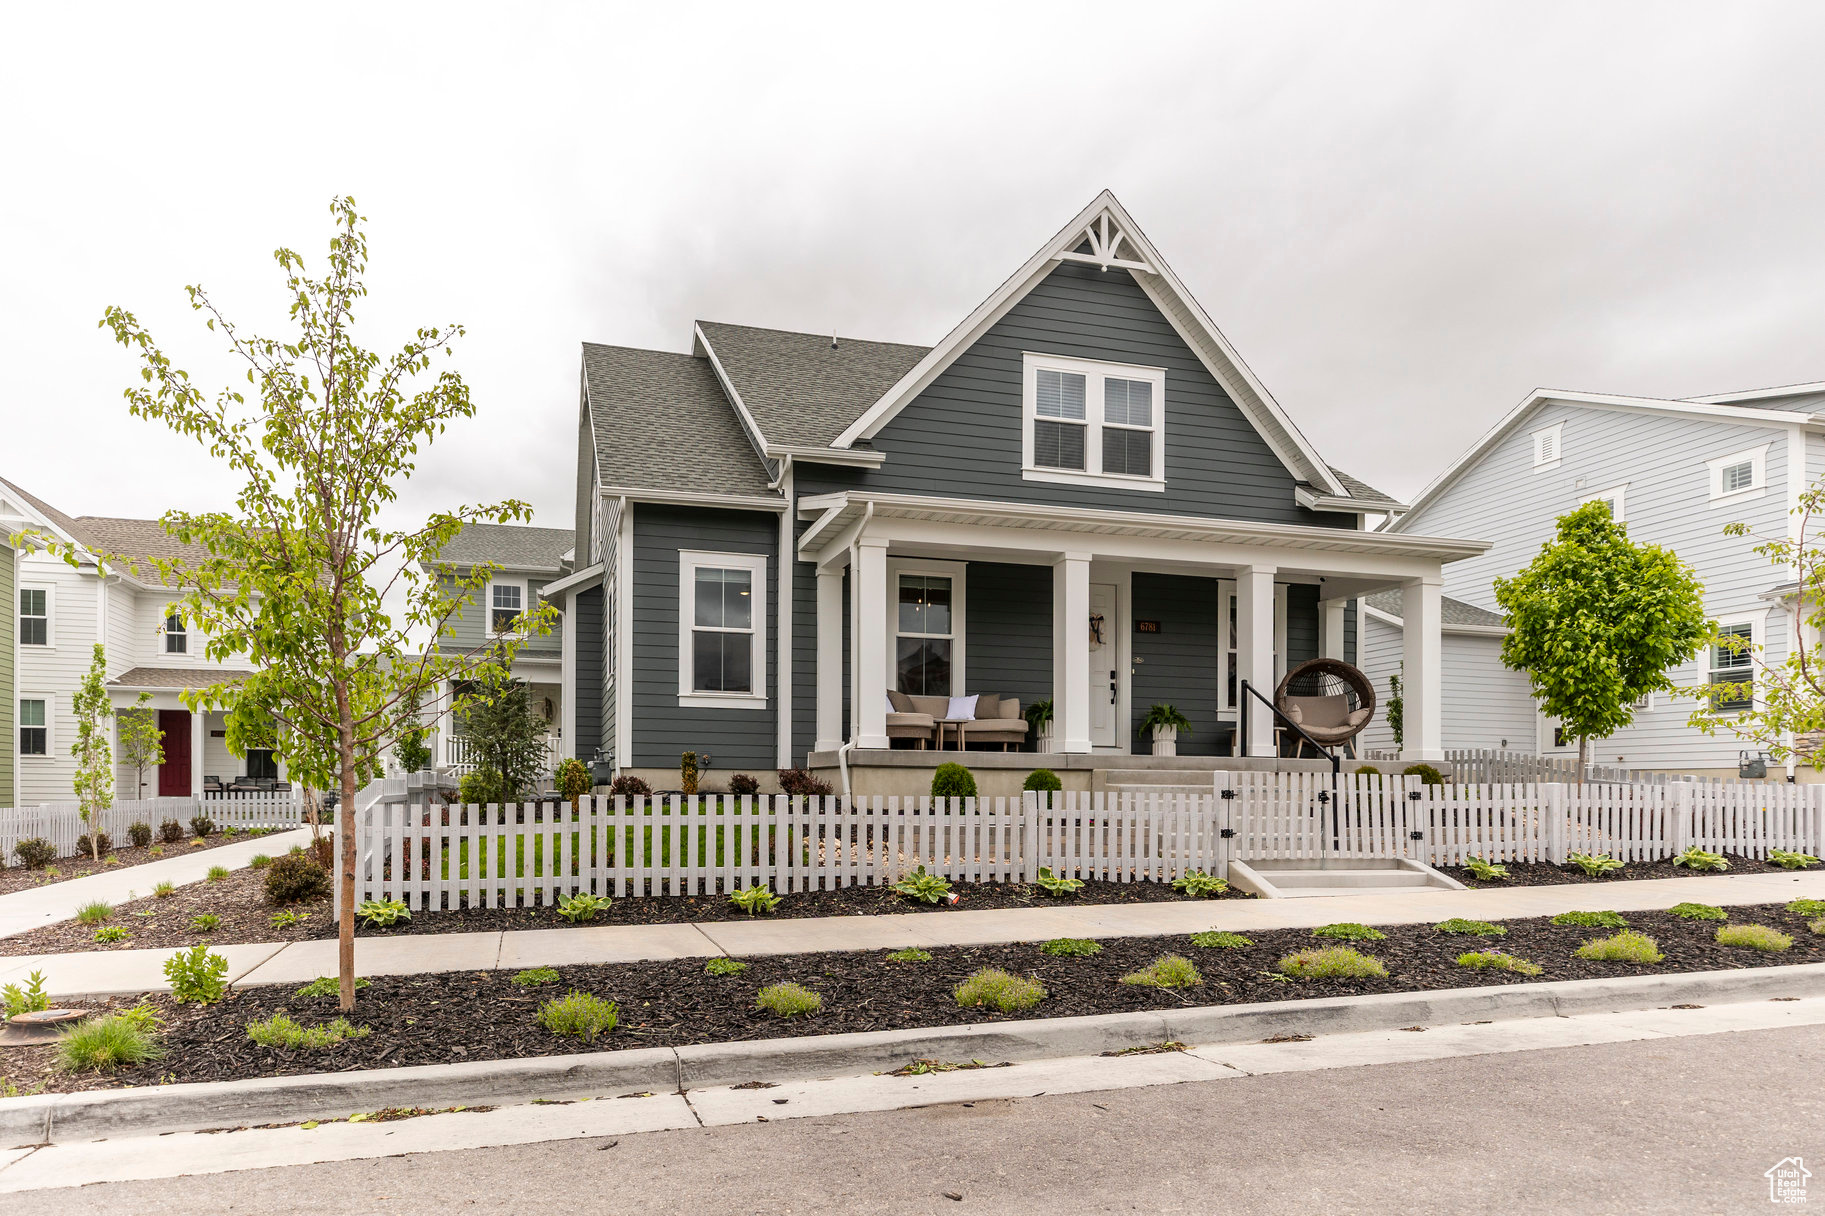
$725,000
4
bds
|
4
ba
|
3,080
sqft
|
built
2023
6781 W Meadow Grass Dr, South Jordan, UT 84009
$-1,505
Cash flow
-10.8%
Cash-on-Cash Return
3.8%
Cap rate
0.5%
Rent to Value Ratio
Active
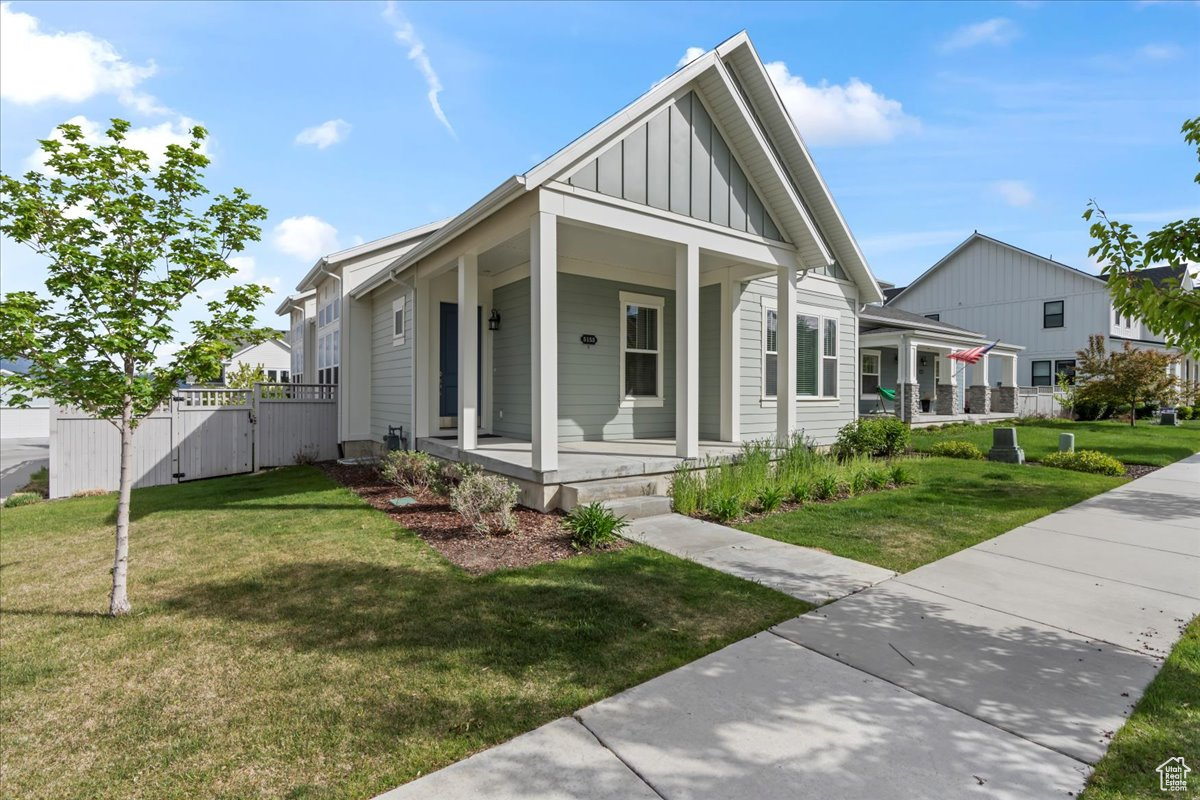
$469,900
3
bds
|
3
ba
|
1,812
sqft
|
built
2013
4811 W Daybreak Pkwy, South Jordan, UT 84009
$-1,264
Cash flow
-14.0%
Cash-on-Cash Return
3.1%
Cap rate
0.5%
Rent to Value Ratio
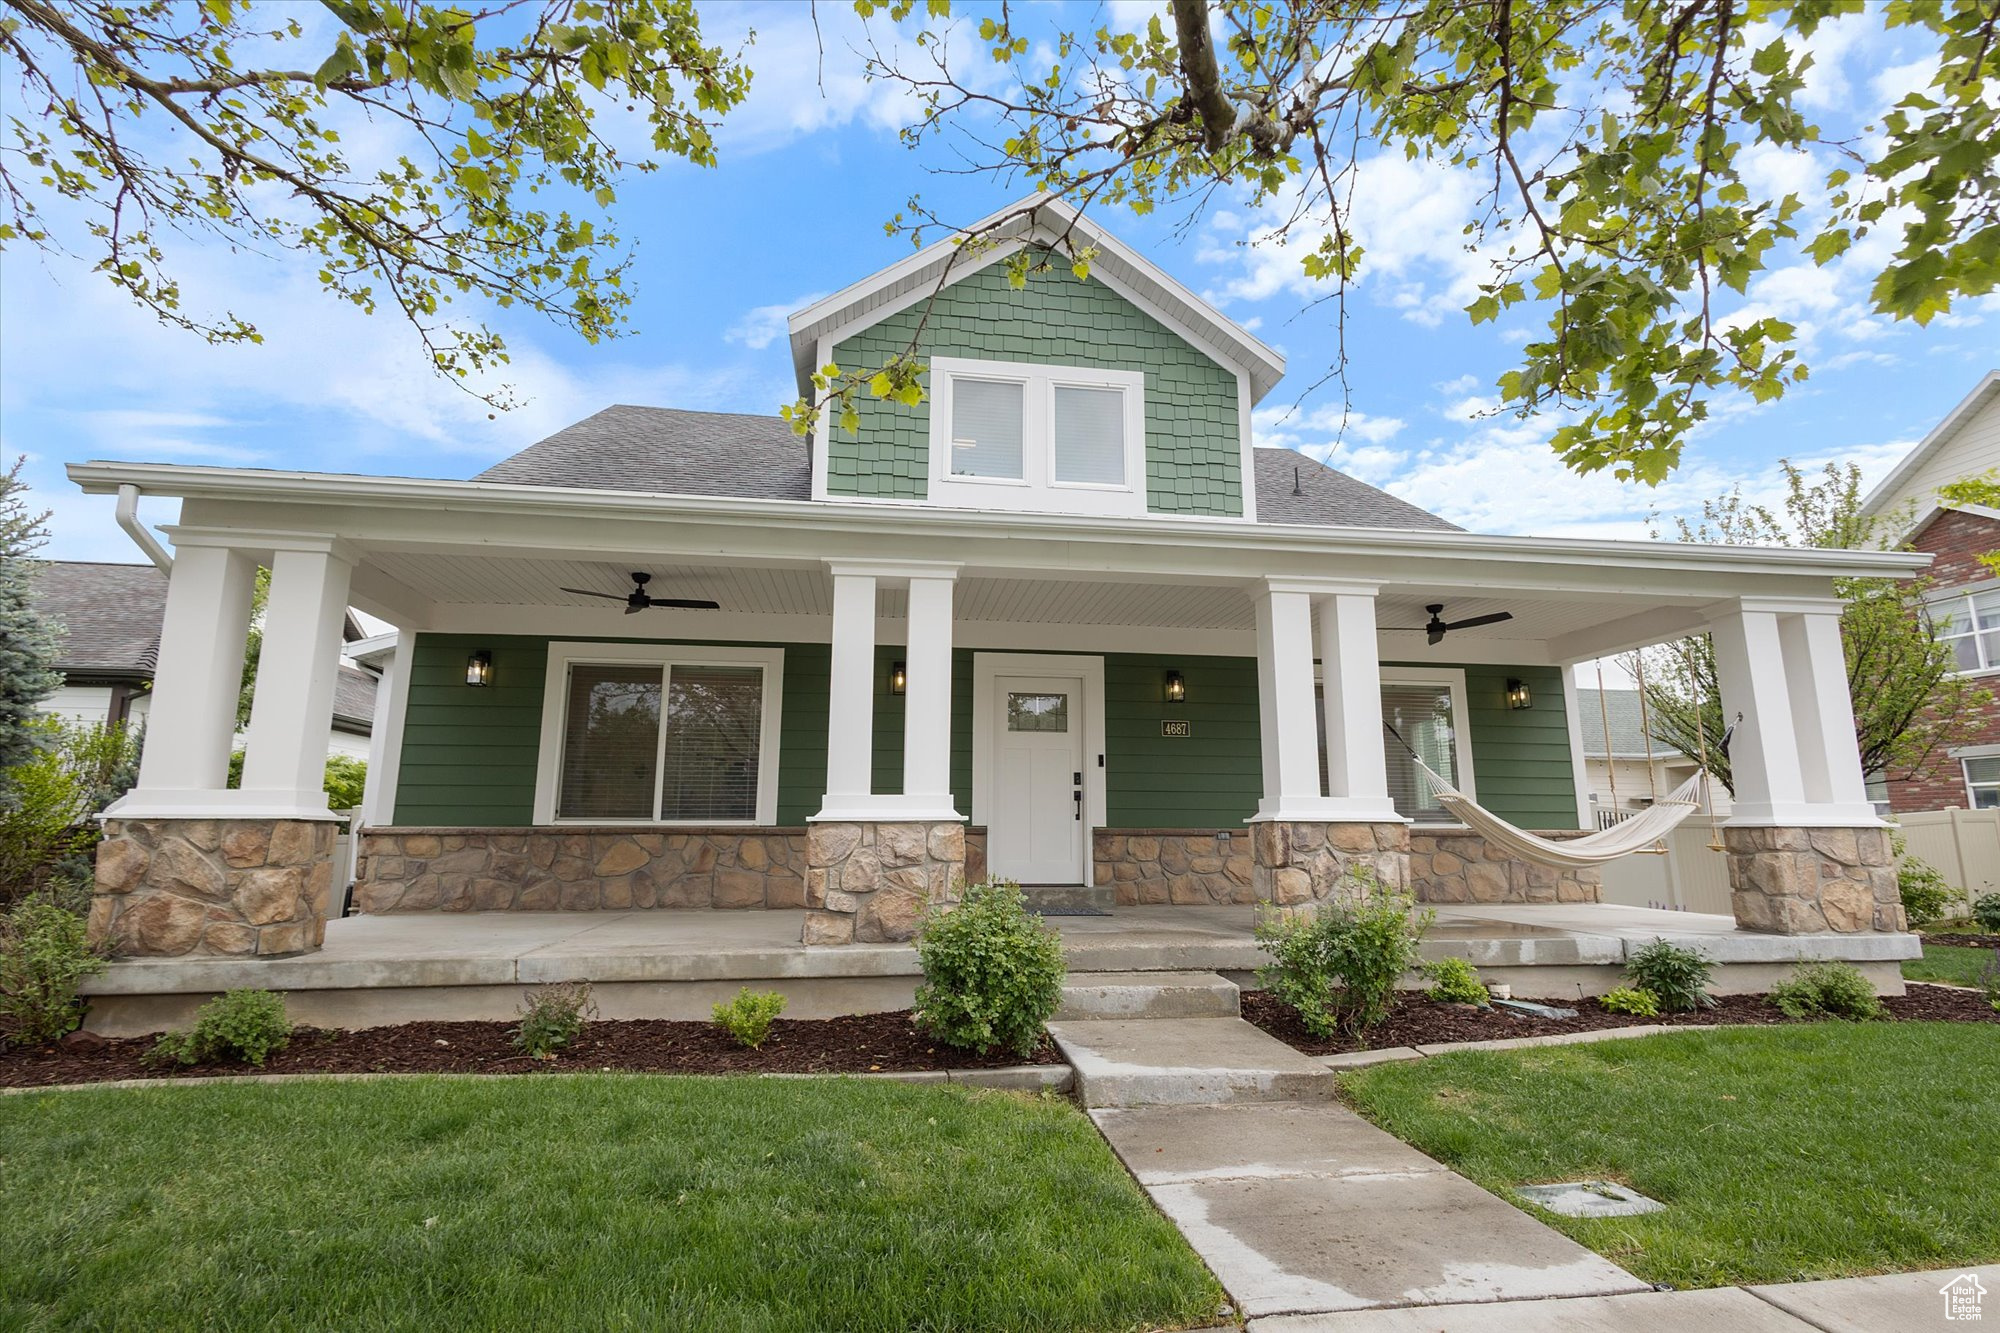
Active
$1,025,000
7
bds
|
4
ba
|
4,418
sqft
|
built
2005
4687 W Lumina Dr, South Jordan, UT 84009
$-3,597
Cash flow
-18.3%
Cash-on-Cash Return
2.1%
Cap rate
0.3%
Rent to Value Ratio
Active
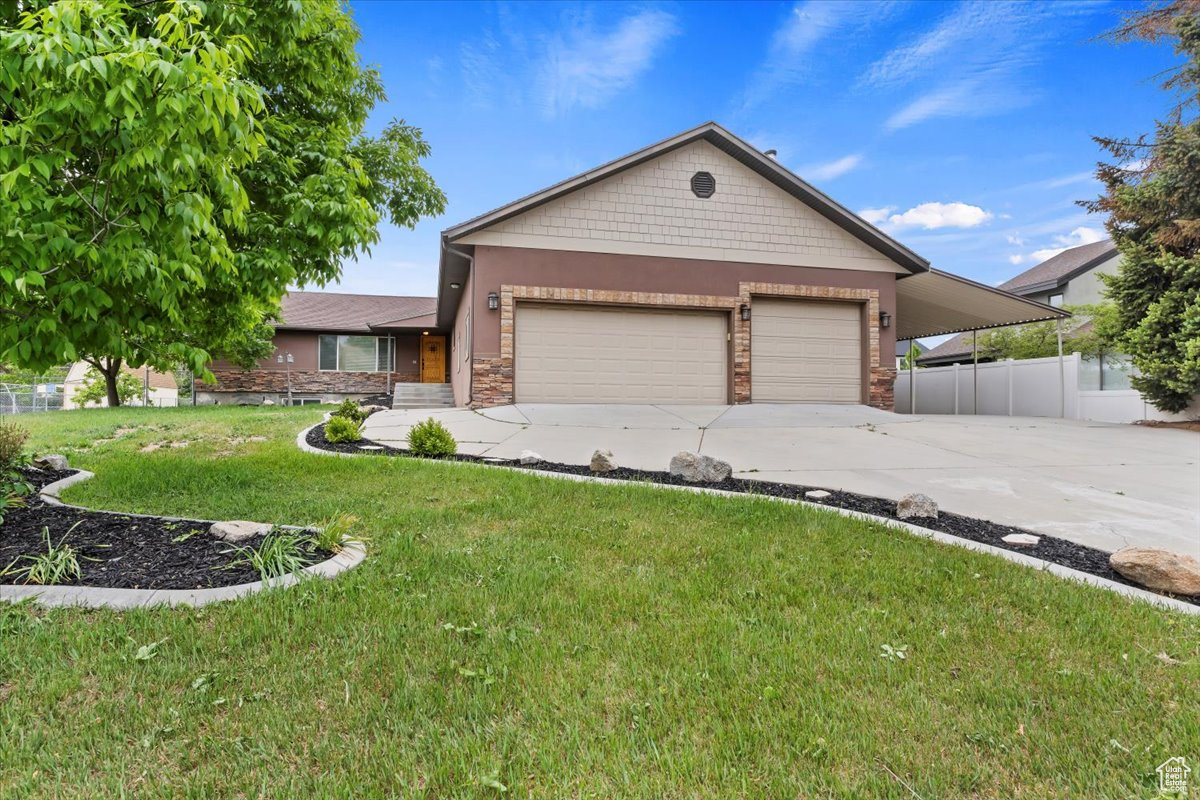
$464,900
3
bds
|
3
ba
|
2,204
sqft
|
built
2017
5059 W Daybreak Pkwy, South Jordan, UT 84009
$-1,170
Cash flow
-13.1%
Cash-on-Cash Return
3.3%
Cap rate
0.6%
Rent to Value Ratio
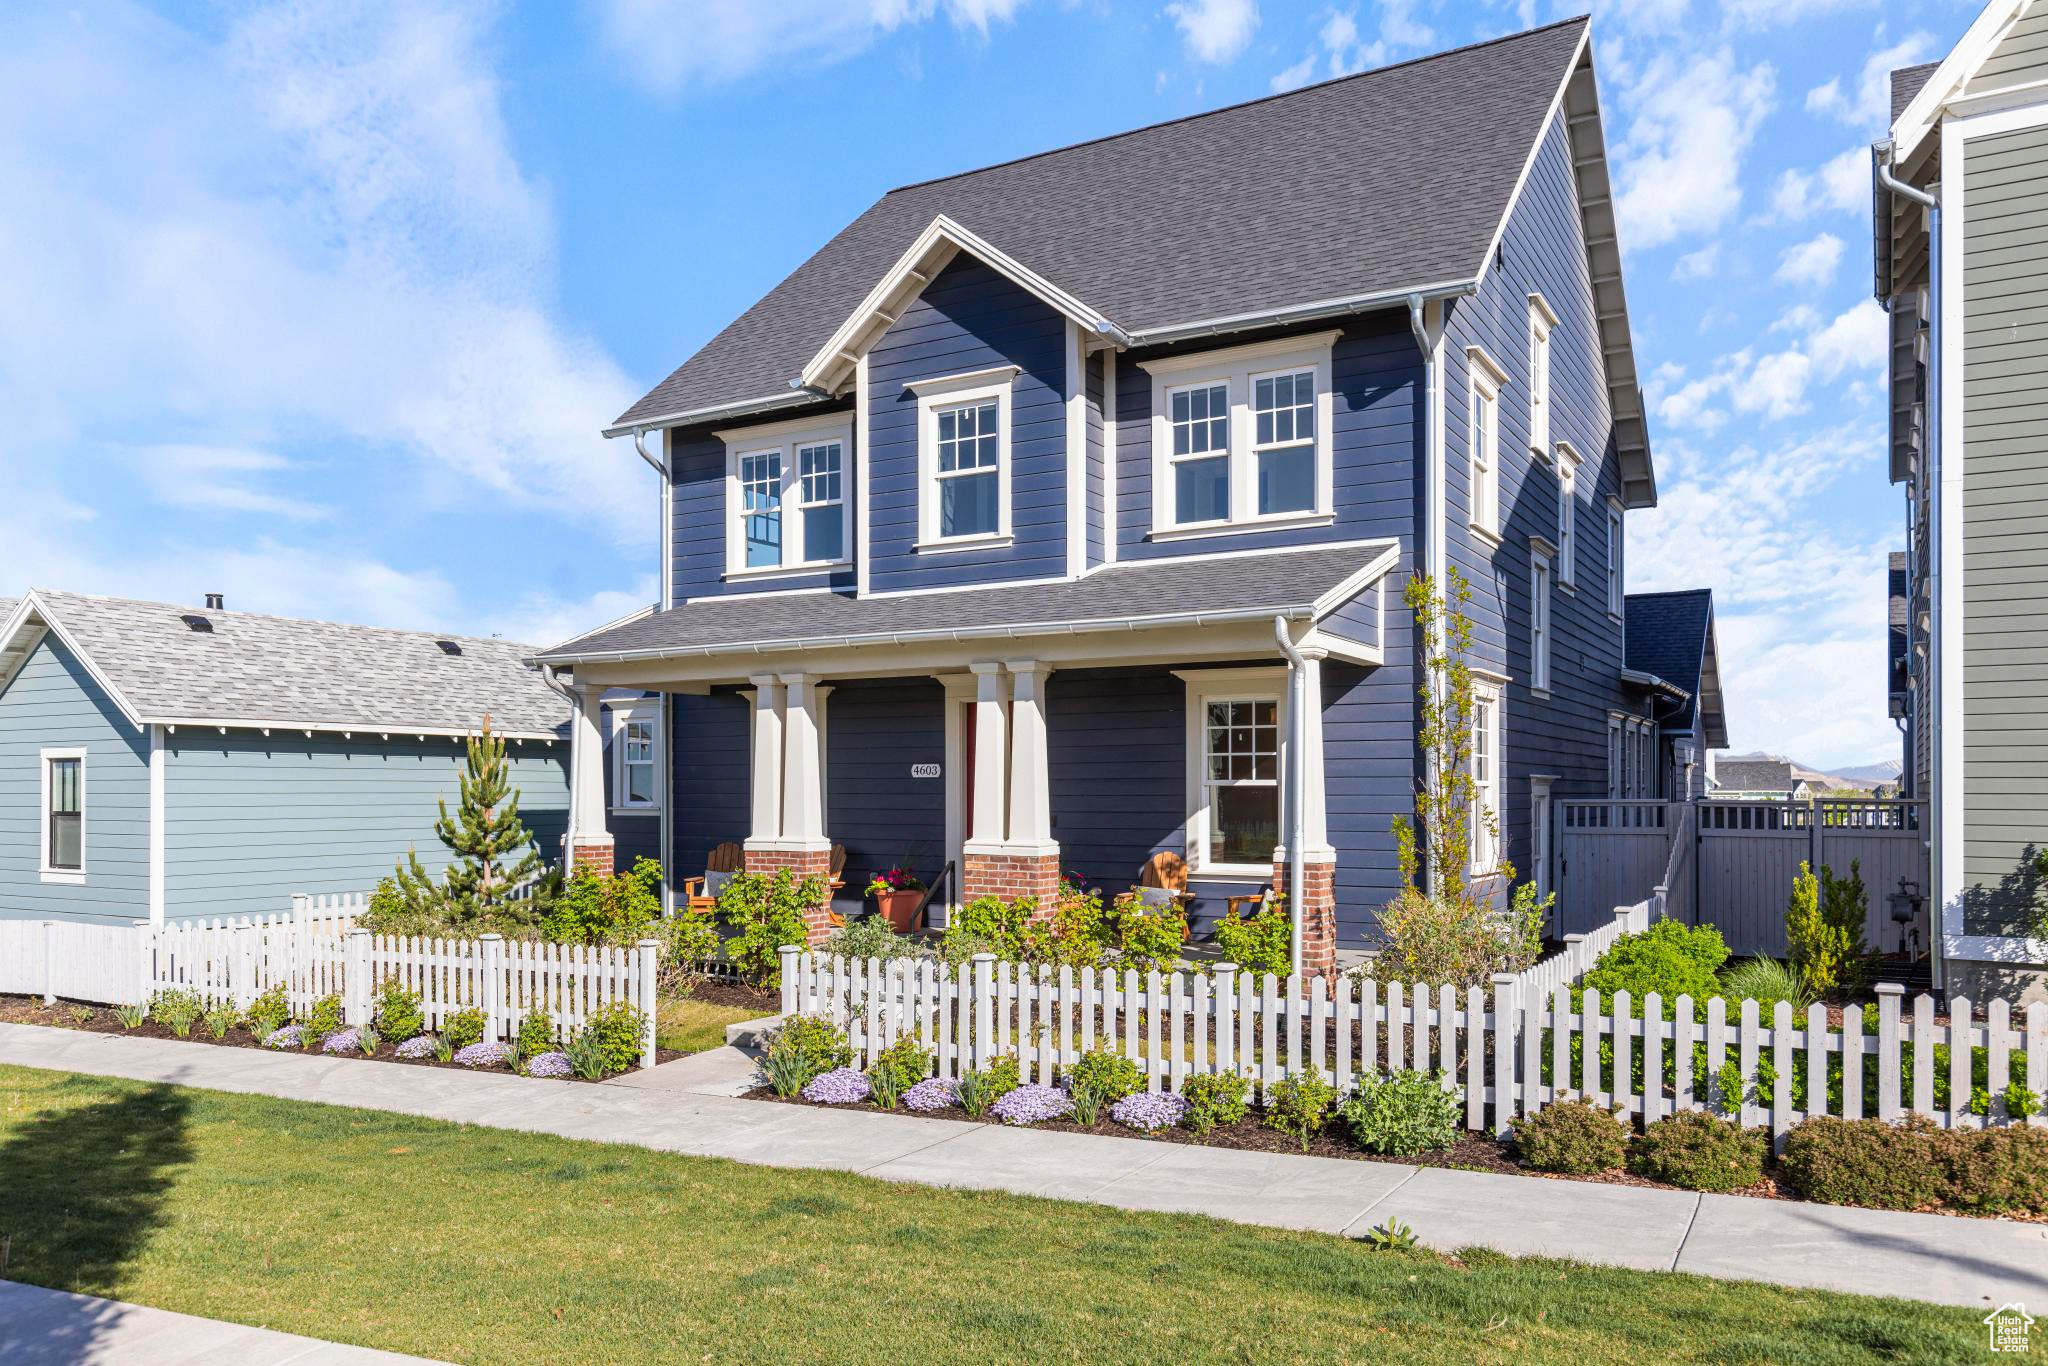
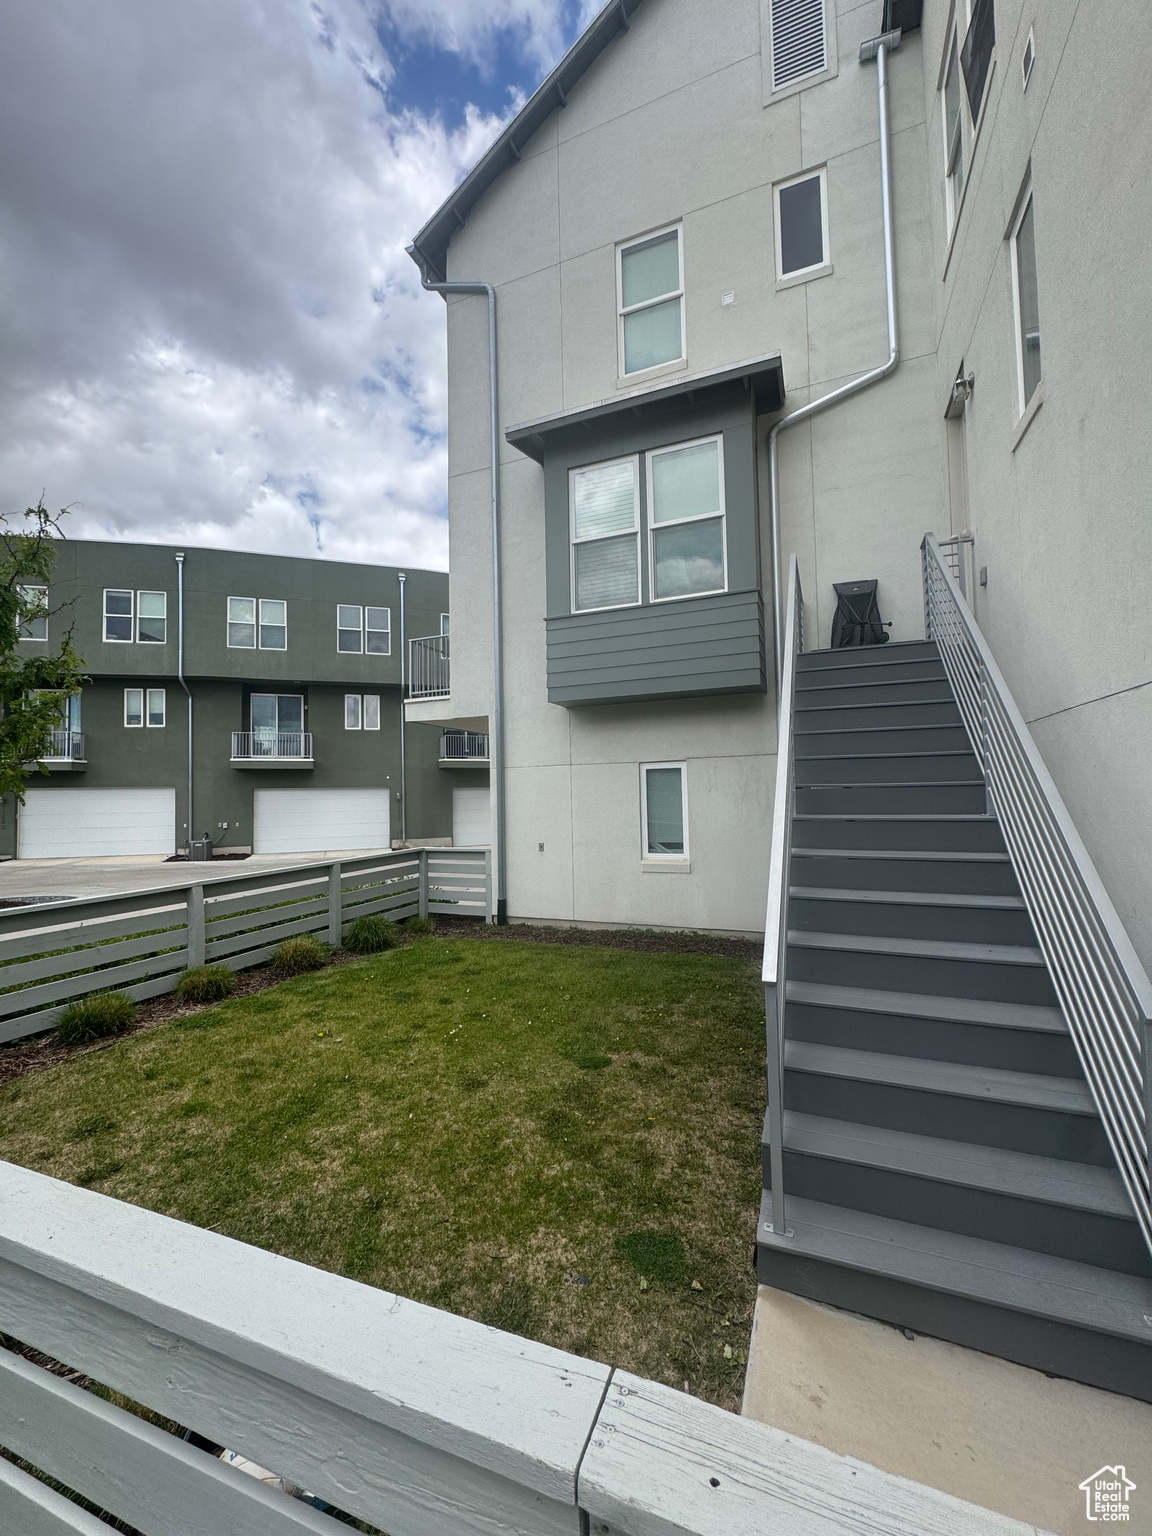
Active
$1,175,000
5
bds
|
5
ba
|
4,867
sqft
|
built
2020
4603 W Isla Daybreak Rd, South Jordan, UT 84009
$-3,450
Cash flow
-15.3%
Cash-on-Cash Return
2.8%
Cap rate
0.4%
Rent to Value Ratio
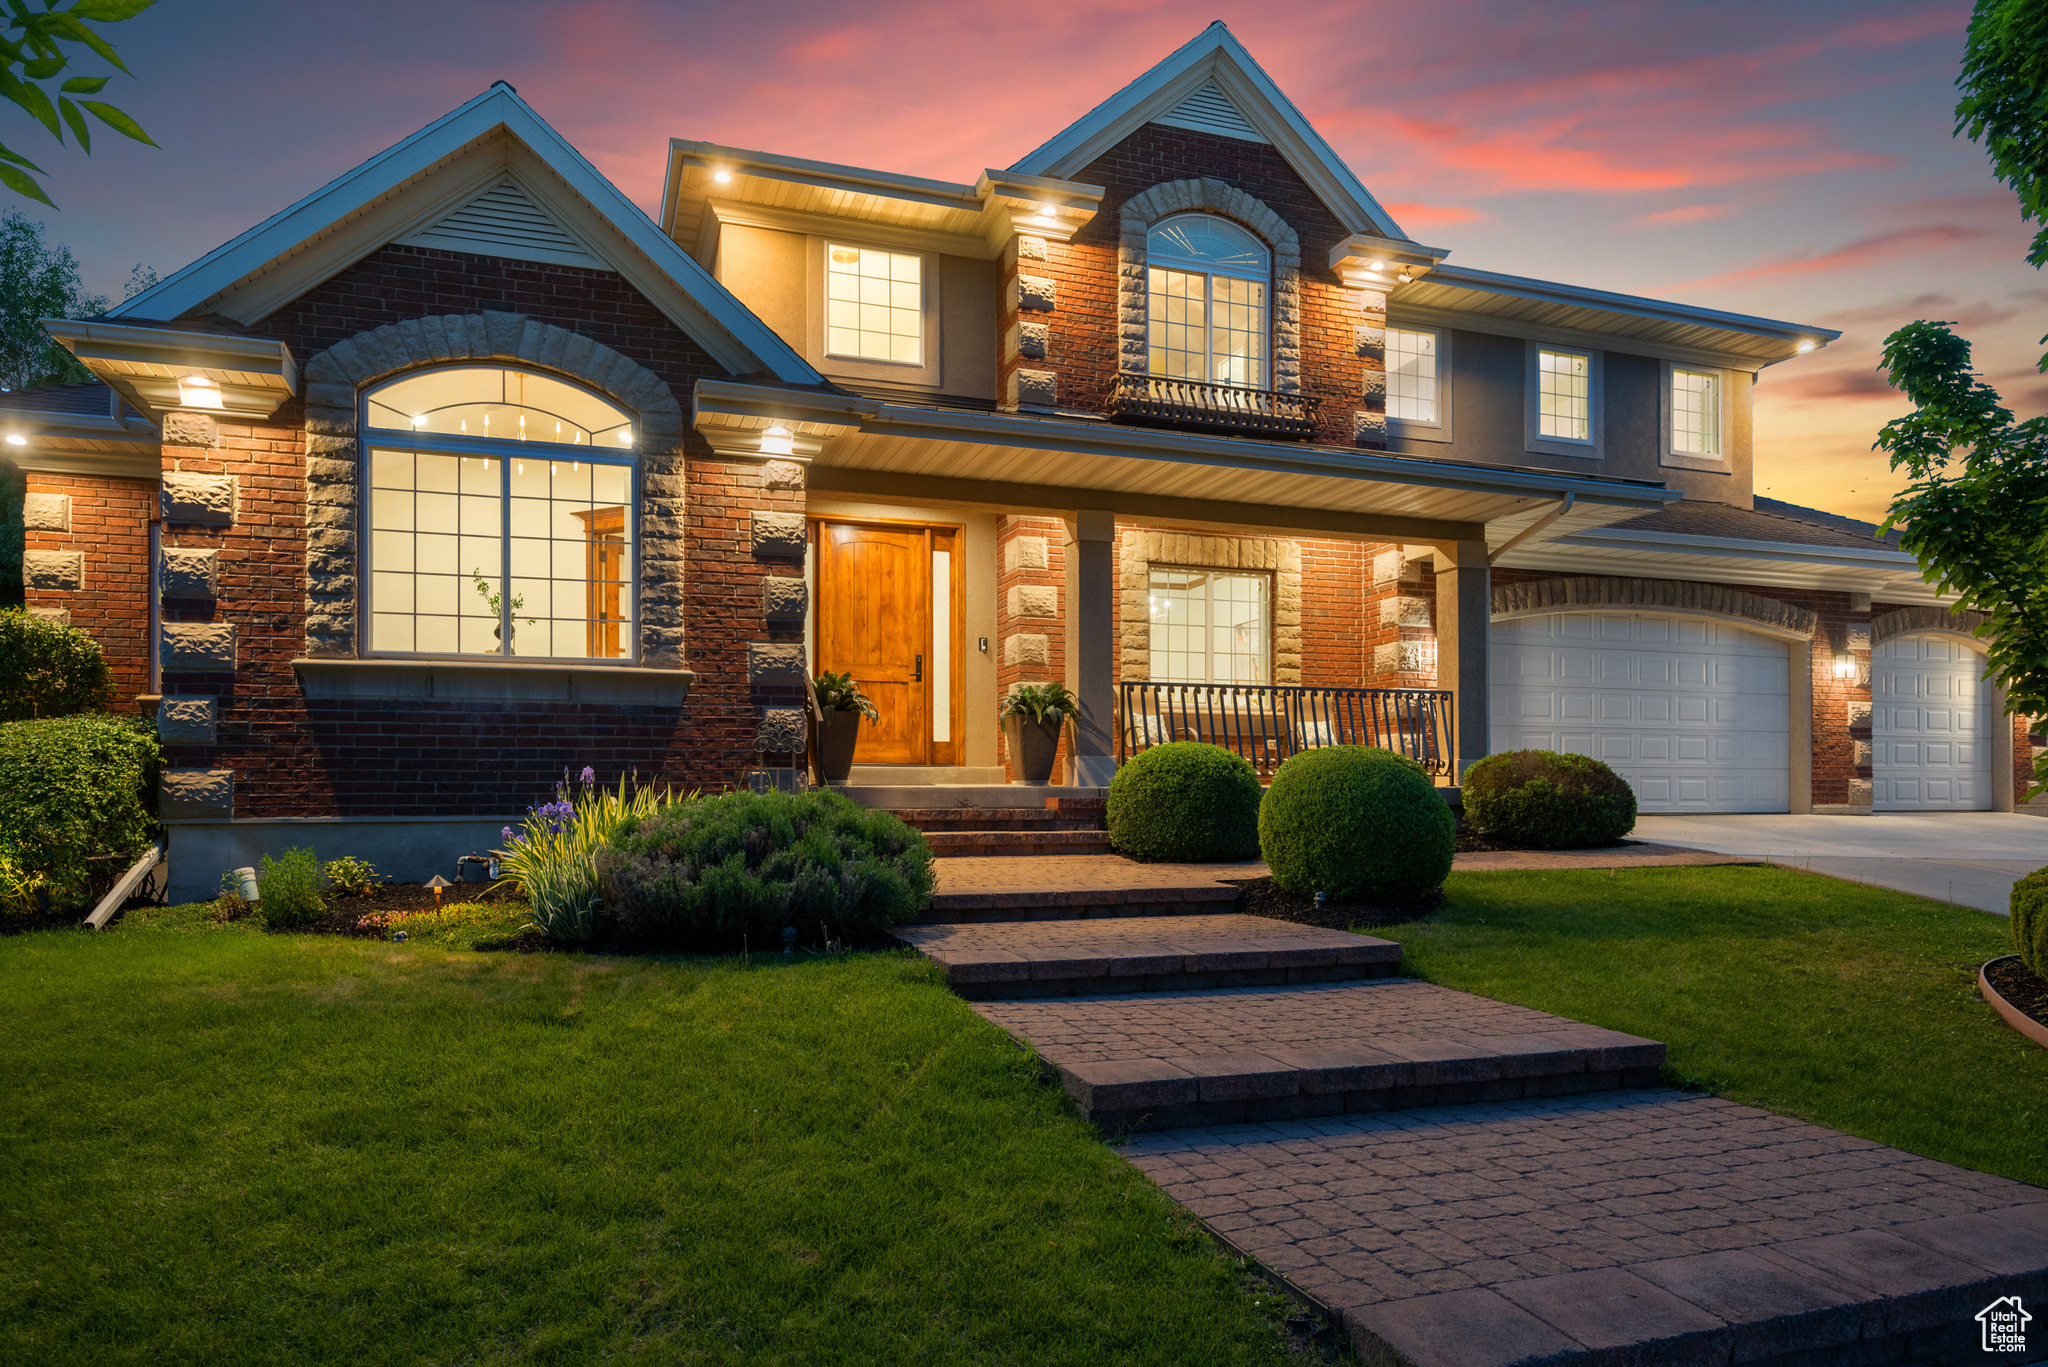
Active
$1,895,000
7
bds
|
8
ba
|
9,196
sqft
|
built
2007
11308 S Soldier Creek Ln, South Jordan, UT 84095
$-6,826
Cash flow
-18.8%
Cash-on-Cash Return
2.0%
Cap rate
0.3%
Rent to Value Ratio
Active
$917,000
7
bds
|
6
ba
|
4,672
sqft
|
built
1987
11526 S Equestrian Dr, South Jordan, UT 84095
$-2,691
Cash flow
-15.3%
Cash-on-Cash Return
2.8%
Cap rate
0.4%
Rent to Value Ratio
Active
$519,900
3
bds
|
3
ba
|
2,072
sqft
|
built
2019
5054 W Duckhorn Dr, South Jordan, UT 84009
$-1,290
Cash flow
-12.9%
Cash-on-Cash Return
3.3%
Cap rate
0.5%
Rent to Value Ratio
Active
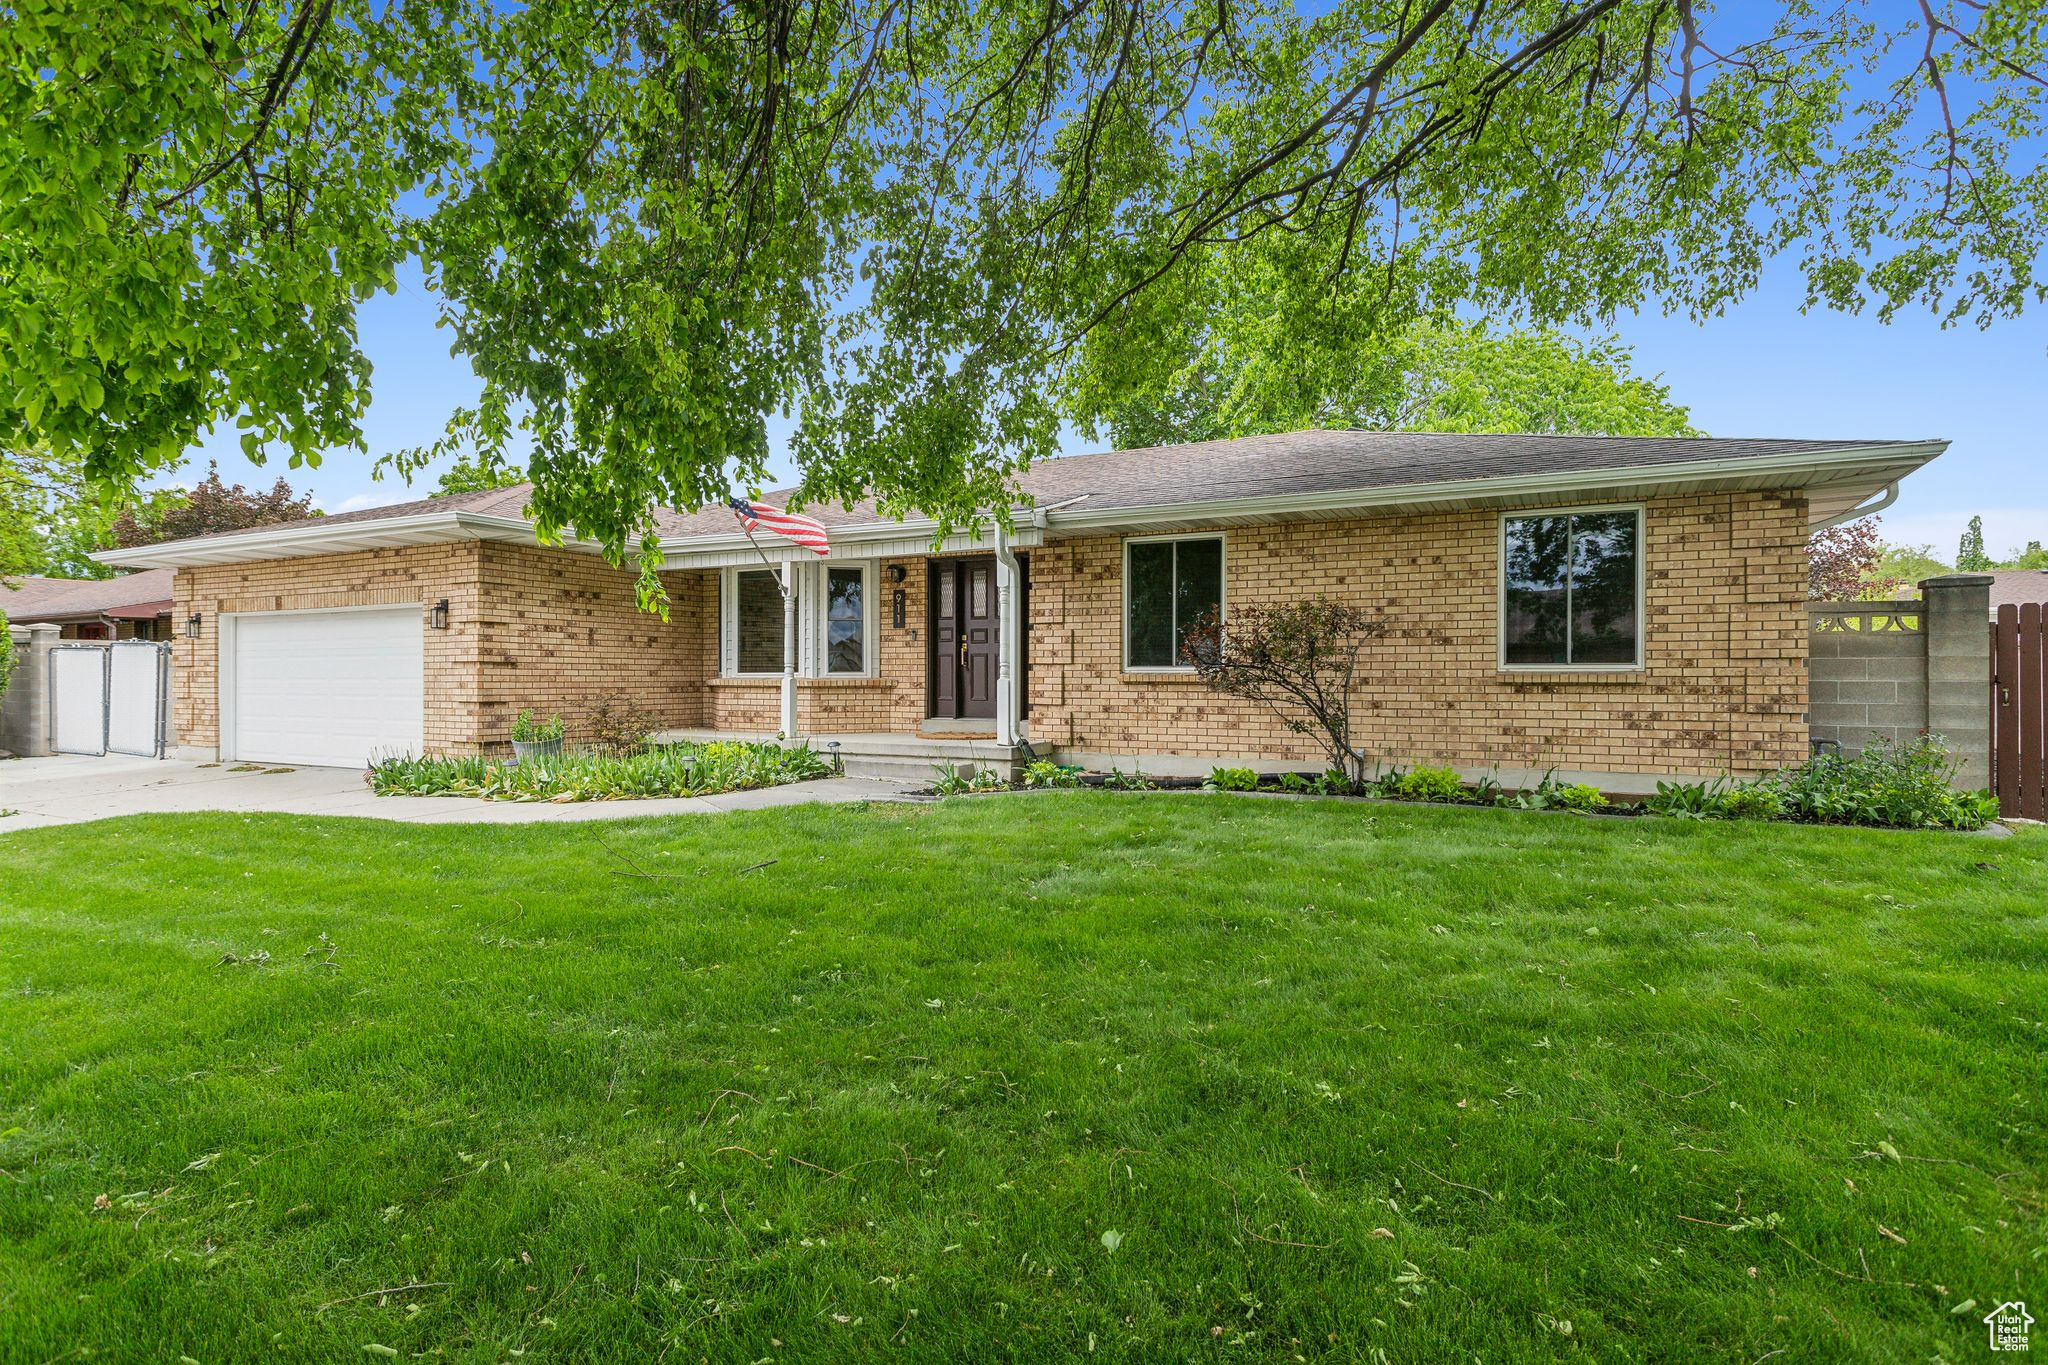
$850,000
5
bds
|
3
ba
|
3,827
sqft
|
built
1985
911 W Brookcrest Cir, South Jordan, UT 84095
$-2,278
Cash flow
-14.0%
Cash-on-Cash Return
3.1%
Cap rate
0.4%
Rent to Value Ratio
Active
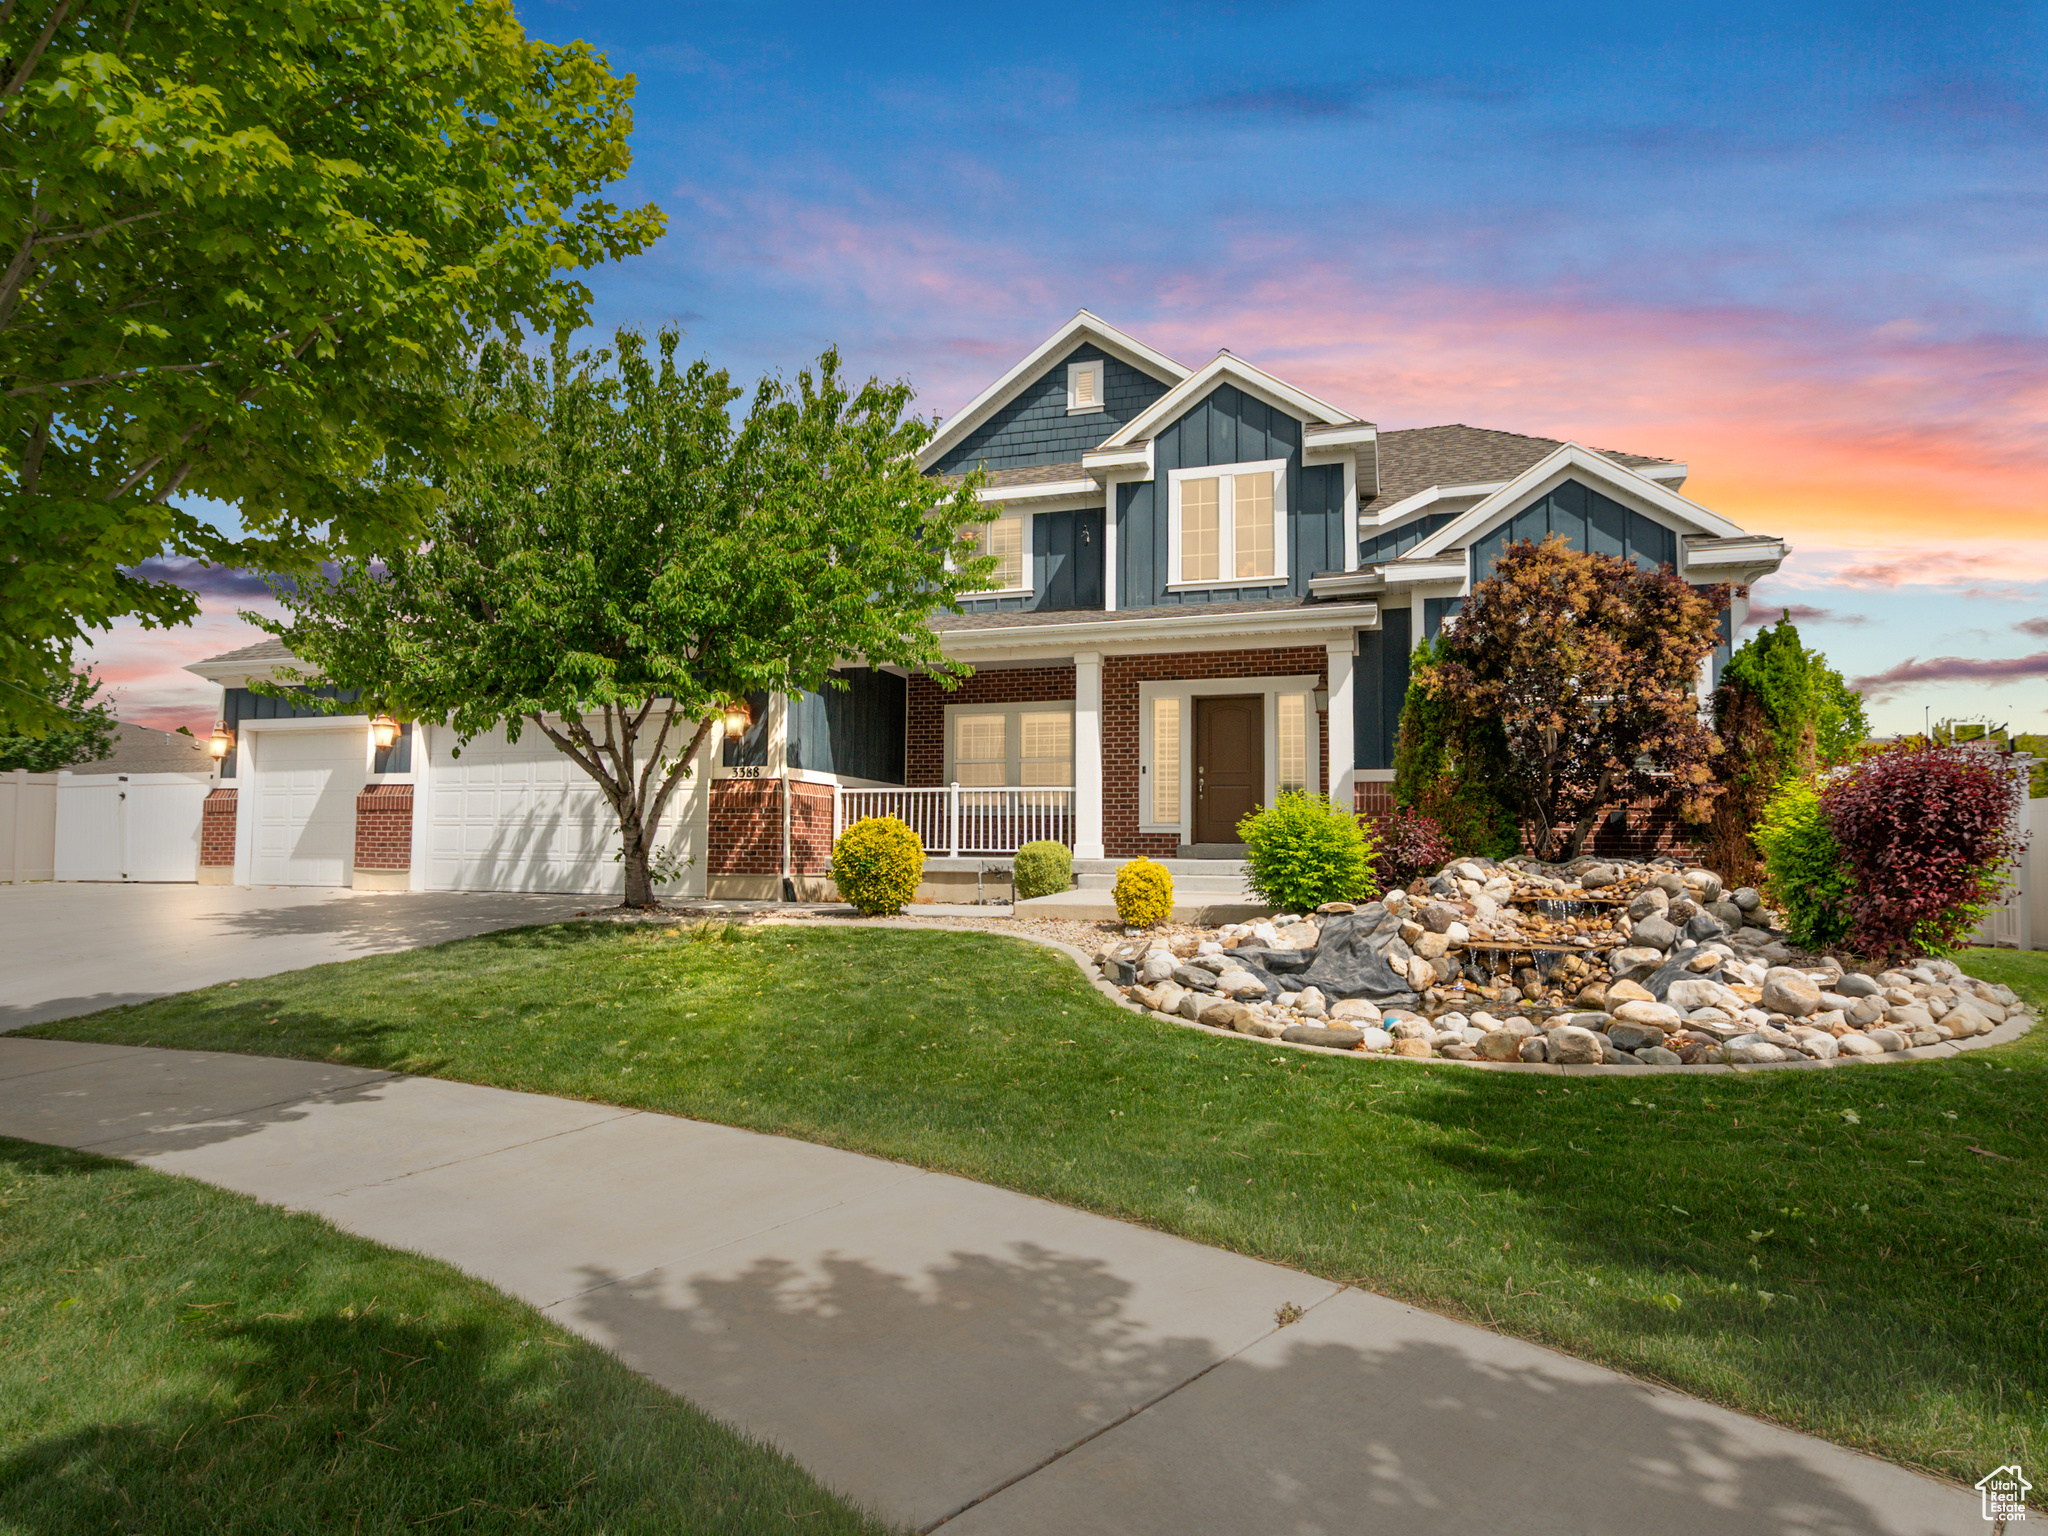
$1,300,000
7
bds
|
5
ba
|
5,286
sqft
|
built
2013
3388 W Rocky Peak Way, South Jordan, UT 84095
$-4,793
Cash flow
-19.2%
Cash-on-Cash Return
1.9%
Cap rate
0.3%
Rent to Value Ratio
Active
$534,000
5
bds
|
4
ba
|
2,461
sqft
|
built
2009
10342 S Millerton Dr, South Jordan, UT 84009
$-1,373
Cash flow
-13.4%
Cash-on-Cash Return
3.2%
Cap rate
0.5%
Rent to Value Ratio

Active
$849,000
5
bds
|
3
ba
|
4,036
sqft
|
built
2007
11096 S Cadbury Dr, South Jordan, UT 84095
$-2,015
Cash flow
-12.4%
Cash-on-Cash Return
3.4%
Cap rate
0.5%
Rent to Value Ratio
Active
$989,900
7
bds
|
5
ba
|
4,244
sqft
|
built
1994
9496 S 1930 W, South Jordan, UT 84095
$-2,737
Cash flow
-14.4%
Cash-on-Cash Return
3.0%
Cap rate
0.4%
Rent to Value Ratio
Active
$2,288,887
5
bds
|
6
ba
|
7,140
sqft
|
built
1996
11131 S Palisade Rim Cir, South Jordan, UT 84095
$-7,131
Cash flow
-16.3%
Cash-on-Cash Return
2.6%
Cap rate
0.3%
Rent to Value Ratio
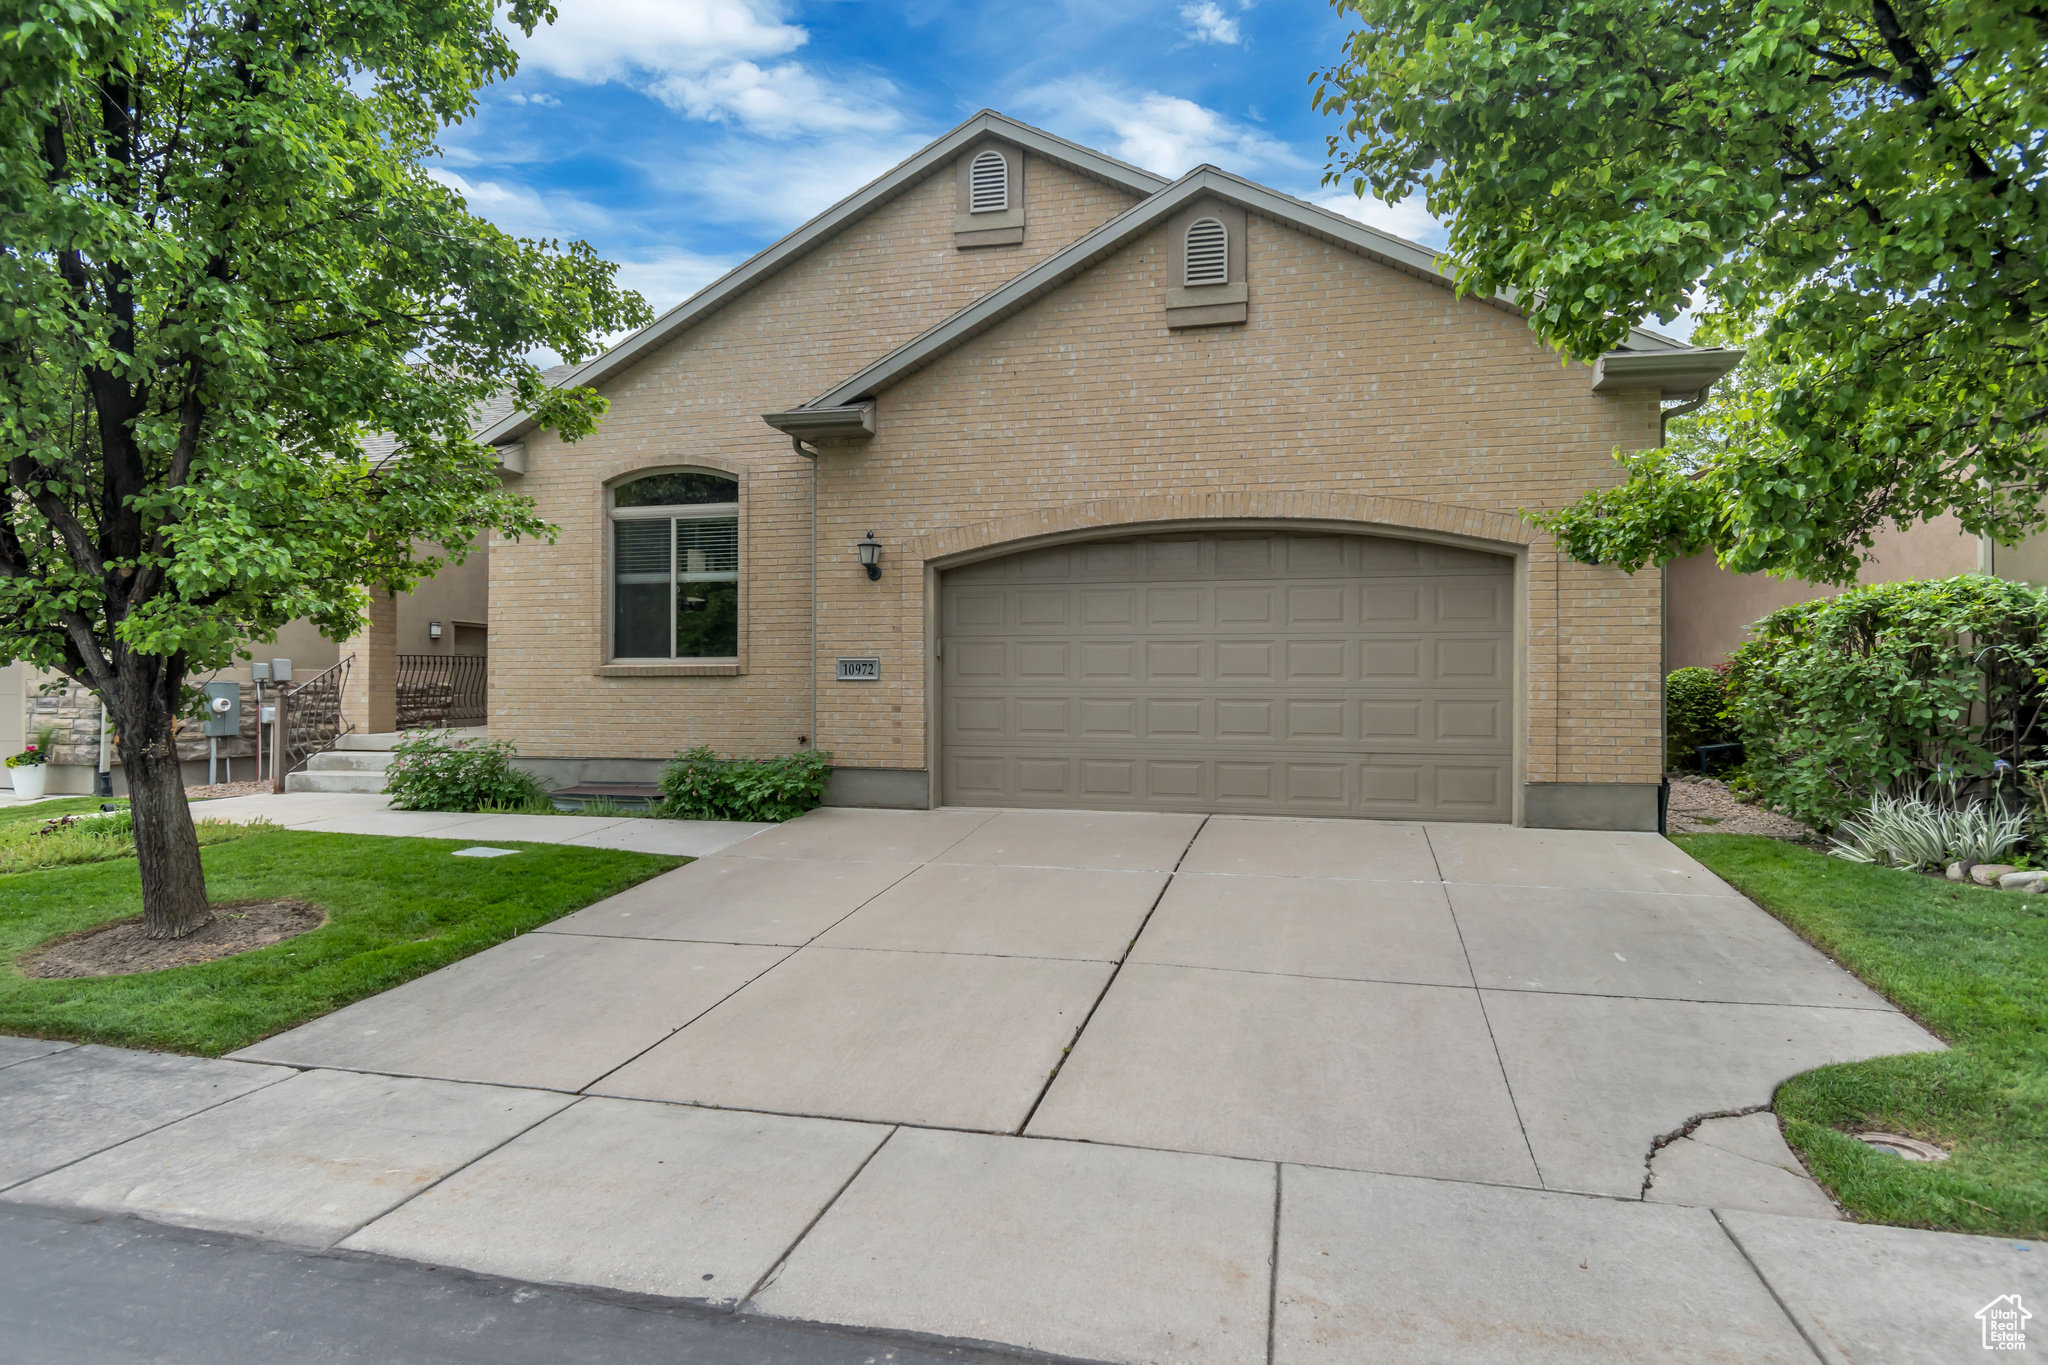
Active
$650,000
5
bds
|
3
ba
|
2,828
sqft
|
built
2005
10972 S Crystal View Way, South Jordan, UT 84095
$-2,394
Cash flow
-19.2%
Cash-on-Cash Return
1.9%
Cap rate
0.3%
Rent to Value Ratio
Active
$875,000
6
bds
|
4
ba
|
3,936
sqft
|
built
1972
1181 W Koradine Dr, South Jordan, UT 84095
$-3,361
Cash flow
-20.0%
Cash-on-Cash Return
1.7%
Cap rate
0.3%
Rent to Value Ratio
Active
$1,100,000
5
bds
|
3
ba
|
4,284
sqft
|
built
1992
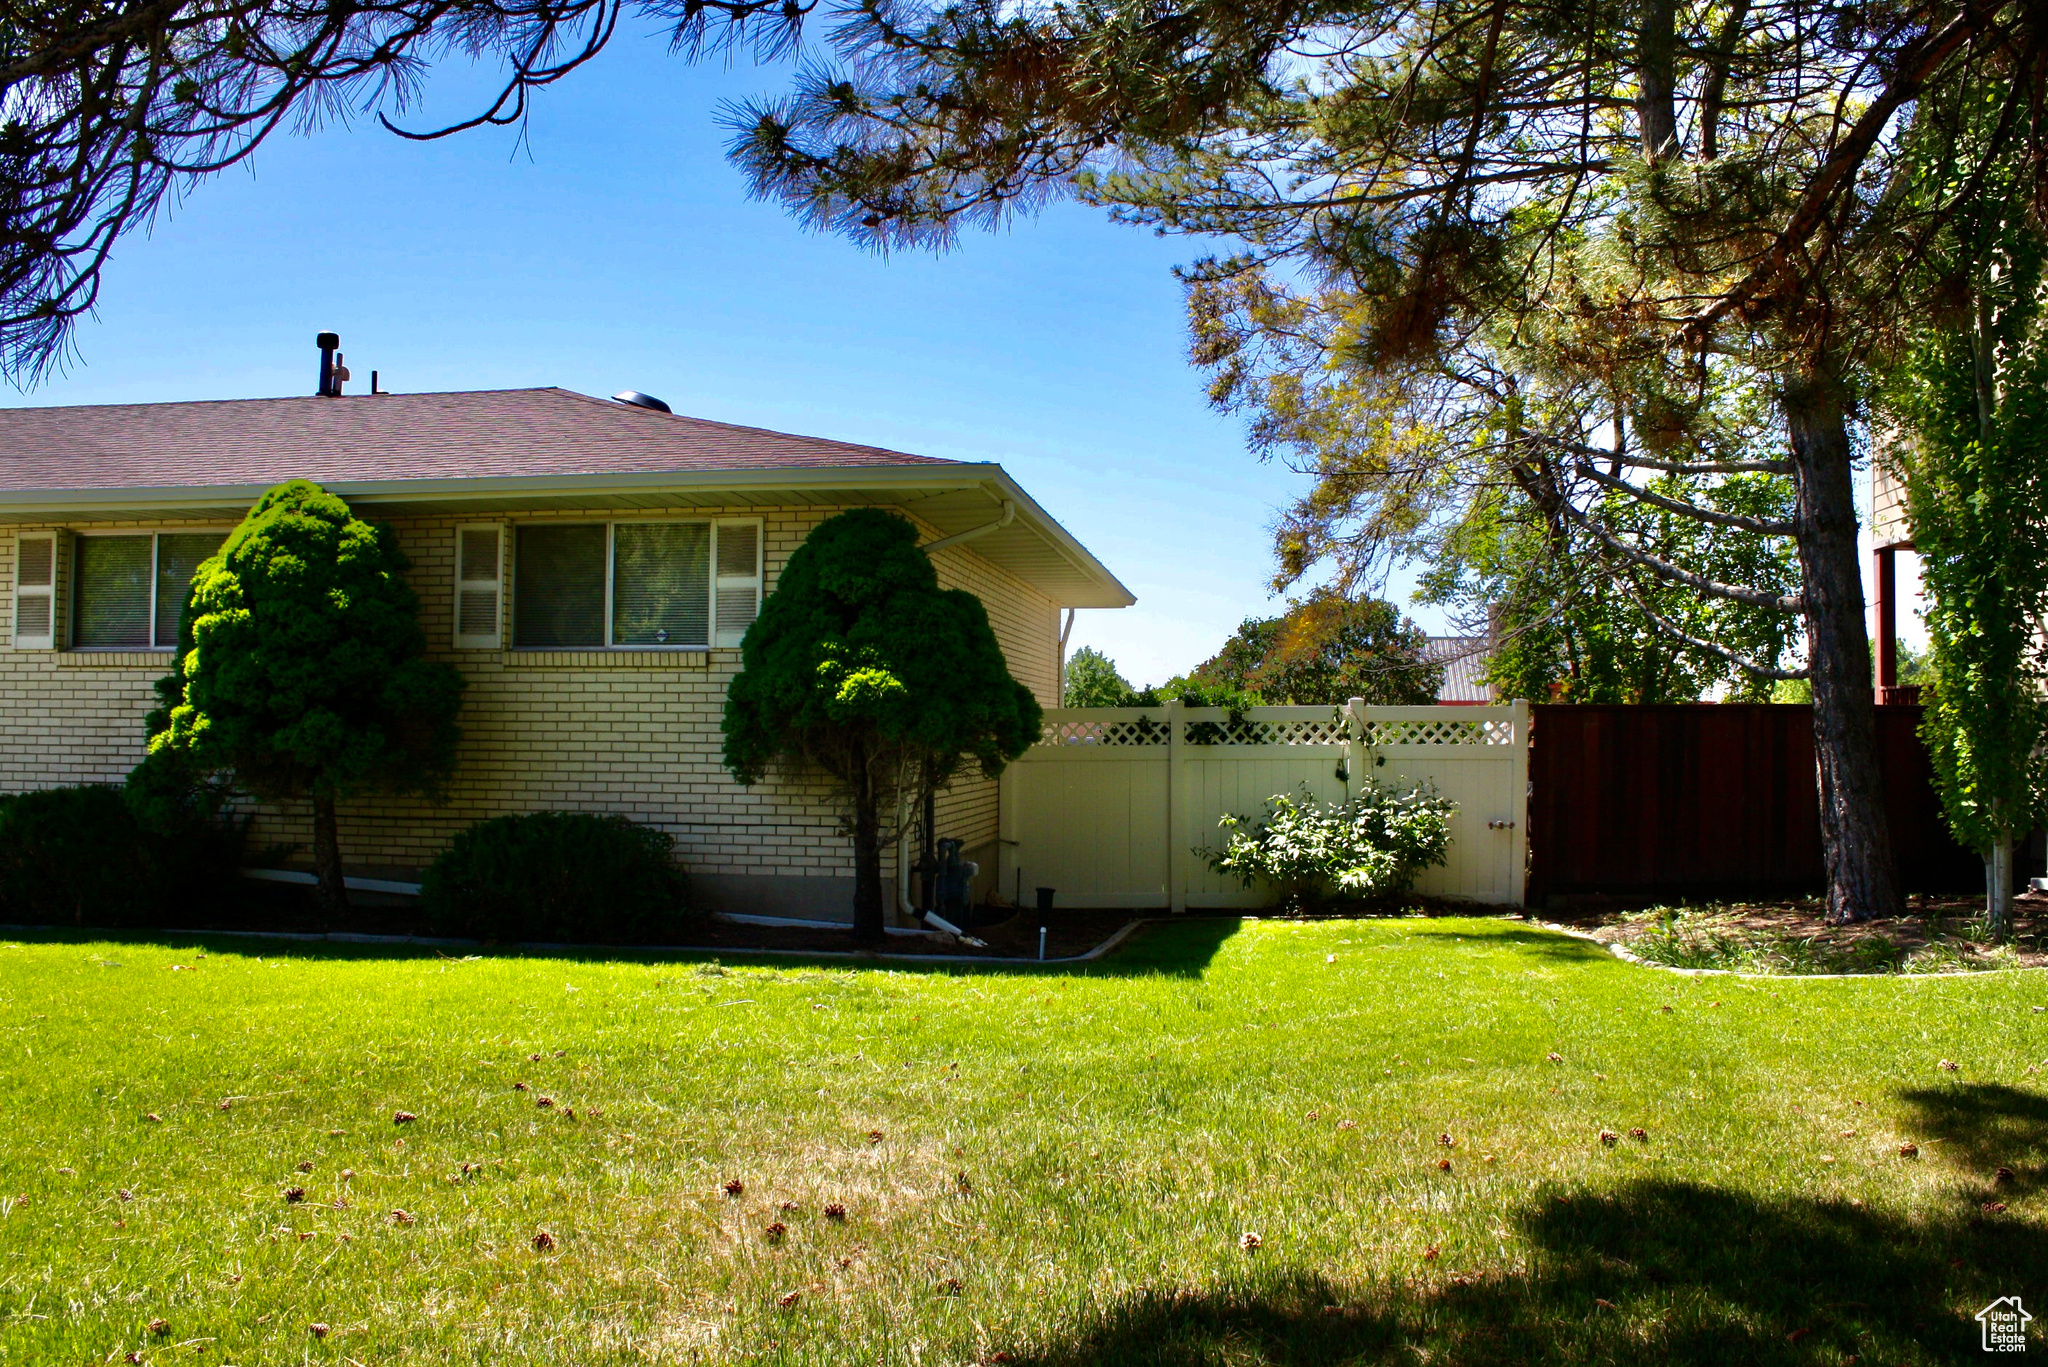
10543 S 2330 W, South Jordan, UT 84095
$-4,166
Cash flow
-19.8%
Cash-on-Cash Return
1.7%
Cap rate
0.3%
Rent to Value Ratio
Active
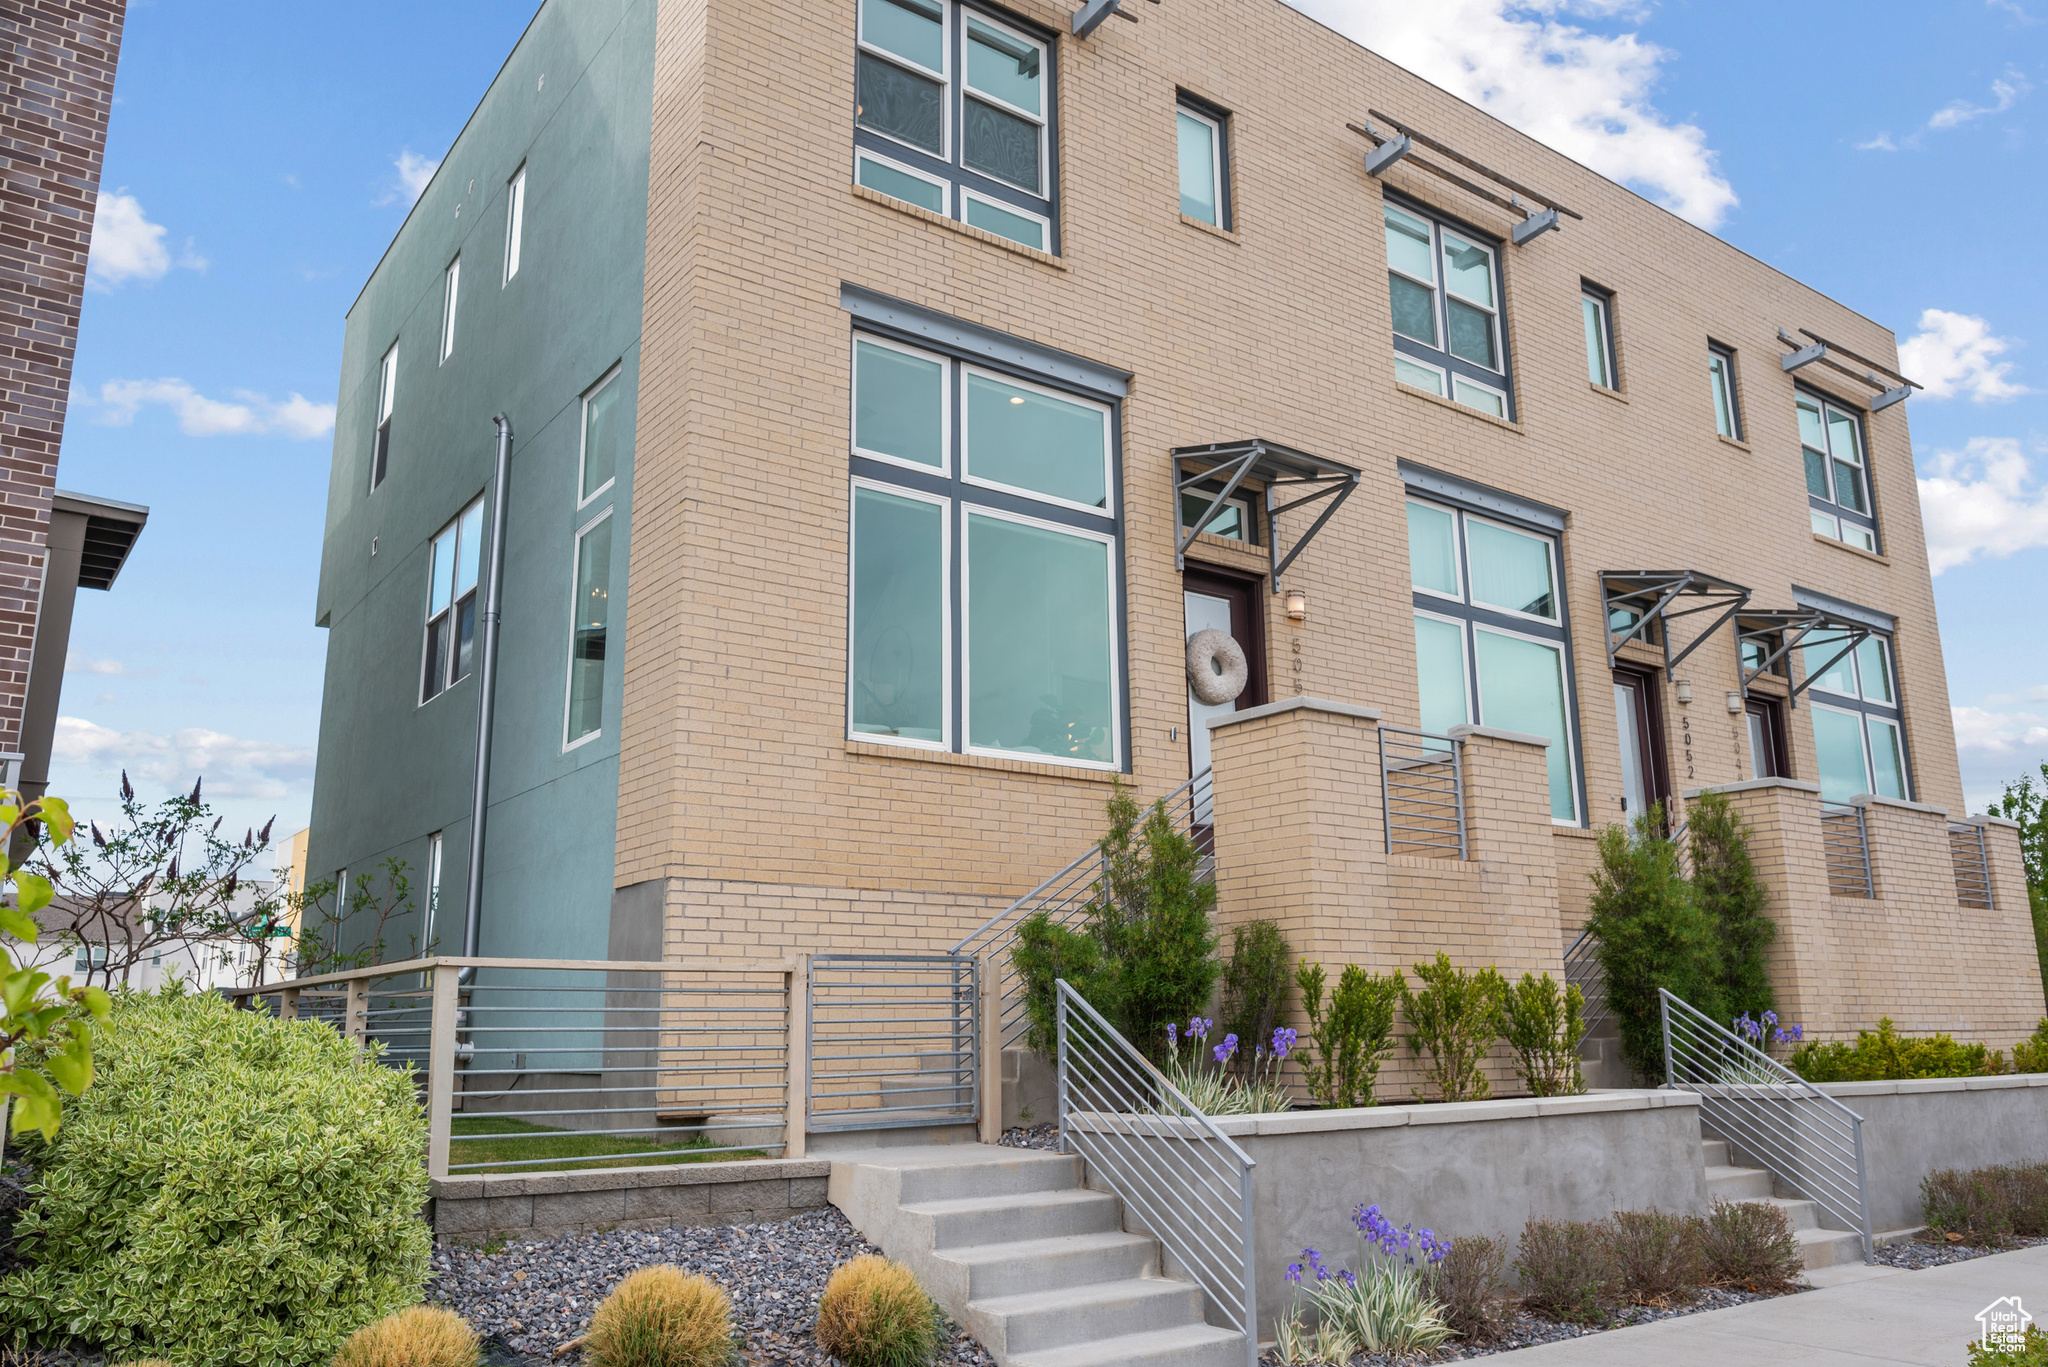
$519,000
4
bds
|
3
ba
|
1,985
sqft
|
built
2020
5127 W Rambutan Way, South Jordan, UT 84009
$-1,795
Cash flow
-18.0%
Cash-on-Cash Return
2.1%
Cap rate
0.4%
Rent to Value Ratio
Active
$569,900
4
bds
|
4
ba
|
2,469
sqft
|
built
2006
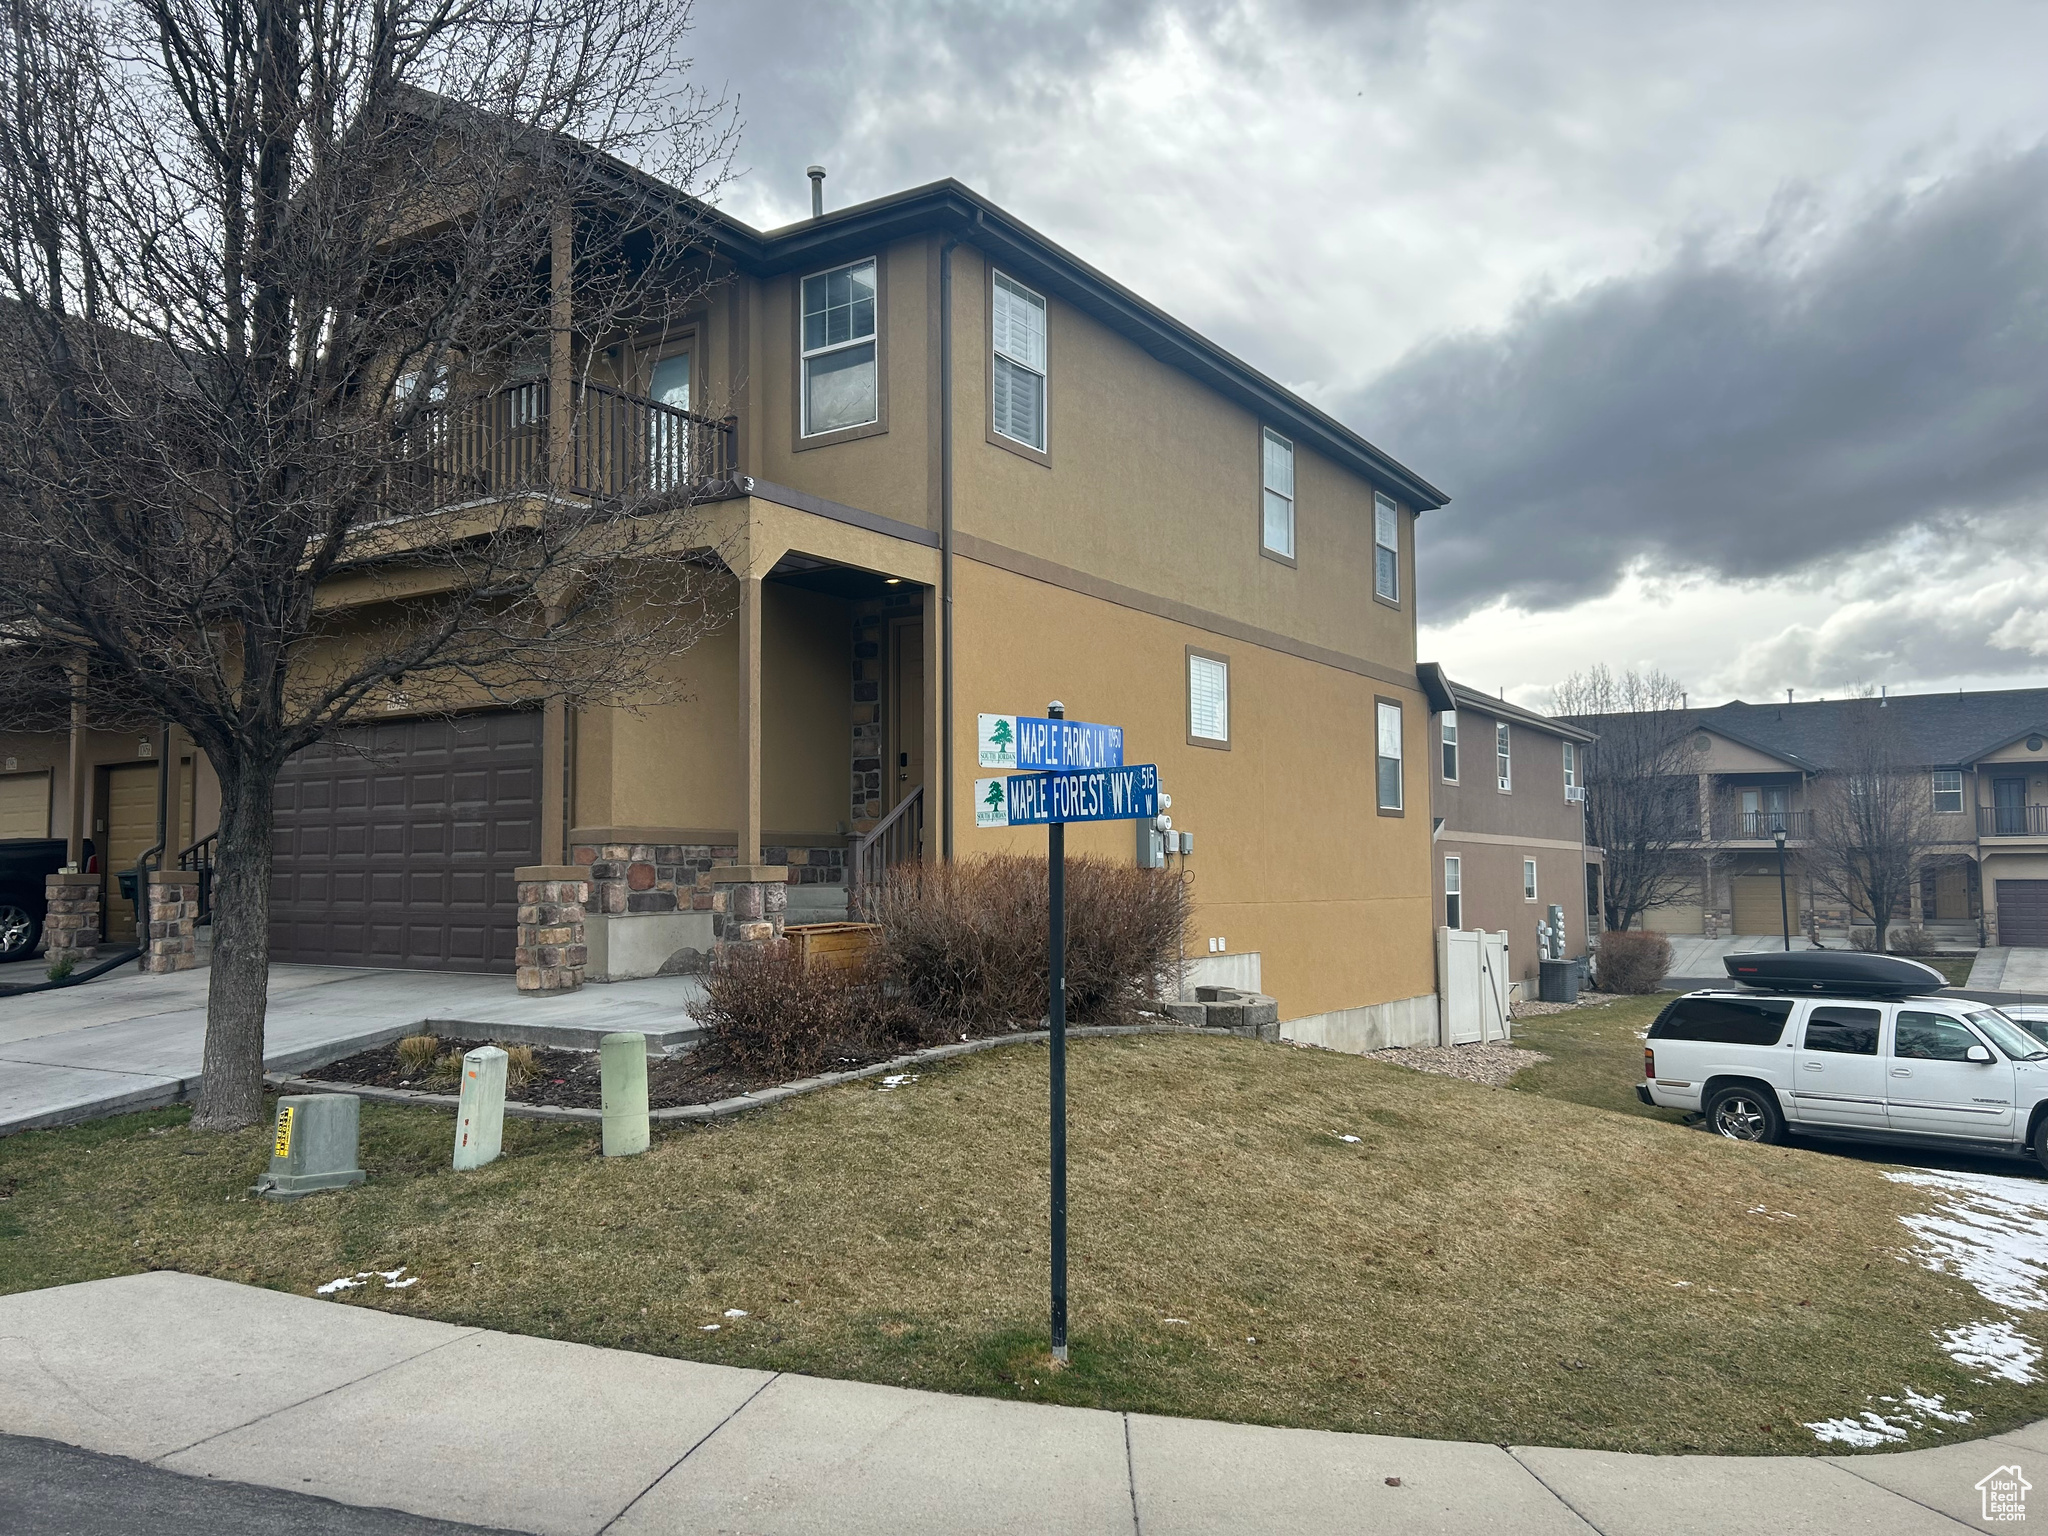
10956 S Maple Forest Way, South Jordan, UT 84095
$-1,825
Cash flow
-16.7%
Cash-on-Cash Return
2.4%
Cap rate
0.4%
Rent to Value Ratio
Active
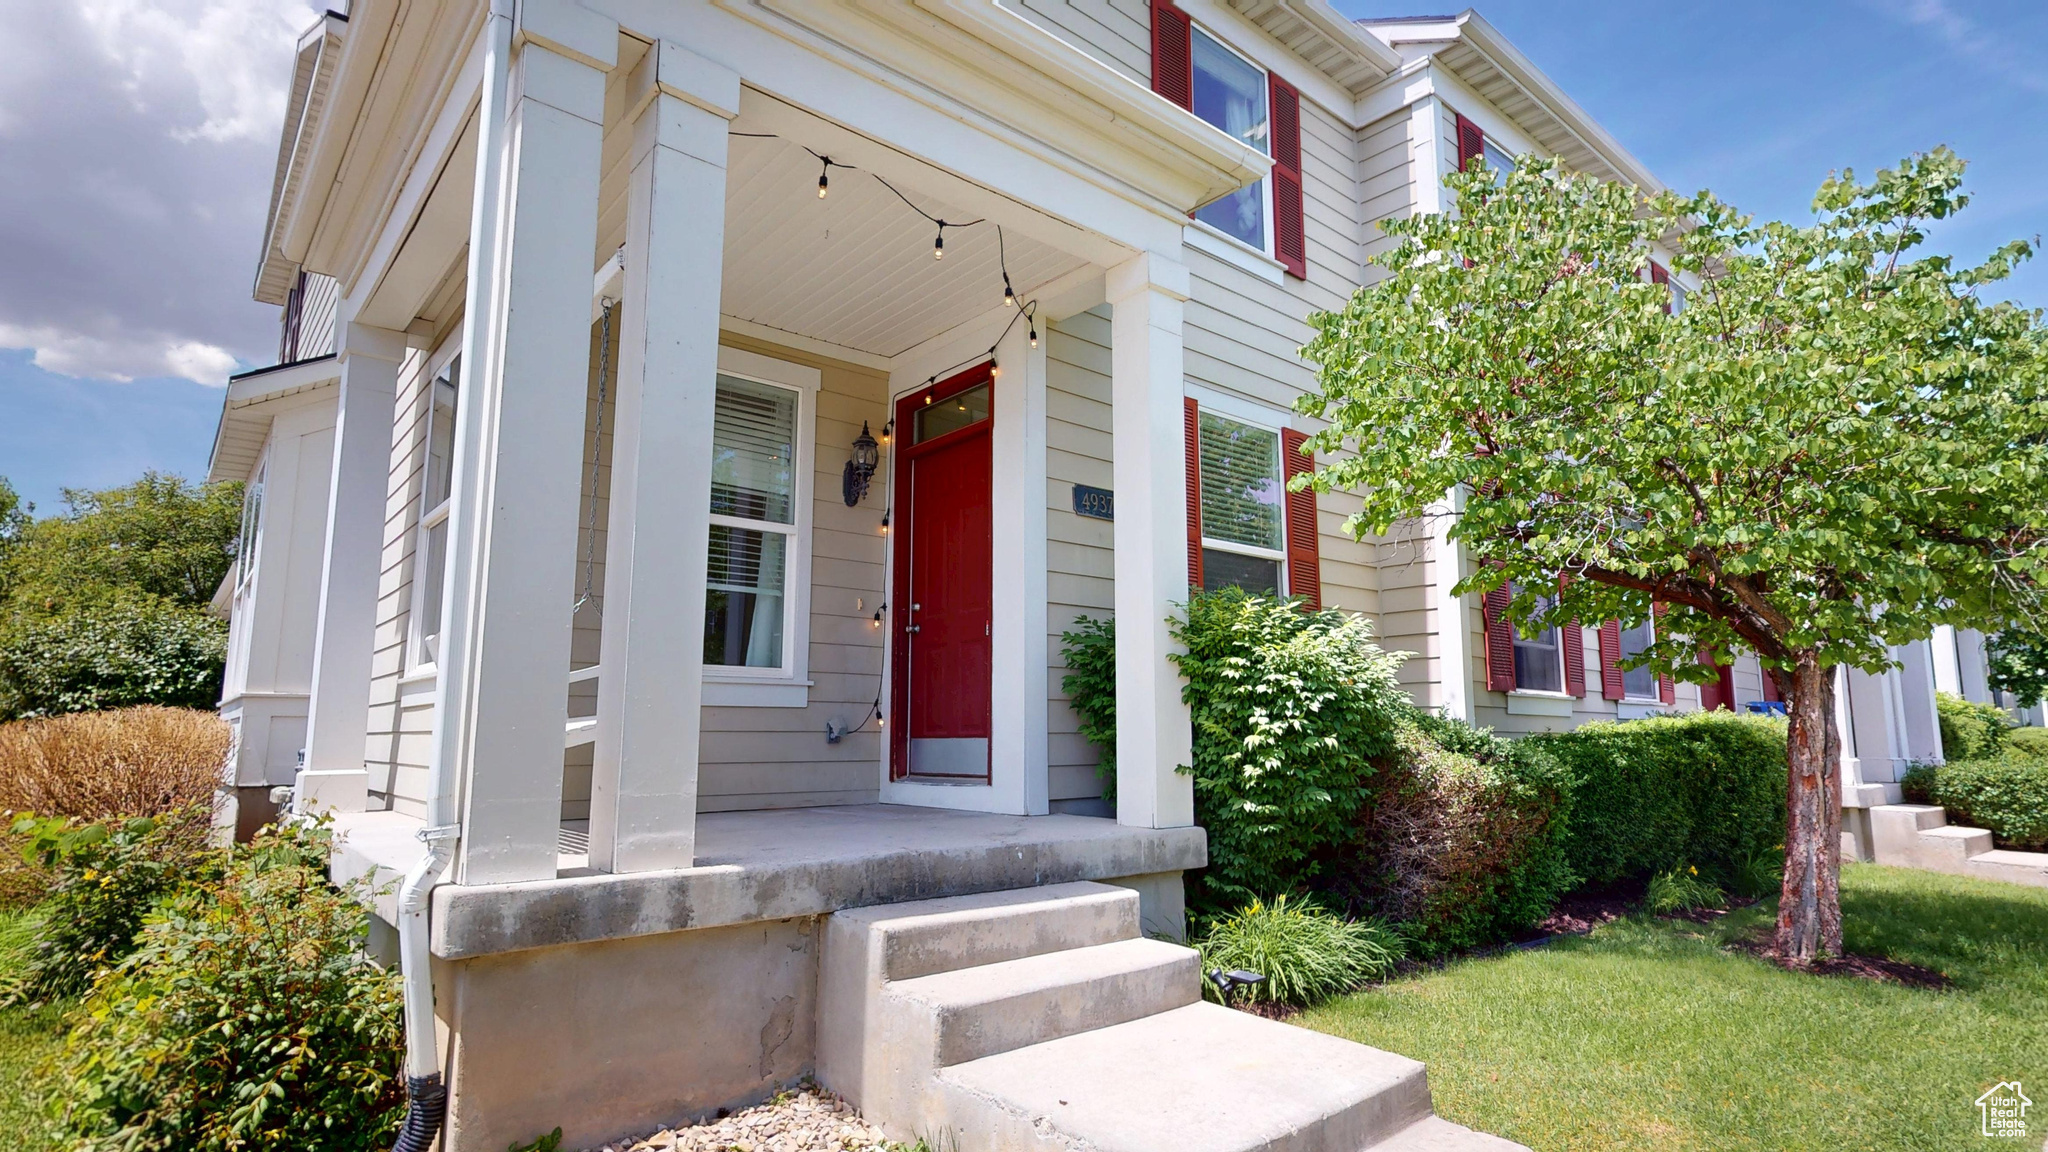
$377,999
3
bds
|
3
ba
|
1,487
sqft
|
built
2006
4937 W Calton Ln, South Jordan, UT 84009
$-1,189
Cash flow
-16.4%
Cash-on-Cash Return
2.5%
Cap rate
0.5%
Rent to Value Ratio
Active
$599,000
4
bds
|
4
ba
|
2,566
sqft
|
built
2023
11056 S Lake Run Rd, South Jordan, UT 84009
$-1,228
Cash flow
-10.7%
Cash-on-Cash Return
3.8%
Cap rate
0.6%
Rent to Value Ratio
Active
$349,000
3
bds
|
2
ba
|
1,277
sqft
|
built
2009
11782 S Currant Dr, South Jordan, UT 84009
$-1,129
Cash flow
-16.9%
Cash-on-Cash Return
2.4%
Cap rate
0.5%
Rent to Value Ratio
Active
$1,024,500
4
bds
|
4
ba
|
3,784
sqft
|
built
1987
11549 S Equestrian Dr, South Jordan, UT 84095
$-2,060
Cash flow
-10.5%
Cash-on-Cash Return
3.9%
Cap rate
0.5%
Rent to Value Ratio

Active
$699,900
4
bds
|
4
ba
|
2,706
sqft
|
built
1984
1125 W Chavez Dr, South Jordan, UT 84095
$-1,995
Cash flow
-14.9%
Cash-on-Cash Return
2.9%
Cap rate
0.4%
Rent to Value Ratio
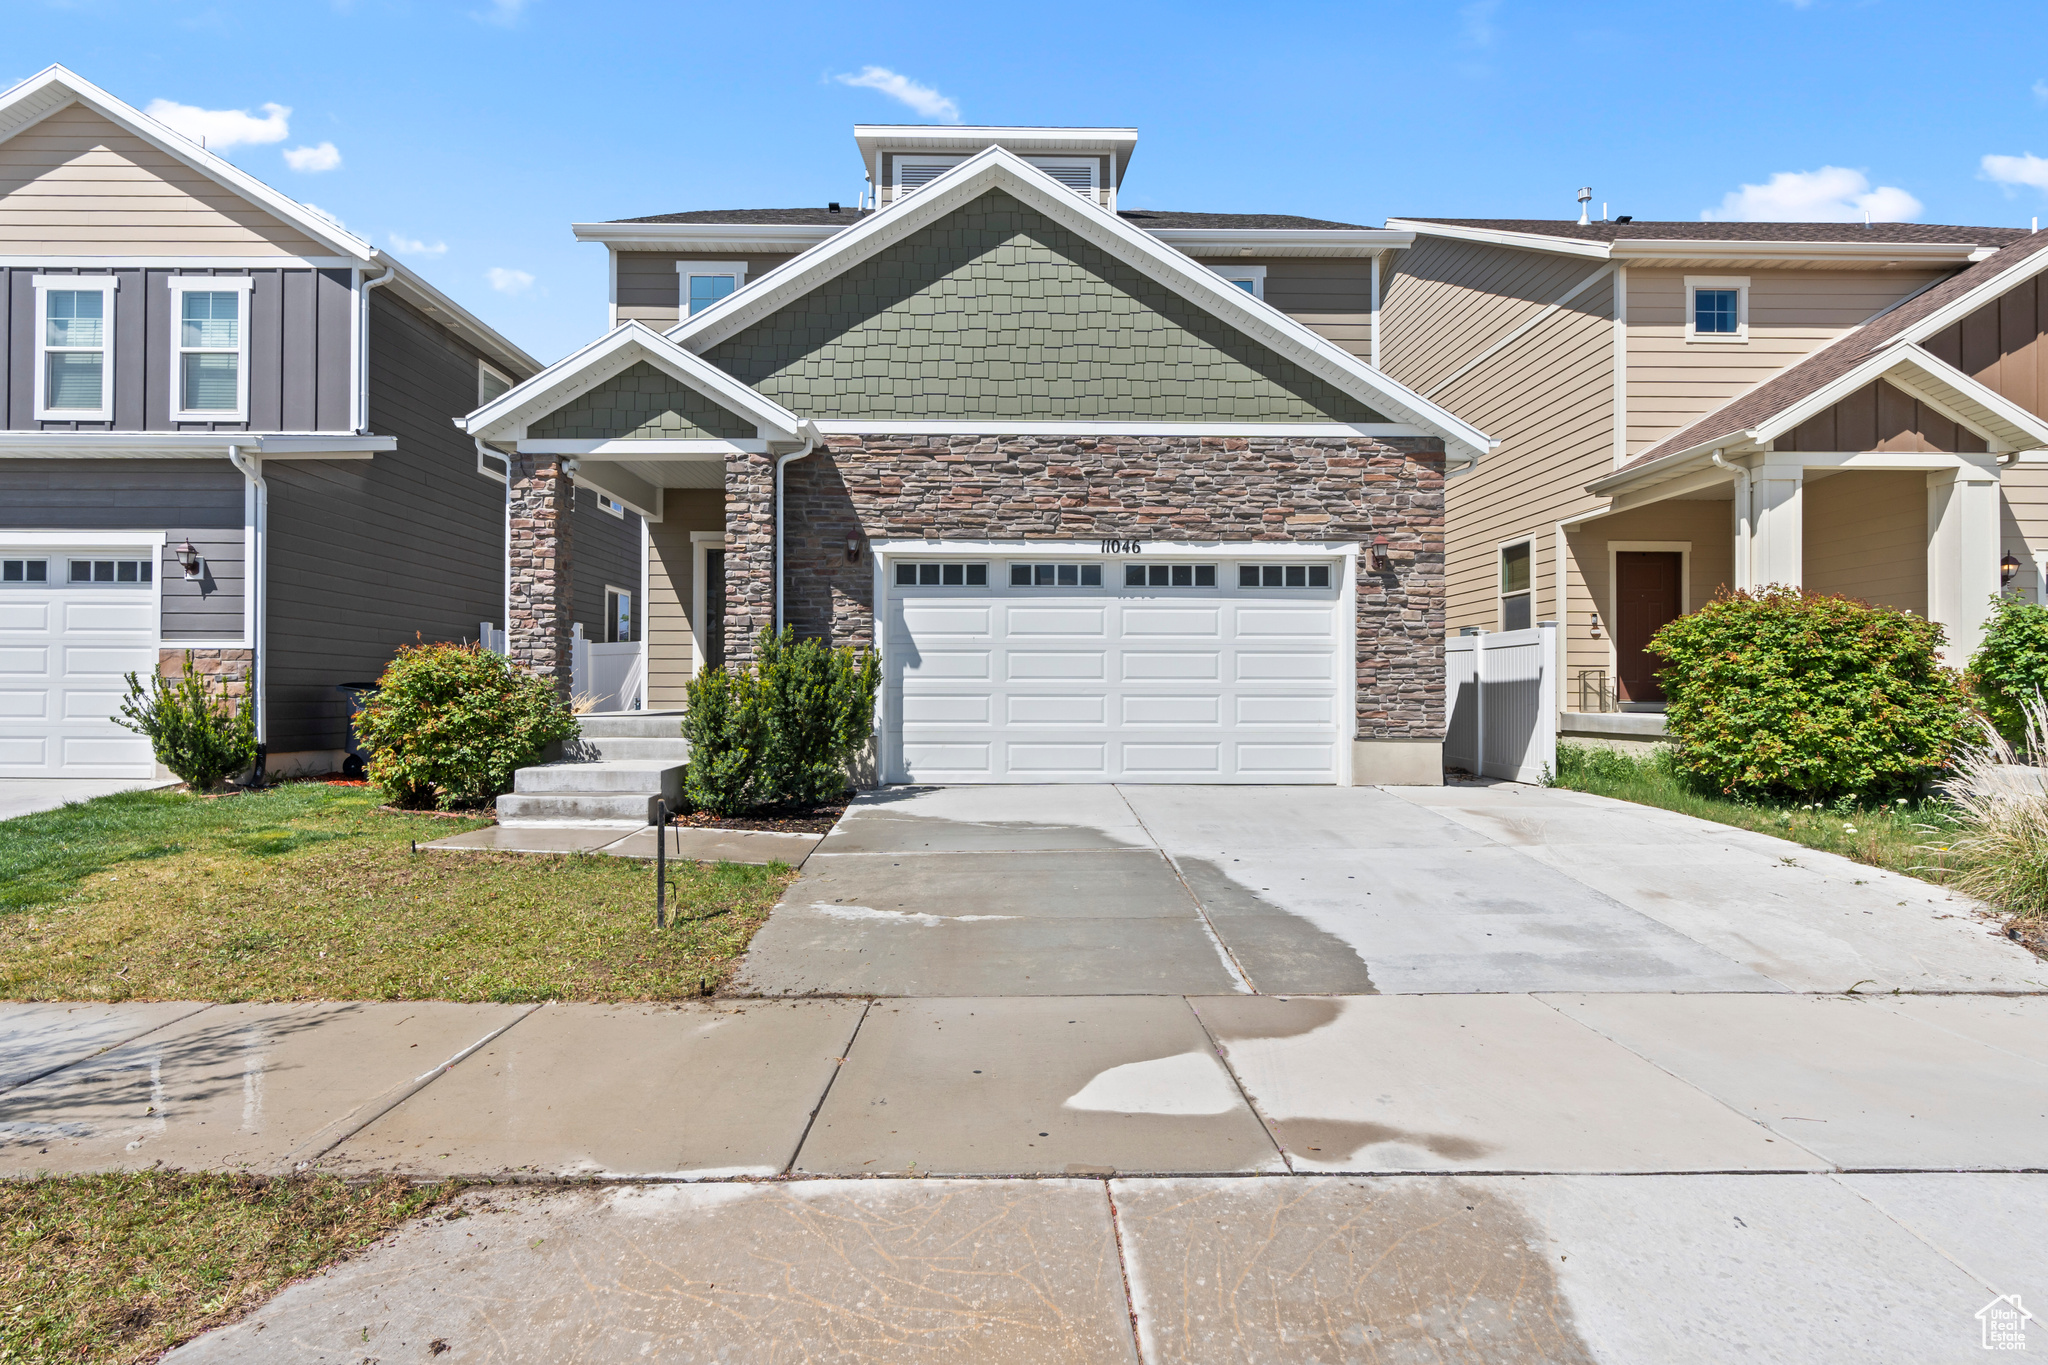
Active
$689,000
4
bds
|
4
ba
|
3,331
sqft
|
built
2018
11046 S Becks Bend Ln, South Jordan, UT 84095
$-1,693
Cash flow
-12.8%
Cash-on-Cash Return
3.3%
Cap rate
0.5%
Rent to Value Ratio
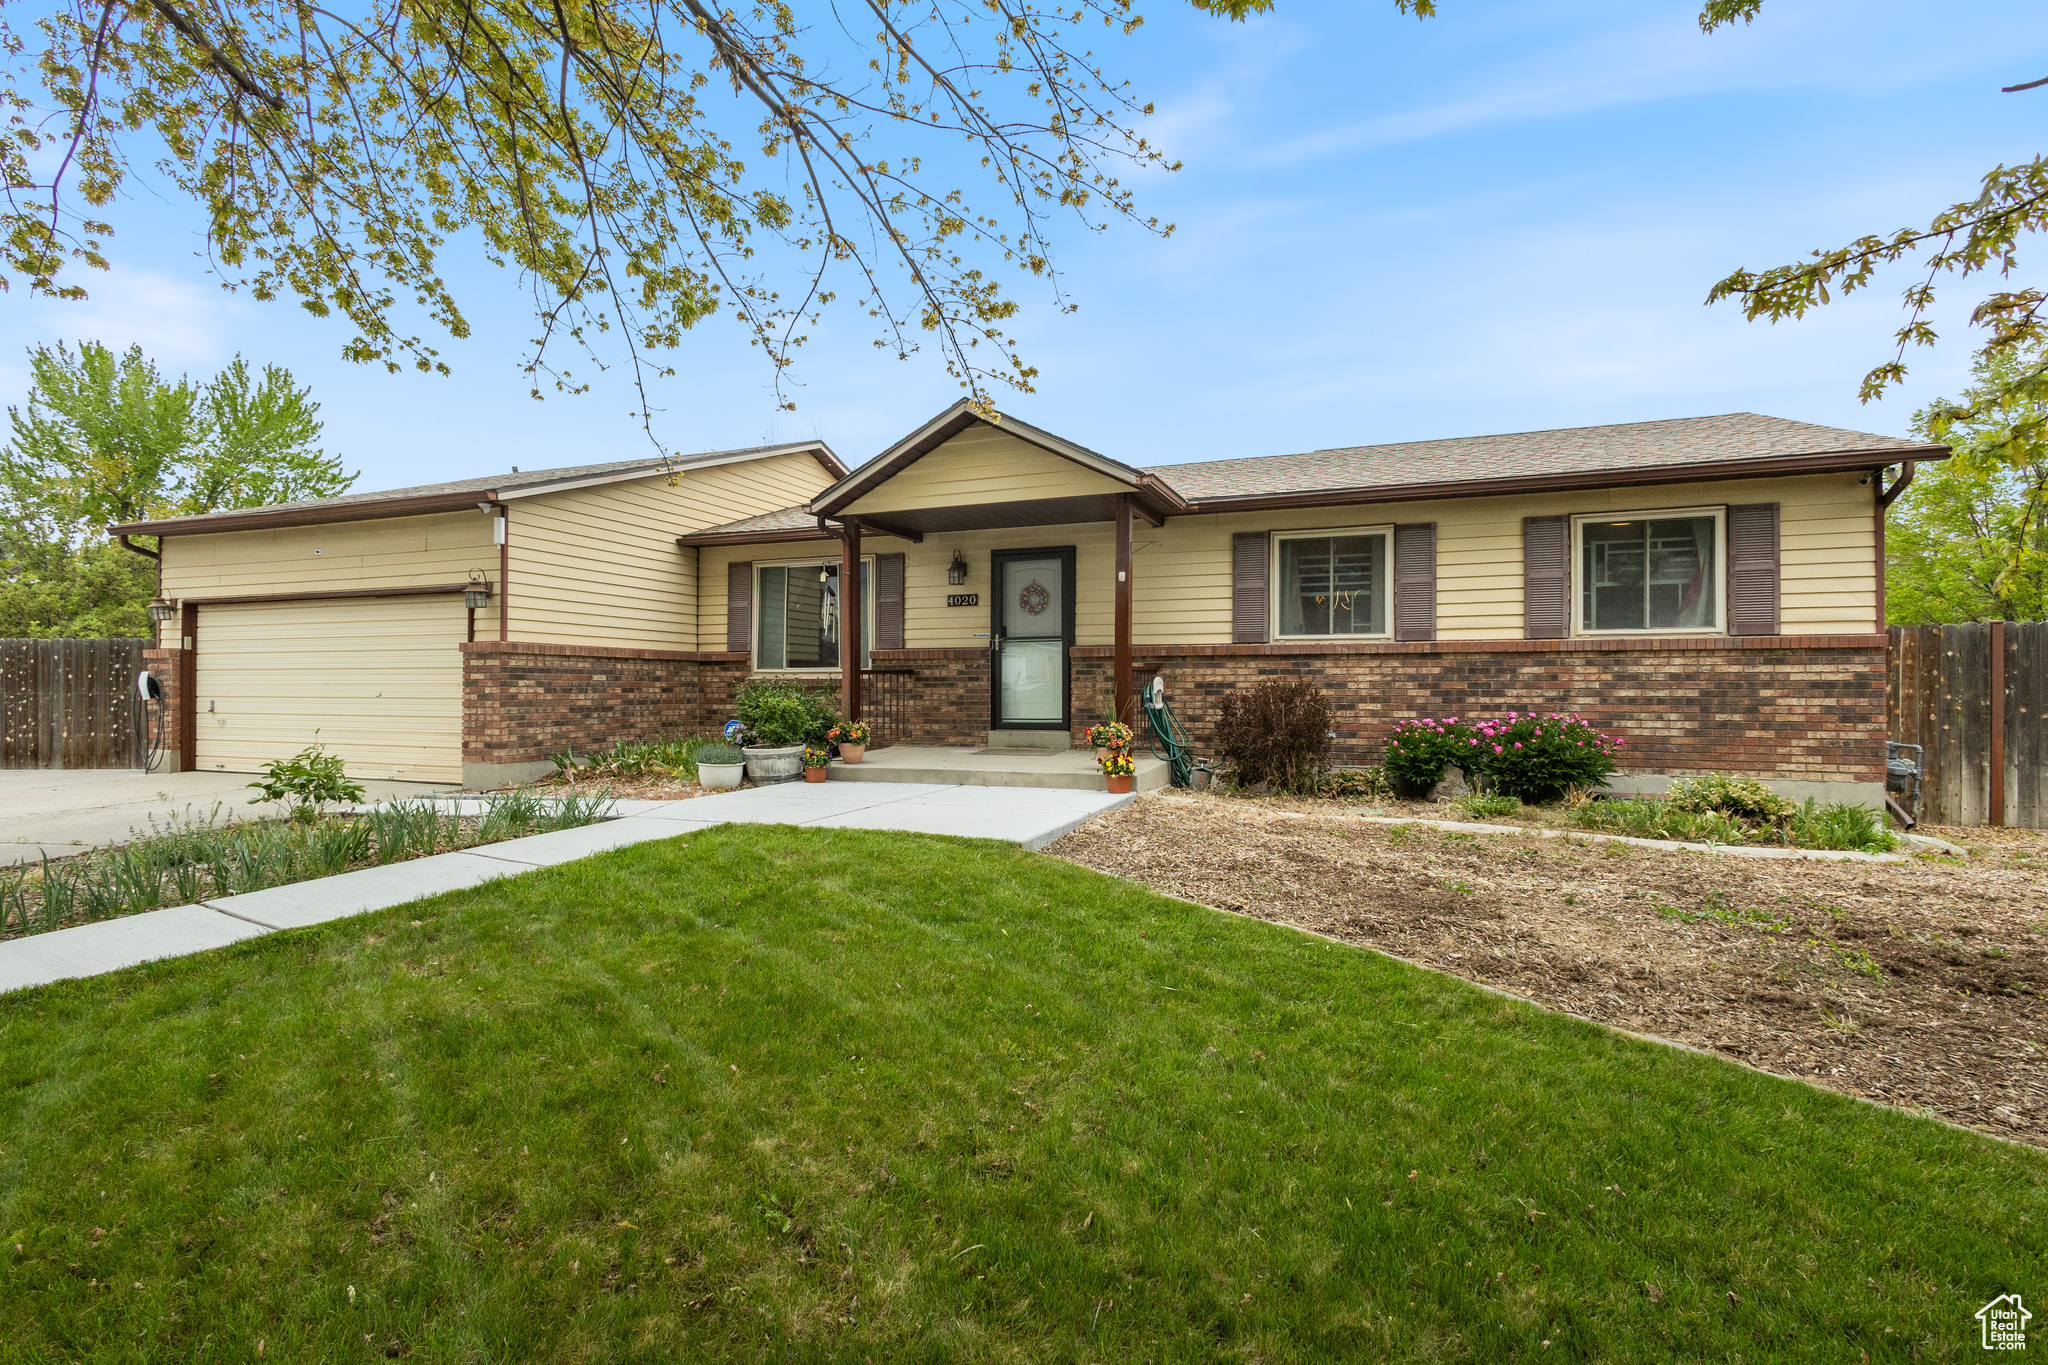
Active
$554,900
5
bds
|
3
ba
|
2,902
sqft
|
built
1981
4020 W Kirkwall Cir, South Jordan, UT 84009
$-1,763
Cash flow
-16.6%
Cash-on-Cash Return
2.5%
Cap rate
0.4%
Rent to Value Ratio
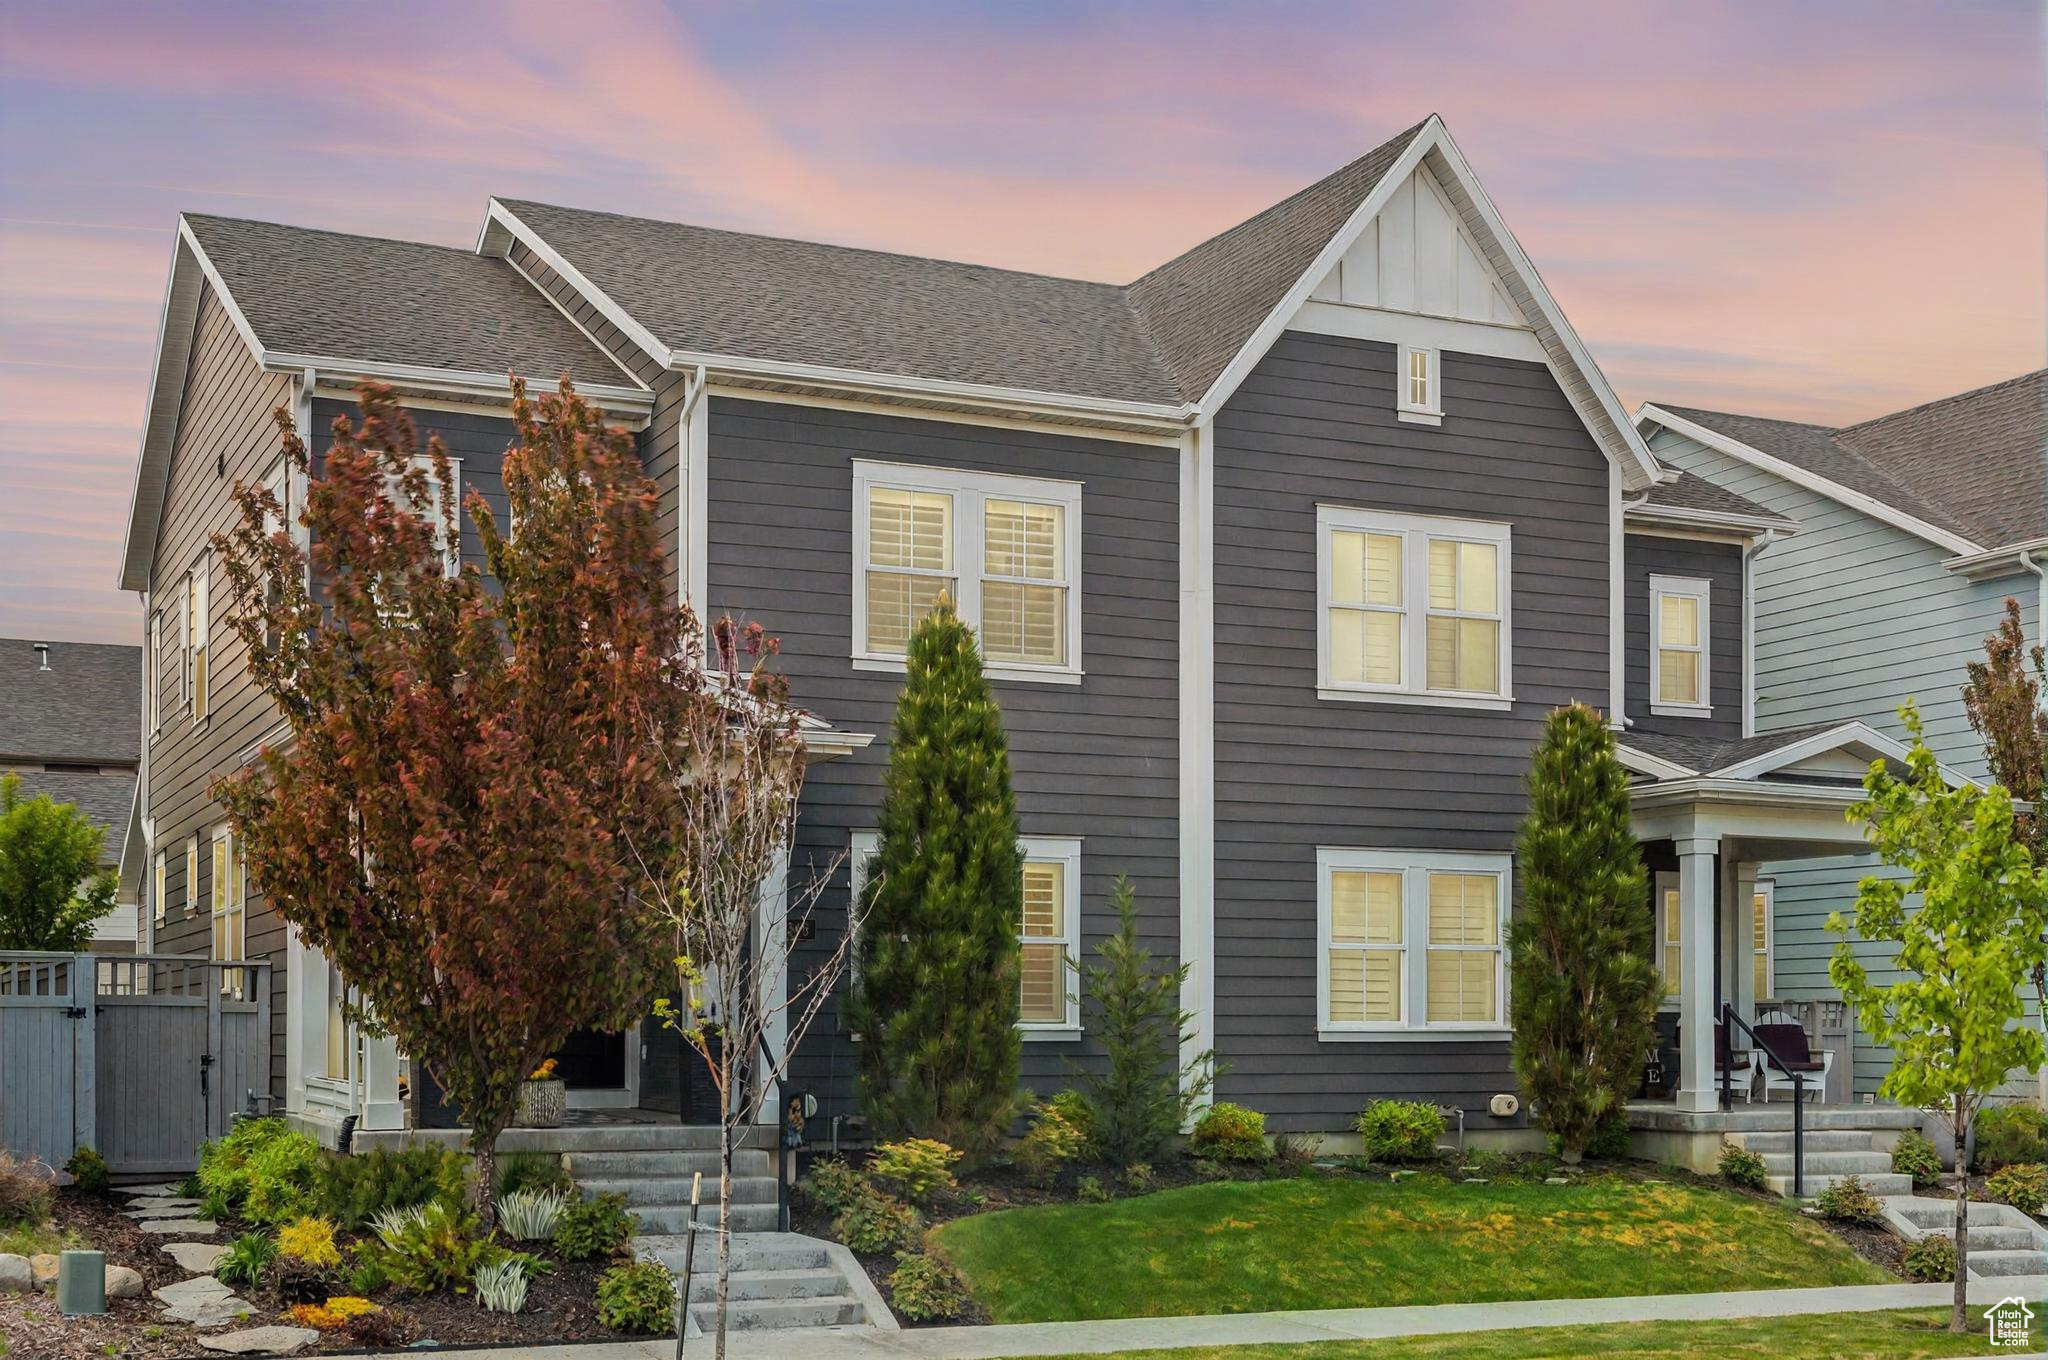
Active
$568,700
3
bds
|
3
ba
|
2,674
sqft
|
built
2019
5346 W Canary Grass Way, South Jordan, UT 84009
$-1,838
Cash flow
-16.9%
Cash-on-Cash Return
2.4%
Cap rate
0.4%
Rent to Value Ratio
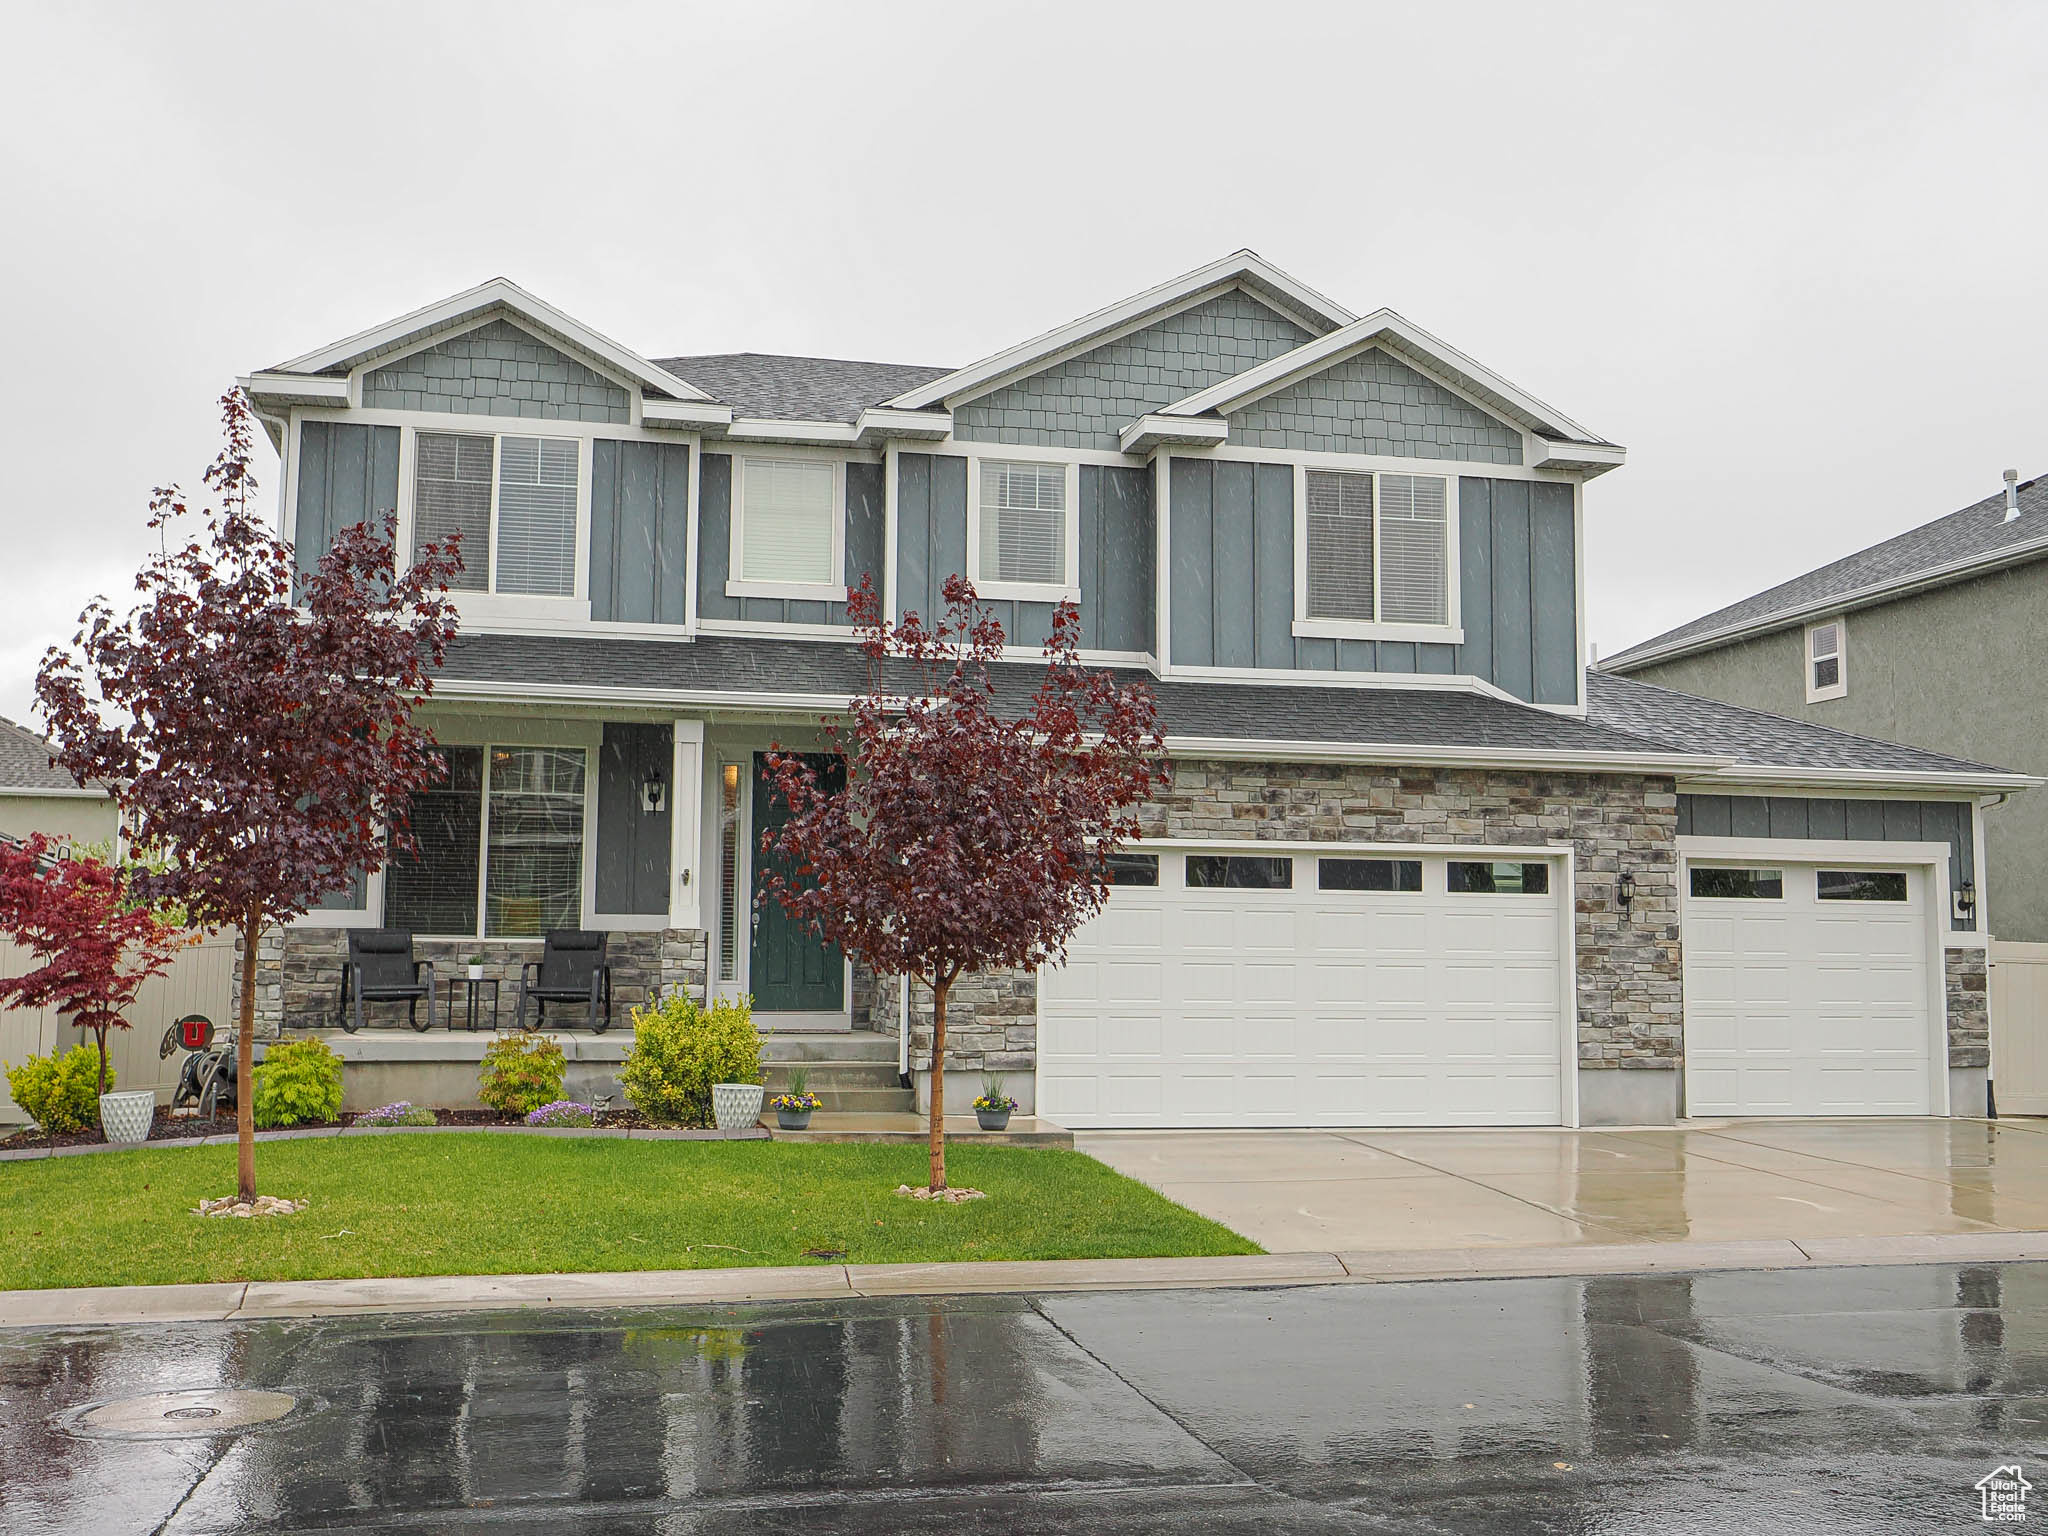
Active
$829,900
3
bds
|
3
ba
|
3,932
sqft
|
built
2016
10953 S Kelso Dune Dr, South Jordan, UT 84009
$-2,522
Cash flow
-15.9%
Cash-on-Cash Return
2.6%
Cap rate
0.4%
Rent to Value Ratio
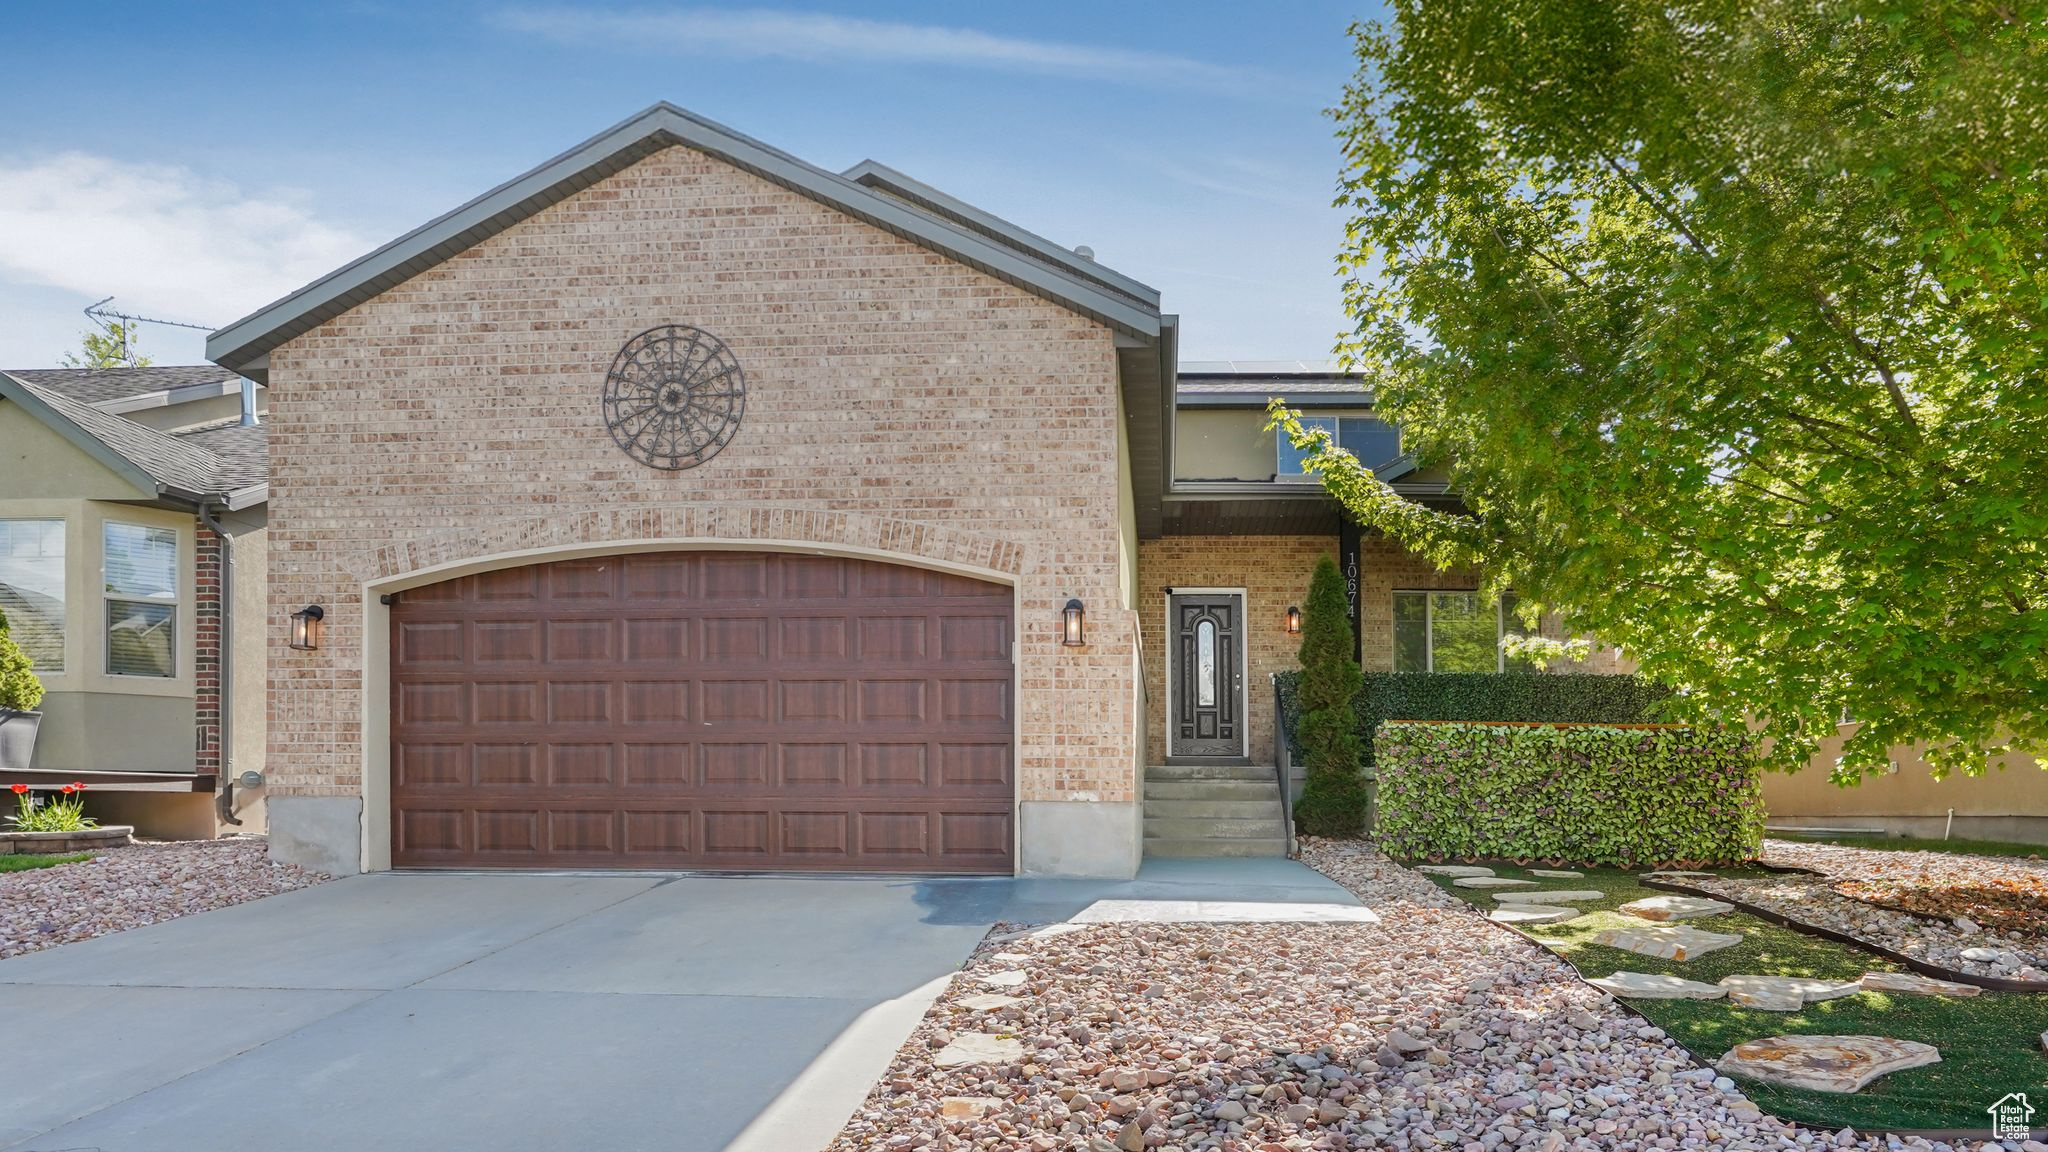
Active
$690,000
6
bds
|
4
ba
|
3,141
sqft
|
built
2006
10674 S Pine Shadow Rd, South Jordan, UT 84009
$-1,721
Cash flow
-13.0%
Cash-on-Cash Return
3.3%
Cap rate
0.5%
Rent to Value Ratio
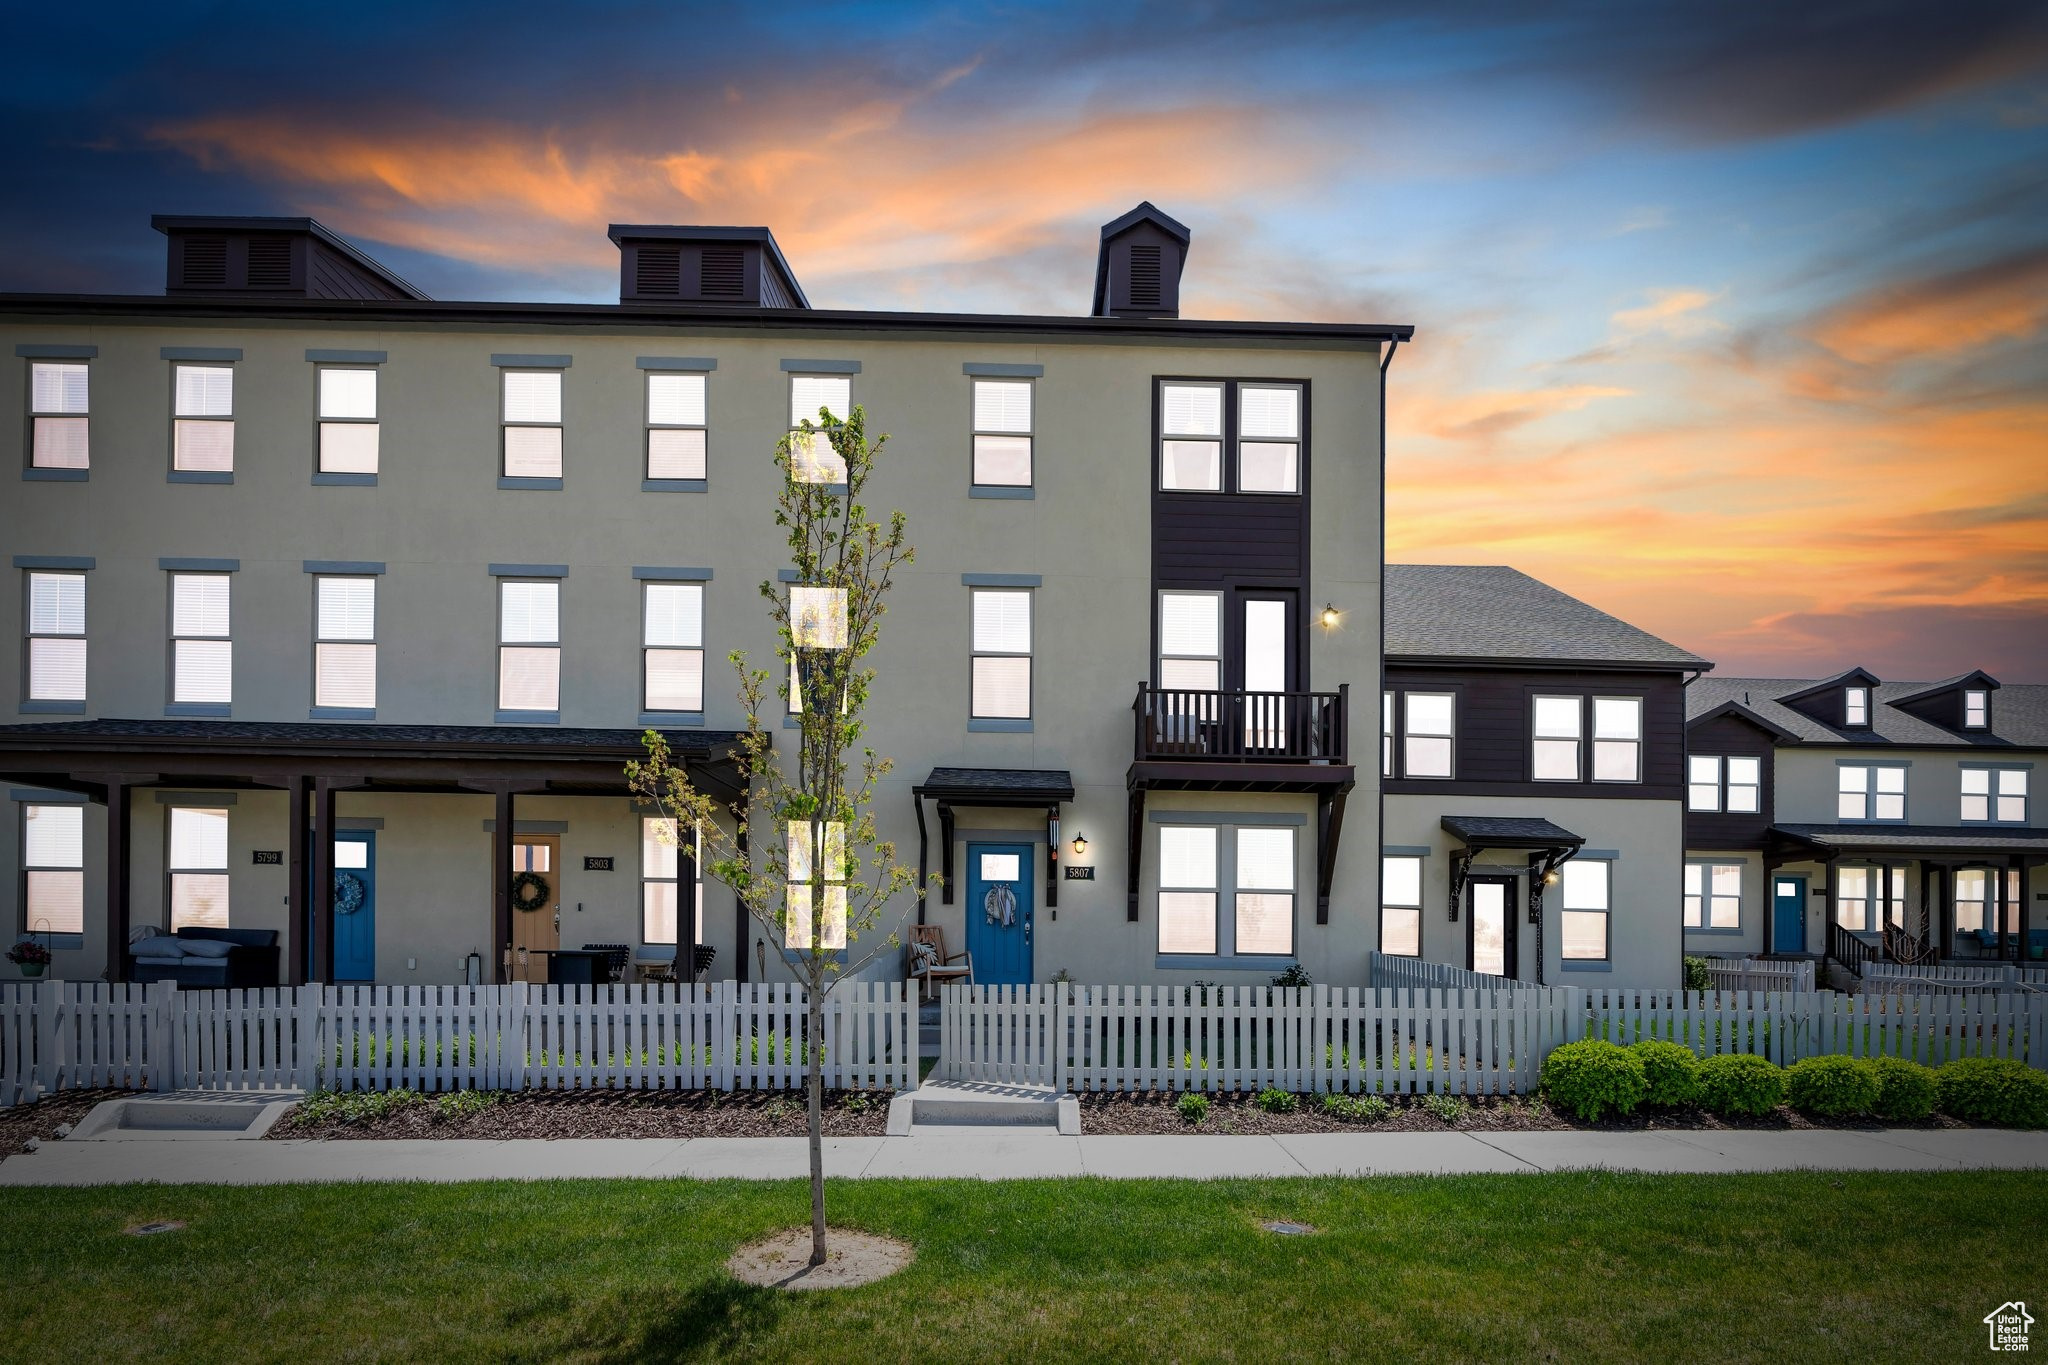
Active
$475,000
4
bds
|
3
ba
|
2,164
sqft
|
built
2020
5807 W Lake Ave, South Jordan, UT 84009
$-1,343
Cash flow
-14.8%
Cash-on-Cash Return
2.9%
Cap rate
0.5%
Rent to Value Ratio