Southfield, MI Investment Properties for Sale
Browse homes for sale and investment properties in Southfield, MI. Refine your search by price, property type, or more.
Best cash flowing properties in Southfield, MI
Active
$184,900
4
bds
|
1
ba
|
1,138
sqft
|
built
1941
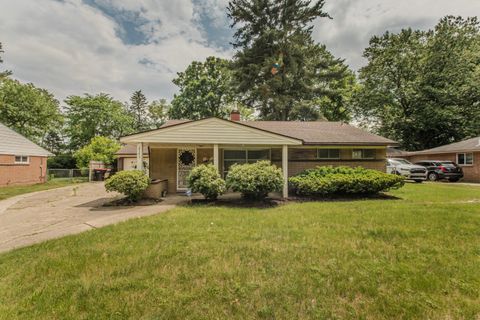
21208 Poinciana St, Southfield, MI 48033
$190
Cash flow
5.4%
Cash-on-Cash Return
7.4%
Cap rate
1.0%
Rent to Value Ratio
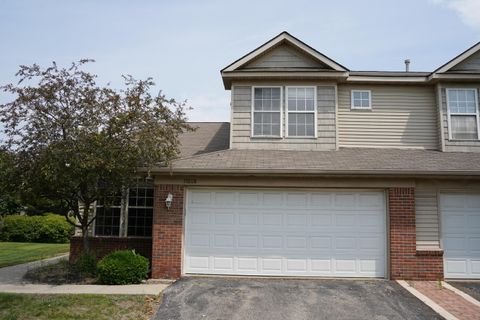
Active
$369,999
6
bds
|
5
ba
|
3,100
sqft
|
built
1964
28740 Tavistock Trl, Southfield, MI 48034
$28
Cash flow
0.4%
Cash-on-Cash Return
6.2%
Cap rate
0.9%
Rent to Value Ratio
17 out of 17 properties for sale in Southfield, MI
Limited Results Shown
Create a free account, or log in to reveal all property listings and enjoy the complete experience.

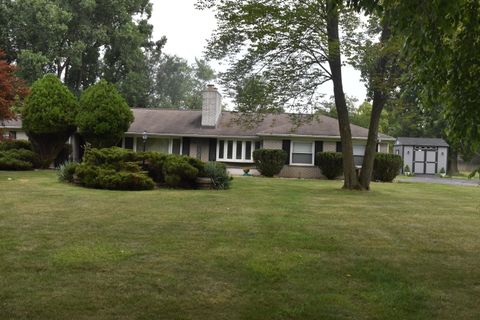
Active
$437,500
4
bds
|
4
ba
|
3,200
sqft
|
built
1964
28355 Tavistock Trl, Southfield, MI 48034
$-536
Cash flow
-6.4%
Cash-on-Cash Return
4.7%
Cap rate
0.7%
Rent to Value Ratio
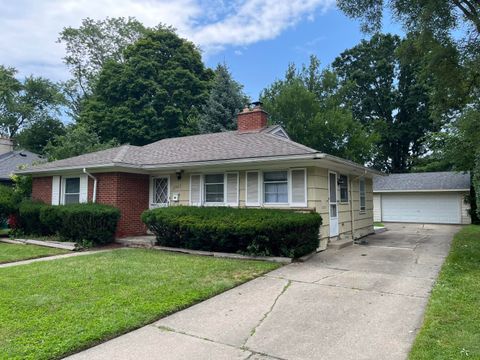
Active
$250,000
4
bds
|
2
ba
|
1,753
sqft
|
built
1962
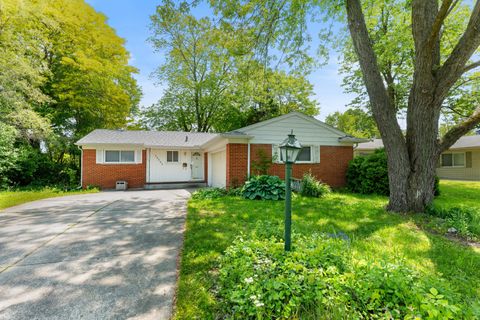
17251 Lee St, Southfield, MI 48075
$-17
Cash flow
-0.4%
Cash-on-Cash Return
6.1%
Cap rate
0.9%
Rent to Value Ratio
Active
$250,000
3
bds
|
2
ba
|
1,252
sqft
|
built
1960
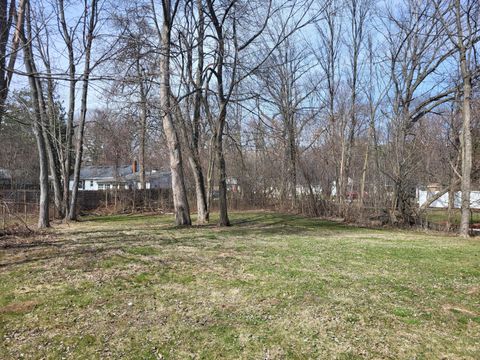
16218 Addison St, Southfield, MI 48075
$-83,234
Cash flow
-1737.1%
Cash-on-Cash Return
-393.4%
Cap rate
0.8%
Rent to Value Ratio
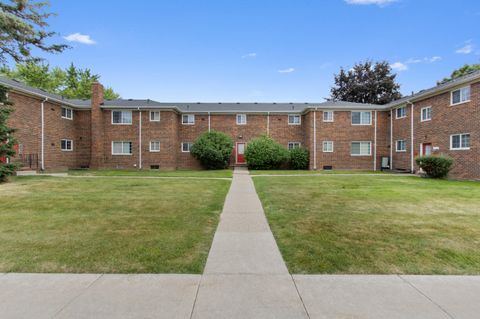
Active
$225,000
3
bds
|
3
ba
|
1,688
sqft
|
built
2003
17608 Gateway Cir, Southfield, MI 48075
$-128
Cash flow
-3.0%
Cash-on-Cash Return
5.5%
Cap rate
1.0%
Rent to Value Ratio
Active
$329,000
3
bds
|
2
ba
|
2,319
sqft
|
built
1954
29140 Briarbank Ct, Southfield, MI 48034
$-265
Cash flow
-4.2%
Cash-on-Cash Return
5.2%
Cap rate
0.8%
Rent to Value Ratio

Active
$225,000
2
bds
|
3
ba
|
1,539
sqft
|
built
2002
20023 Boardwalk Blvd, Southfield, MI 48075
$-537
Cash flow
-12.5%
Cash-on-Cash Return
3.3%
Cap rate
0.9%
Rent to Value Ratio
Active
$184,900
2
bds
|
1
ba
|
997
sqft
|
built
1953
27422 Shagbark Dr, Southfield, MI 48076
$-1
Cash flow
0.0%
Cash-on-Cash Return
6.1%
Cap rate
0.9%
Rent to Value Ratio

Active
$228,000
3
bds
|
1
ba
|
910
sqft
|
built
1925
16915 W 12 Mile Rd, Southfield, MI 48076
$-416
Cash flow
-9.5%
Cash-on-Cash Return
4.0%
Cap rate
0.7%
Rent to Value Ratio

Active
$225,000
3
bds
|
1
ba
|
1,554
sqft
|
built
1928
21560 Poinciana St, Southfield, MI 48033
$-187
Cash flow
-4.3%
Cash-on-Cash Return
5.2%
Cap rate
0.8%
Rent to Value Ratio
Active
$99,000
2
bds
|
1
ba
|
940
sqft
|
built
1967
25349 Shiawassee Cir, Southfield, MI 48033
$-238
Cash flow
-12.5%
Cash-on-Cash Return
3.3%
Cap rate
1.4%
Rent to Value Ratio
Active
$240,000
3
bds
|
2
ba
|
1,532
sqft
|
built
1955
25255 Orchard Grove St, Southfield, MI 48033
$-494
Cash flow
-10.7%
Cash-on-Cash Return
3.7%
Cap rate
0.8%
Rent to Value Ratio
Active
$265,000
3
bds
|
2
ba
|
3,230
sqft
|
built
1963
29848 Rambling Rd, Southfield, MI 48076
$-269
Cash flow
-5.3%
Cash-on-Cash Return
4.9%
Cap rate
0.8%
Rent to Value Ratio
Active
$185,000
3
bds
|
1
ba
|
1,363
sqft
|
built
1947
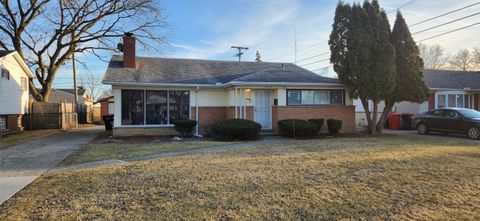
21328 Frazer Ave, Southfield, MI 48075
$-104
Cash flow
-2.9%
Cash-on-Cash Return
5.5%
Cap rate
1.0%
Rent to Value Ratio
Active
$289,000
3
bds
|
3
ba
|
1,818
sqft
|
built
1956
15939 New Hampshire St, Southfield, MI 48075
$-307
Cash flow
-5.5%
Cash-on-Cash Return
4.9%
Cap rate
0.9%
Rent to Value Ratio
Active
$340,000
4
bds
|
3
ba
|
1,968
sqft
|
built
1965
25511 Hickory Hill St, Southfield, MI 48033
$-301
Cash flow
-4.6%
Cash-on-Cash Return
5.1%
Cap rate
0.9%
Rent to Value Ratio