Surfside Beach, TX Investment Properties for Sale
Browse homes for sale and investment properties in Surfside Beach, TX. Refine your search by price, property type, or more.
Best cash flowing properties in Surfside Beach, TX
Active
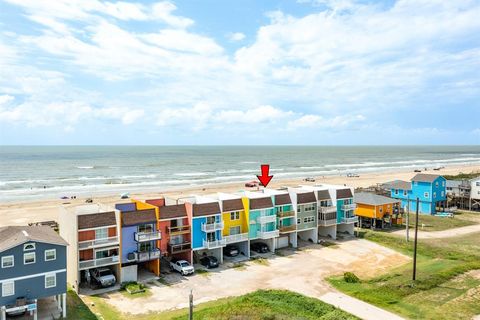
$334,900
2
bds
|
2
ba
|
1,102
sqft
|
built
1962
101 Pelican Pl, Surfside Beach, TX 77541
$-181
Cash flow
-2.8%
Cash-on-Cash Return
5.0%
Cap rate
0.7%
Rent to Value Ratio
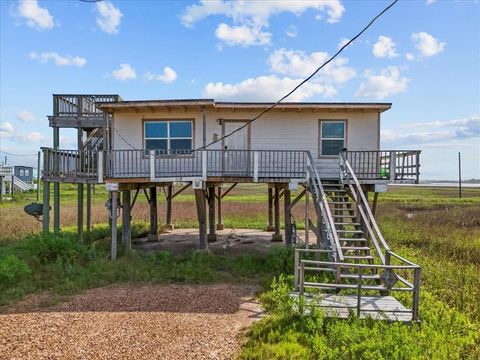
Active
$215,000
2
bds
|
2
ba
|
924
sqft
|
built
1965
227 Detenbeck Ave, Surfside Beach, TX 77541
$-207
Cash flow
-5.0%
Cash-on-Cash Return
4.5%
Cap rate
0.7%
Rent to Value Ratio
101 out of 119 properties for sale in Surfside Beach, TX
Limited Results Shown
Create a free account, or log in to reveal all property listings and enjoy the complete experience.
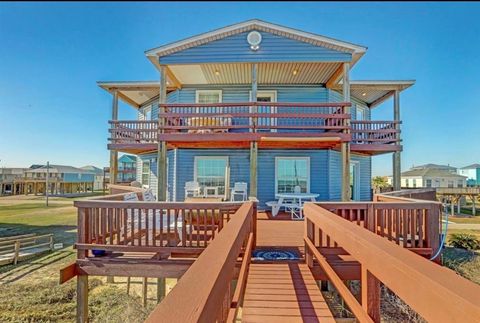
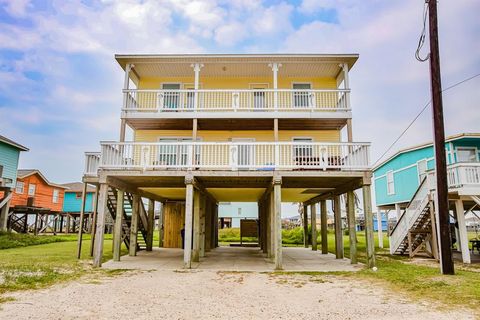
Active
$699,000
4
bds
|
4
ba
|
1,720
sqft
|
built
2007
601 Wave Ct, Surfside Beach, TX 77541
$-1,435
Cash flow
-10.7%
Cash-on-Cash Return
3.2%
Cap rate
0.6%
Rent to Value Ratio
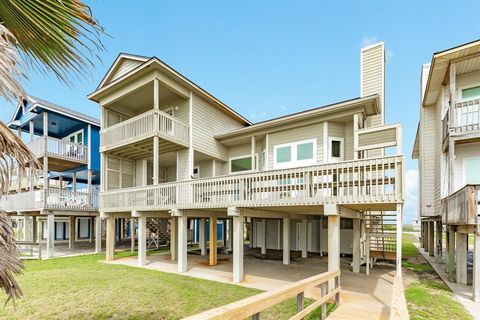
Active
$1,290,000
4
bds
|
4
ba
|
2,755
sqft
|
built
2005
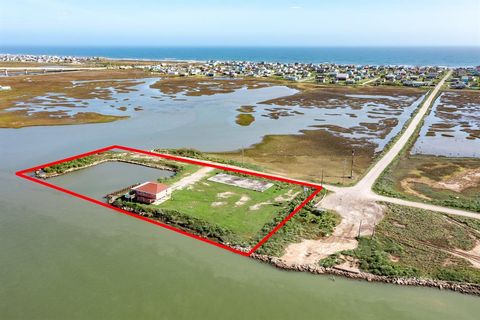
2330 Blue Water Hwy, Surfside Beach, TX 77541
$-4,980
Cash flow
-20.1%
Cash-on-Cash Return
1.0%
Cap rate
0.3%
Rent to Value Ratio
Active
$410,000
3
bds
|
2
ba
|
1,104
sqft
|
built
2021
1310 Monument Dr, Surfside Beach, TX 77541
$-1,038
Cash flow
-13.2%
Cash-on-Cash Return
2.6%
Cap rate
0.5%
Rent to Value Ratio
Active
$395,900
3
bds
|
2
ba
|
1,152
sqft
|
built
2012
818 Surf Dr, Surfside Beach, TX 77541
$-957
Cash flow
-12.6%
Cash-on-Cash Return
2.8%
Cap rate
0.5%
Rent to Value Ratio
Active
$1,300,000
5
bds
|
4
ba
|
1,904
sqft
|
built
2014
106 Sand Dune Ct, Surfside Beach, TX 77541
$-4,013
Cash flow
-16.1%
Cash-on-Cash Return
2.0%
Cap rate
0.2%
Rent to Value Ratio
Active
$650,000
5
bds
|
4
ba
|
1,952
sqft
|
built
2006
115 Southwind Dr, Surfside Beach, TX 77541
$-2,042
Cash flow
-16.4%
Cash-on-Cash Return
1.9%
Cap rate
0.5%
Rent to Value Ratio
Active
$559,000
4
bds
|
4
ba
|
1,995
sqft
|
built
2005
206 Sand Dune Ct, Surfside Beach, TX 77541
$-1,366
Cash flow
-12.7%
Cash-on-Cash Return
2.7%
Cap rate
0.6%
Rent to Value Ratio
Active
$899,999
4
bds
|
5
ba
|
2,407
sqft
|
built
2016
107 Yucca Ave, Surfside Beach, TX 77541
$-2,575
Cash flow
-14.9%
Cash-on-Cash Return
2.2%
Cap rate
0.5%
Rent to Value Ratio
Active
$399,900
3
bds
|
2
ba
|
1,269
sqft
|
built
2015
2709 Swan Ct, Surfside Beach, TX 77541
$-1,290
Cash flow
-16.8%
Cash-on-Cash Return
1.8%
Cap rate
0.5%
Rent to Value Ratio
Active
$650,000
3
bds
|
2
ba
|
1,140
sqft
|
built
1979
1654 Sandpebble Pl, Surfside Beach, TX 77541
$-2,174
Cash flow
-17.5%
Cash-on-Cash Return
1.7%
Cap rate
0.4%
Rent to Value Ratio
Active
$428,000
3
bds
|
3
ba
|
1,280
sqft
|
built
2018
126 Nesmith Pl, Surfside Beach, TX 77541
$-998
Cash flow
-12.2%
Cash-on-Cash Return
2.9%
Cap rate
0.6%
Rent to Value Ratio

Active
$375,000
2
bds
|
2
ba
|
1,508
sqft
|
built
1960
110 Ocean Ave, Surfside Beach, TX 77541
$-754
Cash flow
-10.5%
Cash-on-Cash Return
3.3%
Cap rate
0.6%
Rent to Value Ratio
Active
$349,900
2
bds
|
3
ba
|
1,150
sqft
|
built
2013
516 Treaty Dr, Surfside Beach, TX 77541
$-982
Cash flow
-14.6%
Cash-on-Cash Return
2.3%
Cap rate
0.6%
Rent to Value Ratio
Active
$285,000
2
bds
|
1
ba
|
896
sqft
|
built
1975
719 Seashell Dr, Surfside Beach, TX 77541
$-668
Cash flow
-12.2%
Cash-on-Cash Return
2.9%
Cap rate
0.6%
Rent to Value Ratio
Active
$640,000
3
bds
|
2
ba
|
1,428
sqft
|
built
2018
706 Beach Dr, Surfside Beach, TX 77541
$-2,562
Cash flow
-20.9%
Cash-on-Cash Return
0.9%
Cap rate
0.3%
Rent to Value Ratio
Active
$1,200,000
4
bds
|
3
ba
|
1,224
sqft
|
built
2000
606 Canal Dr, Surfside Beach, TX 77541
$-2,574
Cash flow
-11.2%
Cash-on-Cash Return
3.1%
Cap rate
0.4%
Rent to Value Ratio
Active
$590,000
4
bds
|
3
ba
|
1,408
sqft
|
built
2016
104 Beach Dr, Surfside Beach, TX 77541
$-791
Cash flow
-7.0%
Cash-on-Cash Return
4.1%
Cap rate
0.5%
Rent to Value Ratio
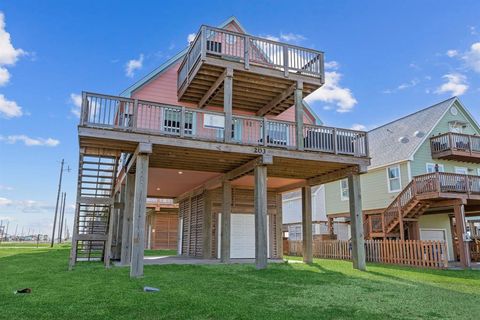
Active
$409,500
3
bds
|
3
ba
|
1,152
sqft
|
built
2020
203 Sandpebble Pl, Surfside Beach, TX 77541
$-919
Cash flow
-11.7%
Cash-on-Cash Return
3.0%
Cap rate
0.6%
Rent to Value Ratio
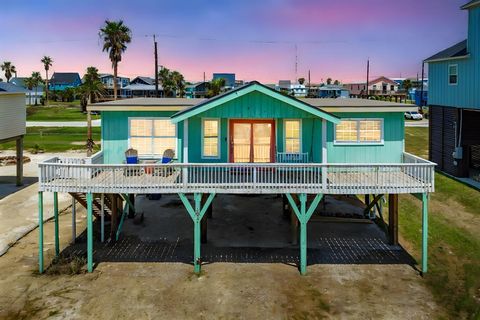
Active
$325,000
2
bds
|
2
ba
|
960
sqft
|
built
1965
402 Seashell Dr, Surfside Beach, TX 77541
$-551
Cash flow
-8.8%
Cash-on-Cash Return
3.6%
Cap rate
0.7%
Rent to Value Ratio
Active
$325,000
2
bds
|
2
ba
|
1,023
sqft
|
built
1968
334 Bay Ave, Surfside Beach, TX 77541
$-693
Cash flow
-11.1%
Cash-on-Cash Return
3.1%
Cap rate
0.6%
Rent to Value Ratio
Active
$465,000
4
bds
|
4
ba
|
1,518
sqft
|
built
2016
339 Jettyview Rd, Surfside Beach, TX 77541
$-305
Cash flow
-3.4%
Cash-on-Cash Return
4.9%
Cap rate
0.8%
Rent to Value Ratio
Active
$495,000
3
bds
|
3
ba
|
1,305
sqft
|
built
2006
111 Mar Vista Ct, Surfside Beach, TX 77541
$-1,578
Cash flow
-16.6%
Cash-on-Cash Return
1.9%
Cap rate
0.4%
Rent to Value Ratio
Active
$725,000
4
bds
|
2
ba
|
1,554
sqft
|
built
1976
4630 Blue Water Hwy, Surfside Beach, TX 77541
$-2,422
Cash flow
-17.4%
Cash-on-Cash Return
1.7%
Cap rate
0.4%
Rent to Value Ratio

Active
$499,900
3
bds
|
2
ba
|
864
sqft
|
built
1965
510 Beach Dr, Surfside Beach, TX 77541
$-1,978
Cash flow
-20.6%
Cash-on-Cash Return
0.9%
Cap rate
0.3%
Rent to Value Ratio
Active
$329,900
3
bds
|
1
ba
|
1,140
sqft
|
built
2006
337 Thunder Rd, Surfside Beach, TX 77541
$-916
Cash flow
-14.5%
Cash-on-Cash Return
2.3%
Cap rate
0.5%
Rent to Value Ratio
Active
$448,900
3
bds
|
2
ba
|
1,224
sqft
|
built
2006
984 Blue Water Hwy, Surfside Beach, TX 77541
$-1,577
Cash flow
-18.3%
Cash-on-Cash Return
1.5%
Cap rate
0.4%
Rent to Value Ratio
Active
$440,000
4
bds
|
3
ba
|
2,442
sqft
|
built
1980
211 Pompano Ln, Surfside Beach, TX 77541
$-376
Cash flow
-4.5%
Cash-on-Cash Return
4.7%
Cap rate
0.7%
Rent to Value Ratio
Active
$367,777
3
bds
|
2
ba
|
1,080
sqft
|
built
1984
1635 Sandpebble Pl, Surfside Beach, TX 77541
$-950
Cash flow
-13.5%
Cash-on-Cash Return
2.6%
Cap rate
0.5%
Rent to Value Ratio
Active
$777,777
4
bds
|
3
ba
|
1,916
sqft
|
built
1962
103 Southwind Dr, Surfside Beach, TX 77541
$-2,258
Cash flow
-15.1%
Cash-on-Cash Return
2.2%
Cap rate
0.5%
Rent to Value Ratio
Active
$322,777
3
bds
|
2
ba
|
1,025
sqft
|
built
1965
119 Sandpiper Ave, Surfside Beach, TX 77541
$-687
Cash flow
-11.1%
Cash-on-Cash Return
3.1%
Cap rate
0.6%
Rent to Value Ratio
Active
$729,900
5
bds
|
3
ba
|
1,880
sqft
|
built
2015
510 Point Lookout, Surfside Beach, TX 77541
$-1,979
Cash flow
-14.1%
Cash-on-Cash Return
2.4%
Cap rate
0.5%
Rent to Value Ratio

Active
$385,000
4
bds
|
3
ba
|
1,517
sqft
|
built
1950
417 Olive St, Surfside Beach, TX 77541
$-359
Cash flow
-4.9%
Cash-on-Cash Return
4.6%
Cap rate
0.7%
Rent to Value Ratio
Active
$224,900
3
bds
|
2
ba
|
990
sqft
|
built
1975
515 Thunder Rd, Surfside Beach, TX 77541
$-677
Cash flow
-15.7%
Cash-on-Cash Return
2.1%
Cap rate
0.6%
Rent to Value Ratio
Active
$329,900
3
bds
|
2
ba
|
1,056
sqft
|
built
2013
433 Seabean St, Surfside Beach, TX 77541
$-837
Cash flow
-13.2%
Cash-on-Cash Return
2.6%
Cap rate
0.5%
Rent to Value Ratio
Active
$511,869
3
bds
|
3
ba
|
1,235
sqft
|
built
2015
130 Coral Ct, Surfside Beach, TX 77541
$-1,456
Cash flow
-14.8%
Cash-on-Cash Return
2.3%
Cap rate
0.5%
Rent to Value Ratio

Active
$359,900
3
bds
|
2
ba
|
1,056
sqft
|
built
2013
1110 Treaty Dr, Surfside Beach, TX 77541
$-760
Cash flow
-11.0%
Cash-on-Cash Return
3.1%
Cap rate
0.6%
Rent to Value Ratio

Active
$475,000
3
bds
|
2
ba
|
660
sqft
|
built
1965
1115 White Cap Dr, Surfside Beach, TX 77541
$-1,806
Cash flow
-19.8%
Cash-on-Cash Return
1.1%
Cap rate
0.4%
Rent to Value Ratio
Active
$530,000
3
bds
|
2
ba
|
1,050
sqft
|
built
2011
85 Santar Loop, Surfside Beach, TX 77541
$-1,589
Cash flow
-15.6%
Cash-on-Cash Return
2.1%
Cap rate
0.4%
Rent to Value Ratio