Surfside Beach, TX Investment Properties for Sale
Browse homes for sale and investment properties in Surfside Beach, TX. Refine your search by price, property type, or more.
Best cash flowing properties in Surfside Beach, TX
Active
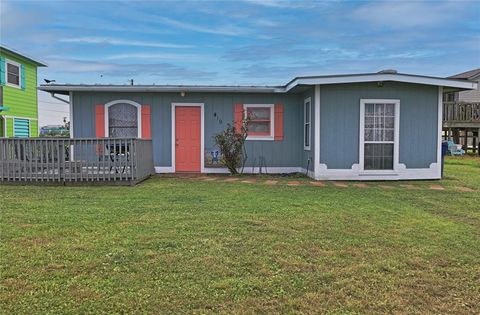
$189,900
2
bds
|
0
ba
|
814
sqft
|
built
1955
419 Murex St, Surfside Beach, TX 77541
$-211
Cash flow
-5.8%
Cash-on-Cash Return
4.9%
Cap rate
0.7%
Rent to Value Ratio
Active
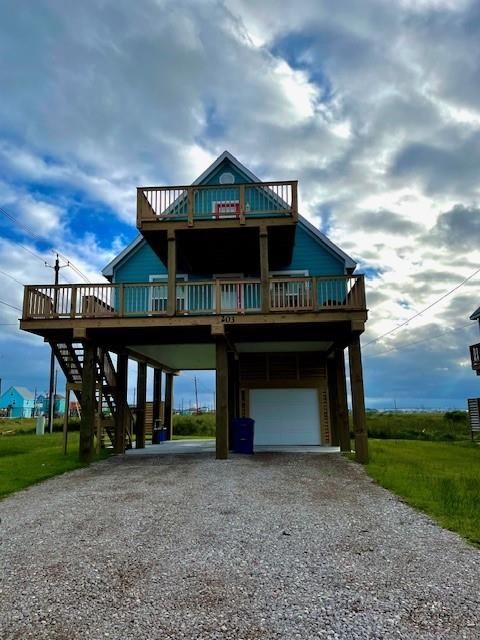
$425,000
3
bds
|
0
ba
|
1,176
sqft
|
built
2020
203 Sea Oats Dr, Surfside Beach, TX 77541
$-507
Cash flow
-6.2%
Cash-on-Cash Return
4.8%
Cap rate
0.6%
Rent to Value Ratio
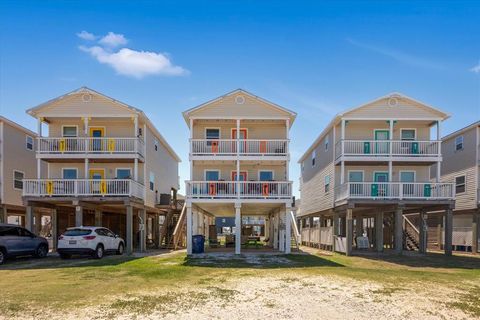
126 out of 139 properties for sale in Surfside Beach, TX
Limited Results Shown
Create a free account, or log in to reveal all property listings and enjoy the complete experience.
Active
$465,000
3
bds
|
0
ba
|
1,270
sqft
|
built
2014
123 Howard Ave, Surfside Beach, TX 77541
$-1,377
Cash flow
-15.5%
Cash-on-Cash Return
2.7%
Cap rate
0.5%
Rent to Value Ratio

Active
$549,900
3
bds
|
0
ba
|
1,202
sqft
|
built
1984
814 Beach Dr, Surfside Beach, TX 77541
$-1,891
Cash flow
-17.9%
Cash-on-Cash Return
2.1%
Cap rate
0.5%
Rent to Value Ratio

Active
$425,000
3
bds
|
0
ba
|
1,000
sqft
|
built
2003
904 Surf Dr, Surfside Beach, TX 77541
$-1,437
Cash flow
-17.6%
Cash-on-Cash Return
2.2%
Cap rate
0.5%
Rent to Value Ratio
Active
$425,000
3
bds
|
0
ba
|
1,176
sqft
|
built
2020
203 Sea Oats Dr, Surfside Beach, TX 77541
$-507
Cash flow
-6.2%
Cash-on-Cash Return
4.8%
Cap rate
0.6%
Rent to Value Ratio
Active
$599,000
3
bds
|
0
ba
|
1,617
sqft
|
built
2007
115 Mar Vista Ct, Surfside Beach, TX 77541
$-2,253
Cash flow
-19.6%
Cash-on-Cash Return
1.8%
Cap rate
0.4%
Rent to Value Ratio
Active
$189,900
2
bds
|
0
ba
|
814
sqft
|
built
1955
419 Murex St, Surfside Beach, TX 77541
$-211
Cash flow
-5.8%
Cash-on-Cash Return
4.9%
Cap rate
0.7%
Rent to Value Ratio