Tucker, GA Investment Properties for Sale
Browse homes for sale and investment properties in Tucker, GA. Refine your search by price, property type, or more.
Best cash flowing properties in Tucker, GA

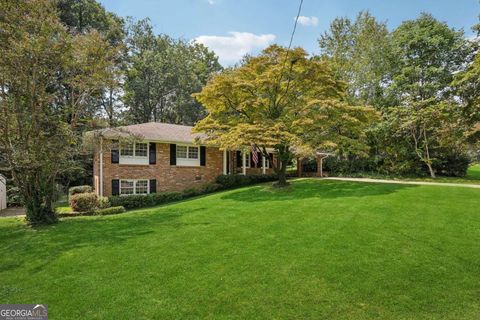
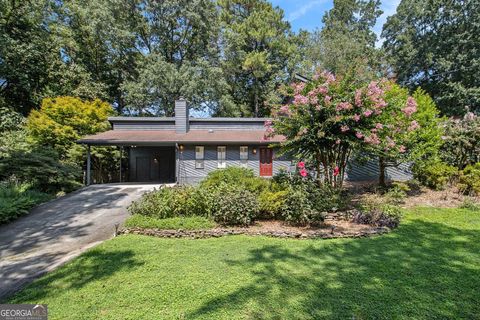
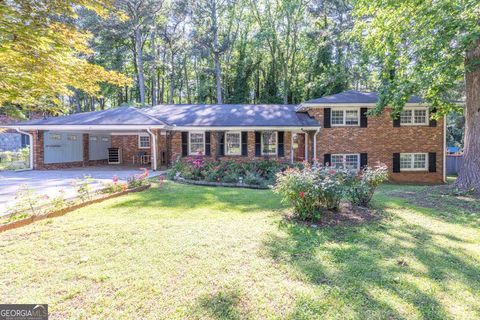
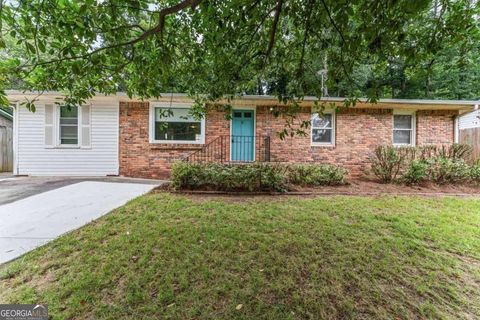
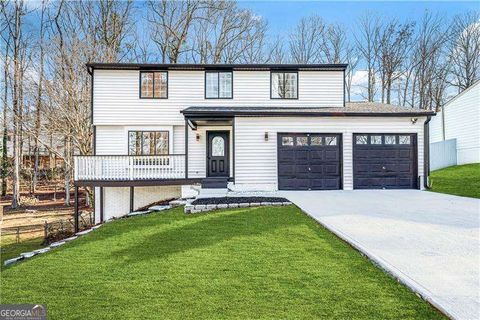
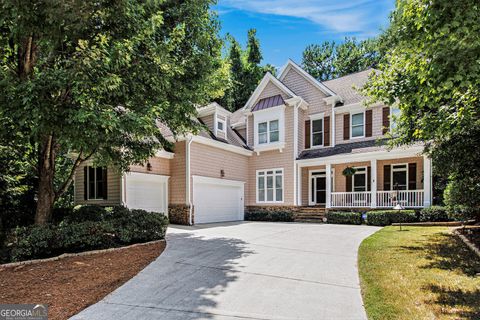
Active
$209,900
2
bds
|
2
ba
|
0
sqft
|
built
1987
6414 Wedgewood Trce, Tucker, GA 30084
$109
Cash flow
2.7%
Cash-on-Cash Return
6.8%
Cap rate
1.0%
Rent to Value Ratio

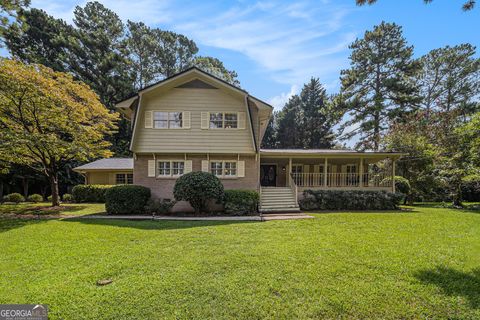
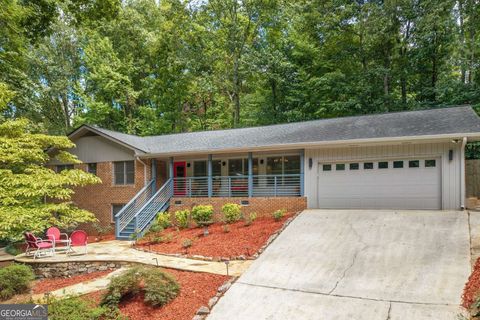
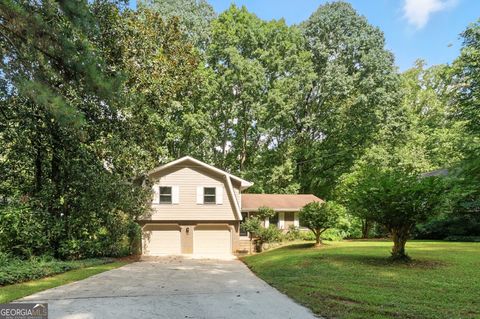
Active
$195,000
2
bds
|
2
ba
|
1,182
sqft
|
built
1986
3923 Woodridge Way, Tucker, GA 30084
$89
Cash flow
2.4%
Cash-on-Cash Return
6.7%
Cap rate
0.9%
Rent to Value Ratio
84 out of 87 properties for sale in Tucker, GA
Limited Results Shown
Create a free account, or log in to reveal all property listings and enjoy the complete experience.
Active
$425,000
6
bds
|
4
ba
|
1,998
sqft
|
built
1965
4465 Lake Ivanhoe Dr, Tucker, GA 30084
$-798
Cash flow
-9.8%
Cash-on-Cash Return
3.9%
Cap rate
0.6%
Rent to Value Ratio

Active
$295,000
2
bds
|
2.5
ba
|
1,584
sqft
|
built
2002
2105 Dillard Xing, Tucker, GA 30084
$-387
Cash flow
-6.8%
Cash-on-Cash Return
4.6%
Cap rate
0.7%
Rent to Value Ratio

Active
$236,000
2
bds
|
1
ba
|
1,282
sqft
|
built
1946
4380 Lawrenceville Hwy, Tucker, GA 30084
$-280
Cash flow
-6.2%
Cash-on-Cash Return
4.7%
Cap rate
0.8%
Rent to Value Ratio

Active
$450,000
3
bds
|
2
ba
|
1,764
sqft
|
built
1967
227 Kenvilla Ct, Tucker, GA 30084
$-1,043
Cash flow
-12.1%
Cash-on-Cash Return
3.4%
Cap rate
0.5%
Rent to Value Ratio

Active
$375,000
3
bds
|
3.5
ba
|
2,123
sqft
|
built
2004
1372 Idlewood Parc Xing, Tucker, GA 30084
$-937
Cash flow
-13.0%
Cash-on-Cash Return
3.1%
Cap rate
0.6%
Rent to Value Ratio

Active
$488,000
4
bds
|
3
ba
|
2,125
sqft
|
built
1968
3986 Woburn Dr, Tucker, GA 30084
$-868
Cash flow
-9.3%
Cash-on-Cash Return
4.0%
Cap rate
0.5%
Rent to Value Ratio
Active
$550,000
4
bds
|
2.5
ba
|
2,592
sqft
|
built
1966
2703 Gleneagles Dr, Tucker, GA 30084
$-1,411
Cash flow
-13.4%
Cash-on-Cash Return
3.1%
Cap rate
0.5%
Rent to Value Ratio
Active
$460,000
4
bds
|
2.5
ba
|
1,976
sqft
|
built
1966
2804 Middleham Ct, Tucker, GA 30084
$-757
Cash flow
-8.6%
Cash-on-Cash Return
4.2%
Cap rate
0.6%
Rent to Value Ratio
Active
$410,000
3
bds
|
2
ba
|
1,924
sqft
|
built
1986
1107 Sanfords Walk, Tucker, GA 30084
$-454
Cash flow
-5.8%
Cash-on-Cash Return
4.8%
Cap rate
0.6%
Rent to Value Ratio
Active
$430,000
3
bds
|
2
ba
|
1,404
sqft
|
built
1977
2690 Gleneagles Dr, Tucker, GA 30084
$-626
Cash flow
-7.6%
Cash-on-Cash Return
4.4%
Cap rate
0.7%
Rent to Value Ratio
Active
$199,900
3
bds
|
2.5
ba
|
1,594
sqft
|
built
1974
4411 Idlewood Ln, Tucker, GA 30084
$-333
Cash flow
-8.7%
Cash-on-Cash Return
4.1%
Cap rate
1.0%
Rent to Value Ratio
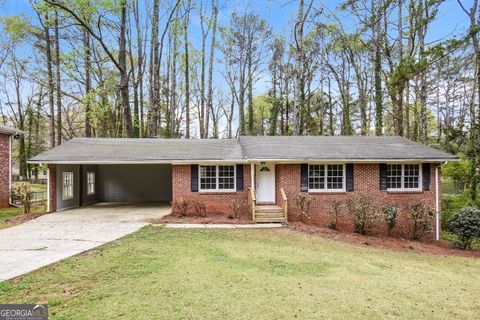
Active
$365,000
4
bds
|
2
ba
|
1,300
sqft
|
built
1955
2105 Fellowship Rd, Tucker, GA 30084
$-833
Cash flow
-11.9%
Cash-on-Cash Return
3.4%
Cap rate
0.6%
Rent to Value Ratio
Active
$225,000
3
bds
|
2
ba
|
1,242
sqft
|
built
1975
3599 Woodbriar Cir, Tucker, GA 30084
$-669
Cash flow
-15.5%
Cash-on-Cash Return
2.6%
Cap rate
0.8%
Rent to Value Ratio
Active
$419,900
4
bds
|
2
ba
|
0
sqft
|
built
1962
2648 Oswood Dr, Tucker, GA 30084
$-666
Cash flow
-8.3%
Cash-on-Cash Return
4.2%
Cap rate
0.6%
Rent to Value Ratio

Active
$405,000
6
bds
|
2.5
ba
|
0
sqft
|
built
1990
350 Rams Way, Tucker, GA 30084
$-621
Cash flow
-8.0%
Cash-on-Cash Return
4.3%
Cap rate
0.7%
Rent to Value Ratio
Active
$605,900
4
bds
|
3.5
ba
|
2,740
sqft
|
built
1968
2501 Midvale Ct, Tucker, GA 30084
$-1,134
Cash flow
-9.8%
Cash-on-Cash Return
3.9%
Cap rate
0.6%
Rent to Value Ratio
Active
$700,000
5
bds
|
3
ba
|
0
sqft
|
built
1965
2760 Caraway Dr, Tucker, GA 30084
$-1,765
Cash flow
-13.2%
Cash-on-Cash Return
3.1%
Cap rate
0.4%
Rent to Value Ratio
Active
$695,240
7
bds
|
3
ba
|
4,587
sqft
|
built
1958
2173 Hannah Ln, Tucker, GA 30084
$-2,038
Cash flow
-15.3%
Cash-on-Cash Return
2.6%
Cap rate
0.4%
Rent to Value Ratio
Active
$325,000
3
bds
|
1.5
ba
|
1,340
sqft
|
built
1962
1678 Avon Ave, Tucker, GA 30084
$-327
Cash flow
-5.2%
Cash-on-Cash Return
4.9%
Cap rate
0.8%
Rent to Value Ratio
Active
$389,900
3
bds
|
2
ba
|
2,350
sqft
|
built
1970
4520 Atlas Pl, Tucker, GA 30084
$-542
Cash flow
-7.3%
Cash-on-Cash Return
4.5%
Cap rate
0.6%
Rent to Value Ratio
Active
$177,500
1
bds
|
1
ba
|
0
sqft
|
built
1982
3845 Cedar Cir, Tucker, GA 30084
$-222
Cash flow
-6.5%
Cash-on-Cash Return
4.6%
Cap rate
0.9%
Rent to Value Ratio
Active
$450,000
4
bds
|
2.5
ba
|
2,200
sqft
|
built
1985
994 Coach House Dr, Tucker, GA 30084
$-973
Cash flow
-11.3%
Cash-on-Cash Return
3.6%
Cap rate
0.6%
Rent to Value Ratio
Active
$429,999
5
bds
|
3.5
ba
|
2,644
sqft
|
built
1980
477 Engle Dr, Tucker, GA 30084
$-469
Cash flow
-5.7%
Cash-on-Cash Return
4.8%
Cap rate
0.7%
Rent to Value Ratio

Active
$697,500
7
bds
|
4
ba
|
5,000
sqft
|
built
2007
5796 Princeton Run Trl, Tucker, GA 30084
$-1,622
Cash flow
-12.1%
Cash-on-Cash Return
3.4%
Cap rate
0.4%
Rent to Value Ratio
Active
$468,000
3
bds
|
2
ba
|
0
sqft
|
built
1964
4103 Laynewood Cir, Tucker, GA 30084
$-1,114
Cash flow
-12.4%
Cash-on-Cash Return
3.3%
Cap rate
0.5%
Rent to Value Ratio
Active
$439,999
3
bds
|
2
ba
|
0
sqft
|
built
1973
2641 Sandpiper Dr, Tucker, GA 30084
$-623
Cash flow
-7.4%
Cash-on-Cash Return
4.4%
Cap rate
0.6%
Rent to Value Ratio

Active
$199,500
2
bds
|
3
ba
|
0
sqft
|
built
1989
6465 Wedgeview Dr, Tucker, GA 30084
$-682
Cash flow
-17.8%
Cash-on-Cash Return
2.0%
Cap rate
0.7%
Rent to Value Ratio
Active
$575,000
4
bds
|
3.5
ba
|
2,606
sqft
|
built
2013
29 Lankford Rd, Tucker, GA 30084
$-1,642
Cash flow
-14.9%
Cash-on-Cash Return
2.7%
Cap rate
0.5%
Rent to Value Ratio
Active
$850,000
6
bds
|
5
ba
|
5,299
sqft
|
built
2005
3698 Lakeview Dr, Tucker, GA 30084
$-2,057
Cash flow
-12.6%
Cash-on-Cash Return
3.2%
Cap rate
0.5%
Rent to Value Ratio
Active
$524,999
6
bds
|
3.5
ba
|
4,039
sqft
|
built
1993
2462 Empire Forest Dr, Tucker, GA 30084
$-1,238
Cash flow
-12.3%
Cash-on-Cash Return
3.3%
Cap rate
0.6%
Rent to Value Ratio

Active
$399,900
3
bds
|
2
ba
|
1,449
sqft
|
built
1964
4470 Lake Ivanhoe Dr, Tucker, GA 30084
$-455
Cash flow
-5.9%
Cash-on-Cash Return
4.8%
Cap rate
0.7%
Rent to Value Ratio

Active
$200,000
2
bds
|
2
ba
|
1,182
sqft
|
built
1986
3919 Woodridge Way, Tucker, GA 30084
$-250
Cash flow
-6.5%
Cash-on-Cash Return
4.6%
Cap rate
0.9%
Rent to Value Ratio

Active
$155,000
2
bds
|
2
ba
|
1,182
sqft
|
built
1986
5011 Woodridge Way, Tucker, GA 30084
$-143
Cash flow
-4.8%
Cash-on-Cash Return
5.0%
Cap rate
1.2%
Rent to Value Ratio

Active
$290,000
2
bds
|
2.5
ba
|
1,186
sqft
|
built
2000
4210 Quailbrook Ct, Tucker, GA 30084
$-234
Cash flow
-4.2%
Cash-on-Cash Return
5.2%
Cap rate
0.7%
Rent to Value Ratio
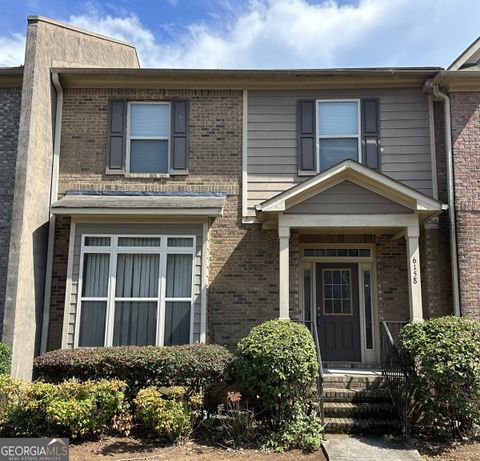
Active
$375,000
3
bds
|
3
ba
|
2,611
sqft
|
built
2006
6158 Thorncrest Dr, Tucker, GA 30084
$-1,014
Cash flow
-14.1%
Cash-on-Cash Return
2.9%
Cap rate
0.6%
Rent to Value Ratio
Active
$339,000
3
bds
|
2
ba
|
1,308
sqft
|
built
1967
3773 Sarahs Ln, Tucker, GA 30084
$-553
Cash flow
-8.5%
Cash-on-Cash Return
4.2%
Cap rate
0.7%
Rent to Value Ratio
Active
$598,000
4
bds
|
3.5
ba
|
2,522
sqft
|
built
2018
1864 Stockton Dr, Tucker, GA 30084
$-1,612
Cash flow
-14.1%
Cash-on-Cash Return
2.9%
Cap rate
0.6%
Rent to Value Ratio

Active
$585,000
5
bds
|
4.5
ba
|
5,236
sqft
|
built
1987
640 Belgrave Ln, Tucker, GA 30084
$-1,309
Cash flow
-11.7%
Cash-on-Cash Return
3.5%
Cap rate
0.5%
Rent to Value Ratio