Bexar County Investment Properties for Sale
Browse homes for sale and investment properties in Bexar County. Refine your search by price, property type, or more.
Best cash flowing properties in Bexar County
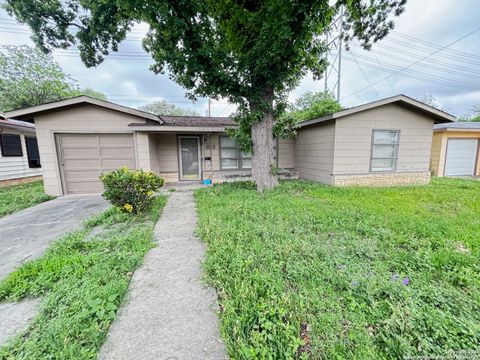
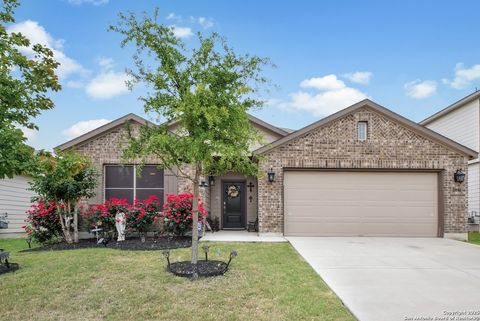
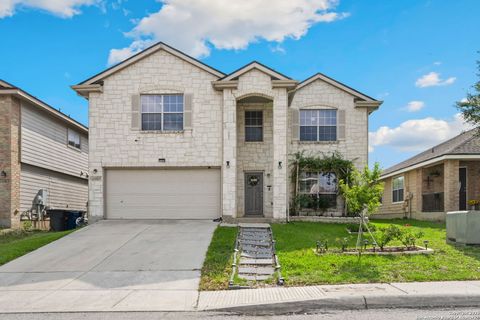
Active
$120,000
2
bds
|
1
ba
|
672
sqft
|
built
1950
531 Cooper St, San Antonio, TX 78210
$164
Cash flow
7.1%
Cash-on-Cash Return
7.3%
Cap rate
1.2%
Rent to Value Ratio
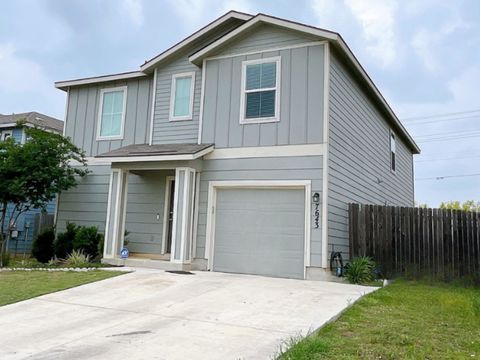
Active
$110,000
2
bds
|
1
ba
|
784
sqft
|
built
1949
3403 W Travis St, San Antonio, TX 78207
$136
Cash flow
6.5%
Cash-on-Cash Return
7.2%
Cap rate
1.2%
Rent to Value Ratio
4,170 out of 4,572 properties for sale in Bexar County
Limited Results Shown
Create a free account, or log in to reveal all property listings and enjoy the complete experience.
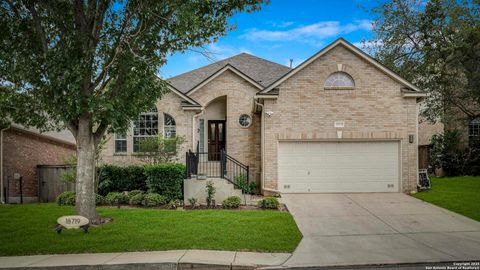
Active
$495,000
4
bds
|
4
ba
|
3,118
sqft
|
built
1978
11402 Mission Trace St, San Antonio, TX 78230
$-1,407
Cash flow
-14.8%
Cash-on-Cash Return
2.3%
Cap rate
0.6%
Rent to Value Ratio
Active
$133,000
4
bds
|
1
ba
|
900
sqft
|
built
1948
113 Chico Aly, San Antonio, TX 78225
$13
Cash flow
0.5%
Cash-on-Cash Return
5.8%
Cap rate
1.0%
Rent to Value Ratio
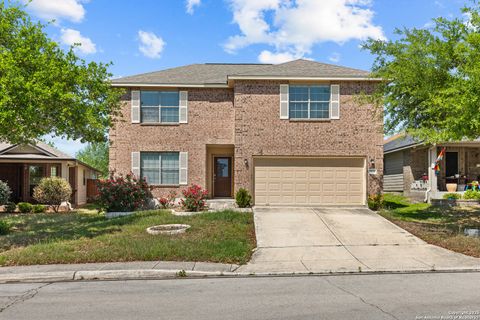
Active
$540,000
4
bds
|
3
ba
|
2,779
sqft
|
built
2003
18719 Rogers Pass, San Antonio, TX 78258
$-1,446
Cash flow
-14.0%
Cash-on-Cash Return
2.5%
Cap rate
0.6%
Rent to Value Ratio
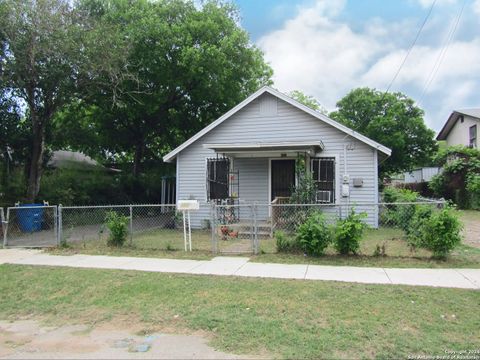
Active
$110,000
4
bds
|
1
ba
|
1,081
sqft
|
built
1935
217 Lancaster, San Antonio, TX 78214
$-18
Cash flow
-0.9%
Cash-on-Cash Return
5.5%
Cap rate
1.1%
Rent to Value Ratio
Active
$219,900
2
bds
|
2
ba
|
1,168
sqft
|
built
1983
11009 Forest Crown, Live Oak, TX 78233
$-641
Cash flow
-15.2%
Cash-on-Cash Return
2.2%
Cap rate
0.5%
Rent to Value Ratio
Active
$272,250
4
bds
|
3
ba
|
2,623
sqft
|
built
2004
3715 Bolden Flds, Converse, TX 78109
$-416
Cash flow
-8.0%
Cash-on-Cash Return
3.8%
Cap rate
0.7%
Rent to Value Ratio
Active
$299,000
4
bds
|
3
ba
|
2,118
sqft
|
built
2010
3919 Maiden Way, Converse, TX 78109
$-599
Cash flow
-10.5%
Cash-on-Cash Return
3.3%
Cap rate
0.6%
Rent to Value Ratio
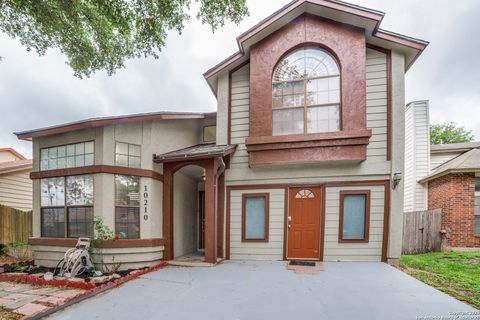
Active
$254,000
4
bds
|
3
ba
|
1,752
sqft
|
built
1985
10210 Apricot Field Dr, San Antonio, TX 78245
$-493
Cash flow
-10.1%
Cash-on-Cash Return
3.3%
Cap rate
0.6%
Rent to Value Ratio
Active
$272,500
3
bds
|
3
ba
|
2,254
sqft
|
built
2001
7814 Winterstone Dr, San Antonio, TX 78254
$-367
Cash flow
-7.0%
Cash-on-Cash Return
4.1%
Cap rate
0.7%
Rent to Value Ratio
Active
$249,000
4
bds
|
2
ba
|
1,658
sqft
|
built
1979
8303 Meadow Fire St, San Antonio, TX 78251
$-455
Cash flow
-9.5%
Cash-on-Cash Return
3.5%
Cap rate
0.6%
Rent to Value Ratio
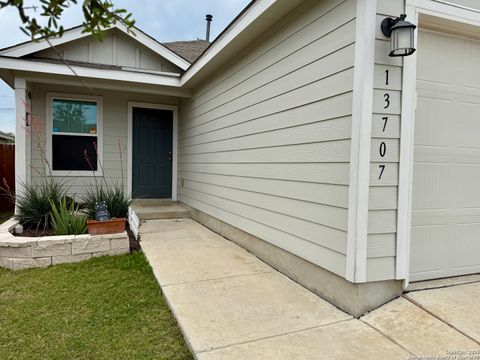
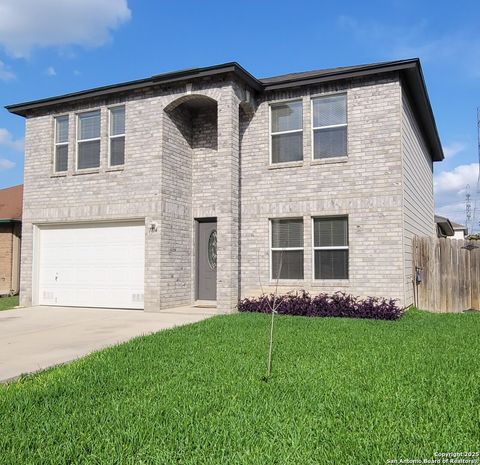
Active
$209,990
3
bds
|
2
ba
|
1,260
sqft
|
built
2020
13707 Arroyo Seco, San Antonio, TX 78223
$-245
Cash flow
-6.1%
Cash-on-Cash Return
4.3%
Cap rate
0.8%
Rent to Value Ratio
Active
$315,000
2
bds
|
3
ba
|
1,098
sqft
|
built
1945
1022 Pasadena, San Antonio, TX 78201
$-869
Cash flow
-14.4%
Cash-on-Cash Return
2.4%
Cap rate
0.6%
Rent to Value Ratio
Active
$250,000
4
bds
|
0
ba
|
1,314
sqft
|
built
1920
231 Gabriel, San Antonio, TX 78202
$-601
Cash flow
-12.5%
Cash-on-Cash Return
2.8%
Cap rate
0.5%
Rent to Value Ratio
Active
$1,400,000
4
bds
|
5
ba
|
3,983
sqft
|
built
1930
304 Kennedy Ave, Alamo Heights, TX 78209
$-4,624
Cash flow
-17.2%
Cash-on-Cash Return
1.7%
Cap rate
0.4%
Rent to Value Ratio
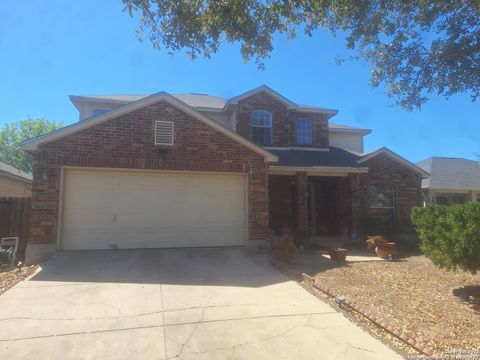
Active
$430,000
5
bds
|
4
ba
|
3,452
sqft
|
built
2020
13911 Lazada, San Antonio, TX 78245
$-595
Cash flow
-7.2%
Cash-on-Cash Return
4.0%
Cap rate
0.7%
Rent to Value Ratio
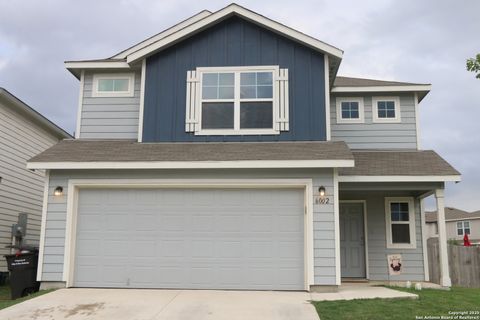
Active
$305,000
4
bds
|
3
ba
|
2,027
sqft
|
built
2021
6002 Bluestem Way, San Antonio, TX 78218
$-668
Cash flow
-11.4%
Cash-on-Cash Return
3.0%
Cap rate
0.7%
Rent to Value Ratio
Active
$549,450
4
bds
|
4
ba
|
3,184
sqft
|
built
2005
322 Waxberry Trl, San Antonio, TX 78256
$-1,052
Cash flow
-10.0%
Cash-on-Cash Return
3.4%
Cap rate
0.6%
Rent to Value Ratio
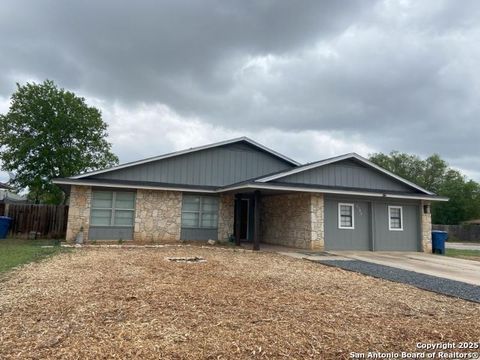
Active
$219,000
3
bds
|
2
ba
|
1,407
sqft
|
built
1969
7442 Castle Trail Dr, San Antonio, TX 78218
$-309
Cash flow
-7.4%
Cash-on-Cash Return
4.0%
Cap rate
0.7%
Rent to Value Ratio
Active
$2,200,000
5
bds
|
6
ba
|
6,185
sqft
|
built
2003
410 Bentley Mnr, Shavano Park, TX 78249
$-11,271
Cash flow
-26.7%
Cash-on-Cash Return
-0.5%
Cap rate
0.2%
Rent to Value Ratio

Active
$255,000
3
bds
|
3
ba
|
1,704
sqft
|
built
2002
638 Coral Hbr, San Antonio, TX 78251
$-452
Cash flow
-9.2%
Cash-on-Cash Return
3.6%
Cap rate
0.7%
Rent to Value Ratio
Active
$209,000
4
bds
|
2
ba
|
1,056
sqft
|
built
1964
209 Ivy Ln, Universal City, TX 78148
$-254
Cash flow
-6.3%
Cash-on-Cash Return
4.2%
Cap rate
0.8%
Rent to Value Ratio
Active
$1,950,000
12
bds
|
0
ba
|
7,895
sqft
|
built
2020
808 E Carson St, San Antonio, TX 78208
$-10,835
Cash flow
-29.0%
Cash-on-Cash Return
-1.0%
Cap rate
0.1%
Rent to Value Ratio
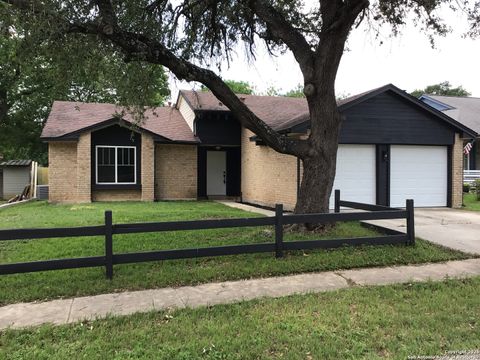
Active
$150,000
2
bds
|
2
ba
|
959
sqft
|
built
1982
4107 Medical Dr, San Antonio, TX 78229
$-586
Cash flow
-20.4%
Cash-on-Cash Return
1.0%
Cap rate
0.9%
Rent to Value Ratio
Active
$275,000
3
bds
|
1
ba
|
1,344
sqft
|
built
1951
523 Weizmann St, San Antonio, TX 78213
$-386
Cash flow
-7.3%
Cash-on-Cash Return
4.0%
Cap rate
0.6%
Rent to Value Ratio
Active
$120,000
2
bds
|
1
ba
|
402
sqft
|
built
1947
918 S Hamilton St, San Antonio, TX 78207
$-15
Cash flow
-0.7%
Cash-on-Cash Return
5.5%
Cap rate
0.8%
Rent to Value Ratio
Active
$310,000
3
bds
|
3
ba
|
2,530
sqft
|
built
2003
7315 Carriage Ln, San Antonio, TX 78249
$-487
Cash flow
-8.2%
Cash-on-Cash Return
3.8%
Cap rate
0.8%
Rent to Value Ratio
Active
$365,000
4
bds
|
3
ba
|
2,051
sqft
|
built
2021
12136 Icon Rdg, San Antonio, TX 78253
$-820
Cash flow
-11.7%
Cash-on-Cash Return
3.0%
Cap rate
0.6%
Rent to Value Ratio
Active
$299,999
3
bds
|
2
ba
|
1,975
sqft
|
built
2018
10556 Pablo Way, Converse, TX 78109
$-590
Cash flow
-10.3%
Cash-on-Cash Return
3.3%
Cap rate
0.7%
Rent to Value Ratio
Active
$272,000
3
bds
|
3
ba
|
2,241
sqft
|
built
2013
4326 Safe Hbr, San Antonio, TX 78244
$-379
Cash flow
-7.3%
Cash-on-Cash Return
4.0%
Cap rate
0.7%
Rent to Value Ratio
Active
$270,000
4
bds
|
2
ba
|
1,863
sqft
|
built
1984
6149 Cloudy Ridge St, San Antonio, TX 78247
$-459
Cash flow
-8.9%
Cash-on-Cash Return
3.6%
Cap rate
0.7%
Rent to Value Ratio
Active
$735,000
5
bds
|
5
ba
|
4,149
sqft
|
built
2014
10310 Ivy Horn, Schertz, TX 78154
$-2,377
Cash flow
-16.9%
Cash-on-Cash Return
1.8%
Cap rate
0.5%
Rent to Value Ratio
Active
$240,000
3
bds
|
2
ba
|
1,457
sqft
|
built
2010
8611 Spotted Owl, Converse, TX 78109
$-421
Cash flow
-9.2%
Cash-on-Cash Return
3.6%
Cap rate
0.7%
Rent to Value Ratio
Active
$182,000
2
bds
|
1
ba
|
980
sqft
|
built
2001
10227 Redfish Cavern, San Antonio, TX 78245
$-181
Cash flow
-5.2%
Cash-on-Cash Return
4.5%
Cap rate
0.8%
Rent to Value Ratio
Active
$220,000
3
bds
|
2
ba
|
1,178
sqft
|
built
2016
6126 Pleasant Lk, San Antonio, TX 78222
$-302
Cash flow
-7.2%
Cash-on-Cash Return
4.0%
Cap rate
0.7%
Rent to Value Ratio
Active
$299,900
3
bds
|
2
ba
|
1,965
sqft
|
built
2005
15619 Hastings Park, Selma, TX 78154
$-515
Cash flow
-9.0%
Cash-on-Cash Return
3.6%
Cap rate
0.7%
Rent to Value Ratio
Active
$335,000
4
bds
|
3
ba
|
2,882
sqft
|
built
2006
16907 Quartett Ln, San Antonio, TX 78266
$-466
Cash flow
-7.3%
Cash-on-Cash Return
4.0%
Cap rate
0.8%
Rent to Value Ratio
Active
$274,999
4
bds
|
3
ba
|
2,252
sqft
|
built
2019
7643 Hercules Pt, San Antonio, TX 78252
$-657
Cash flow
-12.5%
Cash-on-Cash Return
2.8%
Cap rate
0.7%
Rent to Value Ratio
Active
$372,000
3
bds
|
2
ba
|
2,383
sqft
|
built
2021
5312 Espinoso Way, San Antonio, TX 78261
$-748
Cash flow
-10.5%
Cash-on-Cash Return
3.3%
Cap rate
0.7%
Rent to Value Ratio