Bell County Investment Properties for Sale
Browse homes for sale and investment properties in Bell County. Refine your search by price, property type, or more.
Best cash flowing properties in Bell County
Active
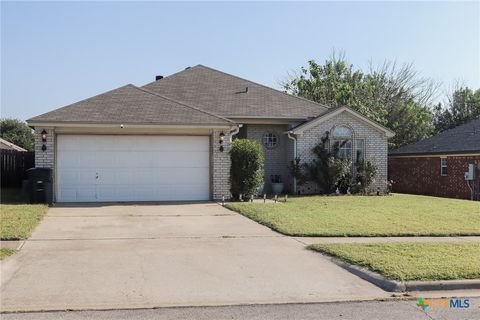
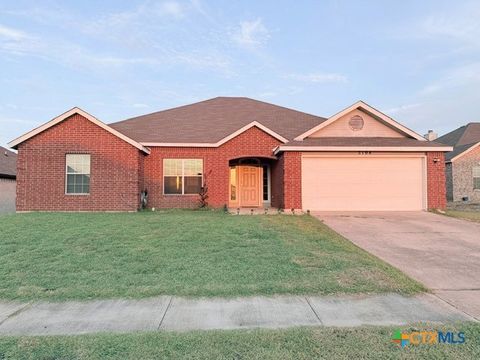
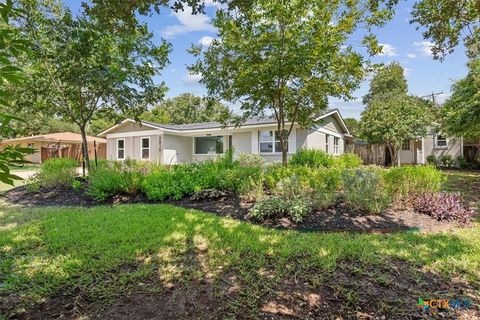
$214,900
3
bds
|
2
ba
|
1,424
sqft
|
built
1999
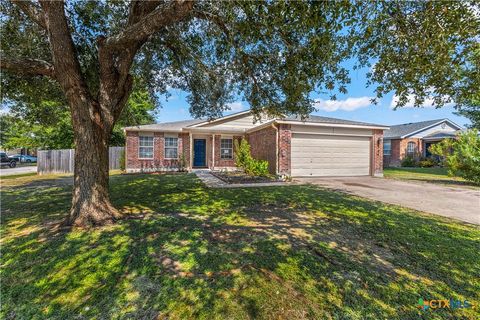
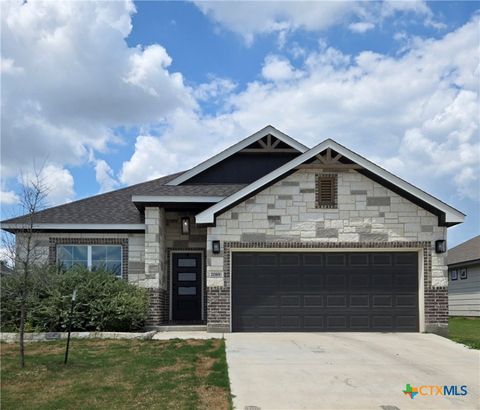
2107 Amethyst Dr, Killeen, TX 76549
$87
Cash flow
2.1%
Cash-on-Cash Return
6.2%
Cap rate
0.7%
Rent to Value Ratio
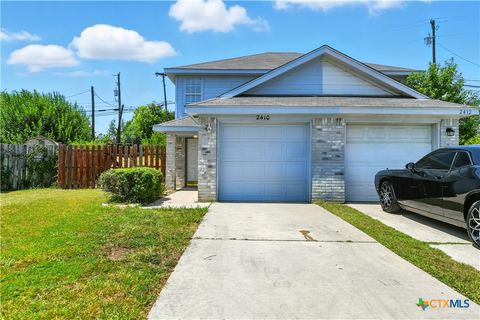
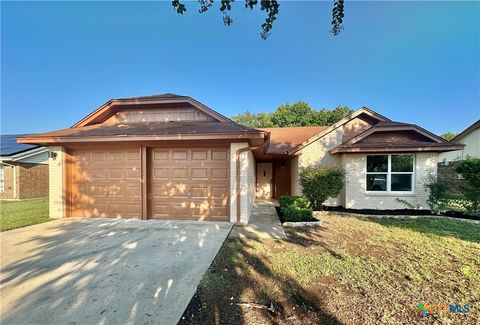
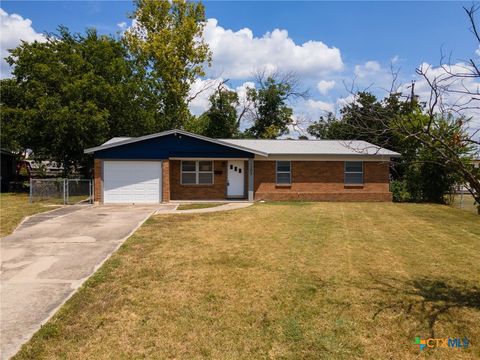
Active
$139,000
2
bds
|
2
ba
|
1,122
sqft
|
built
1995
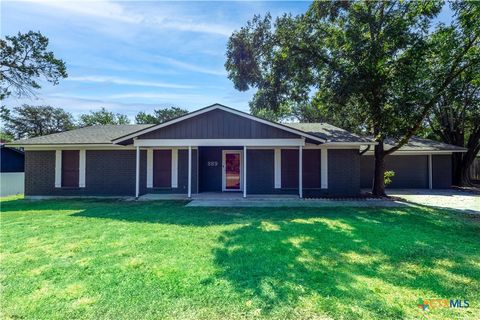
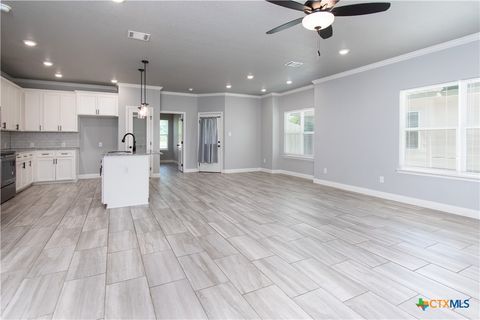
2410 Royal Crest Cir, Killeen, TX 76549
$42
Cash flow
1.6%
Cash-on-Cash Return
6.0%
Cap rate
0.9%
Rent to Value Ratio
824 out of 1,303 properties for sale in Bell County
Limited Results Shown
Create a free account, or log in to reveal all property listings and enjoy the complete experience.

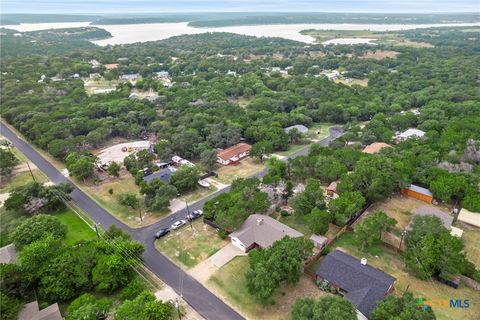
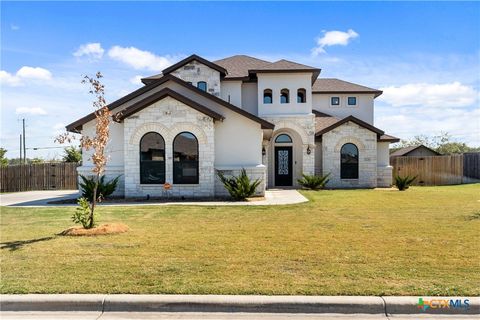
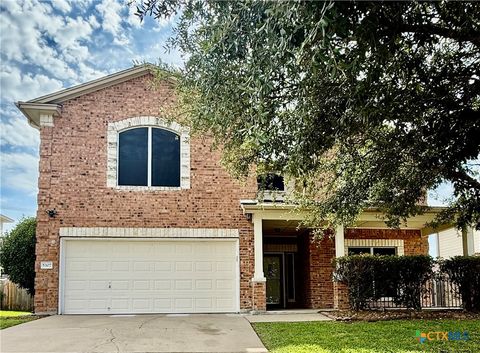
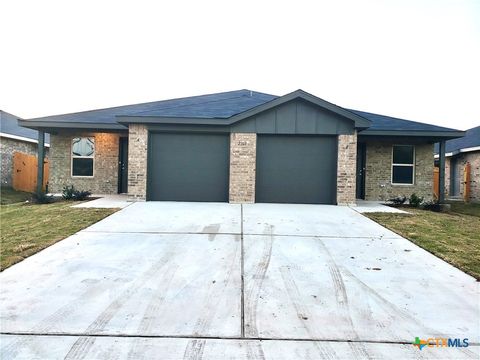
Active
$535,000
4
bds
|
2
ba
|
2,560
sqft
|
built
2022
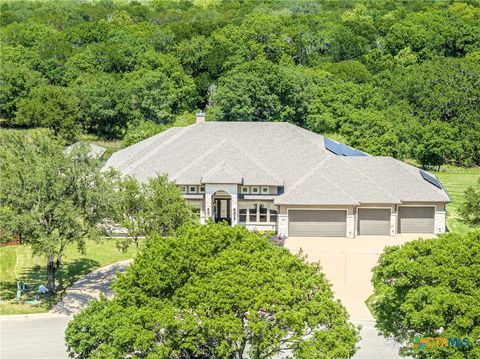
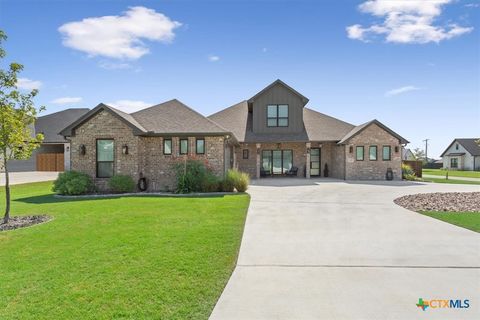
2711 Cibolo Creek Dr, Temple, TX 76502
$-646
Cash flow
-6.3%
Cash-on-Cash Return
4.2%
Cap rate
0.5%
Rent to Value Ratio
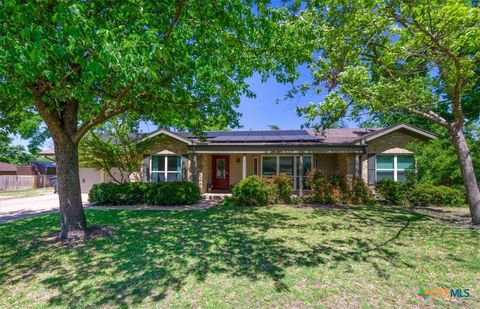
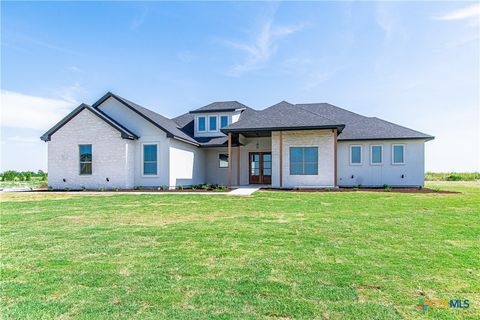
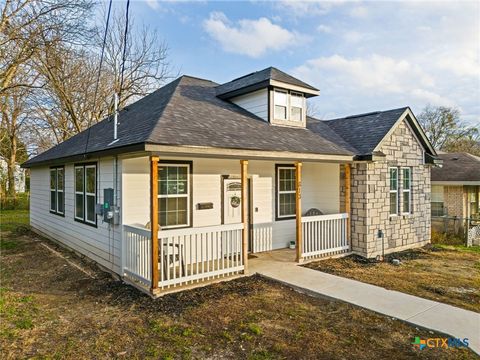
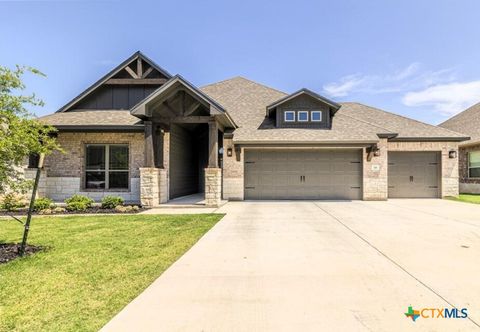
Active
$365,000
4
bds
|
2
ba
|
1,842
sqft
|
built
1994
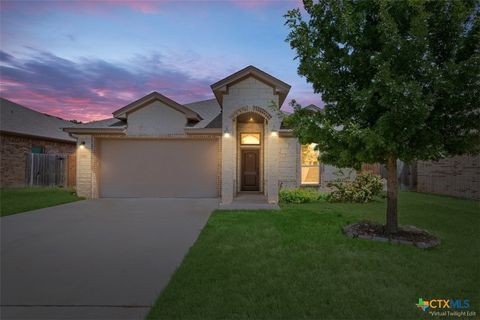
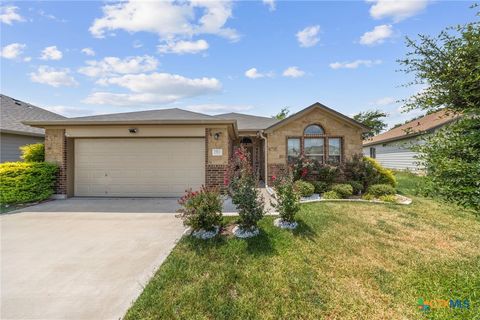
14867 Cart Rd, Temple, TX 76502
$-834
Cash flow
-11.9%
Cash-on-Cash Return
2.9%
Cap rate
0.5%
Rent to Value Ratio
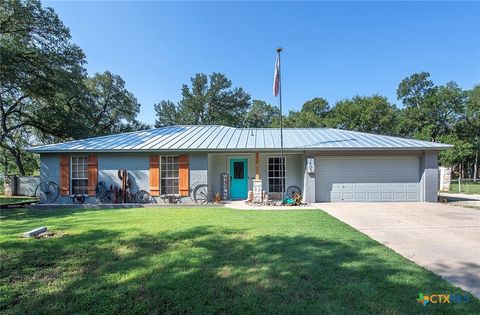
Active
$360,000
4
bds
|
3
ba
|
2,438
sqft
|
built
1966
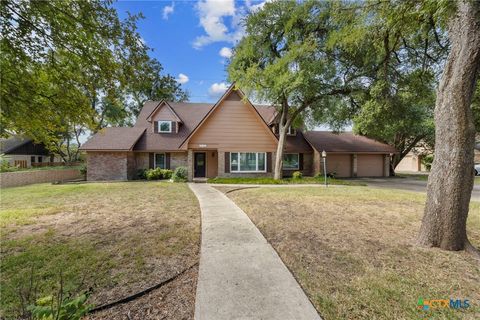
3506 Buffalo Trl, Temple, TX 76504
$-715
Cash flow
-10.4%
Cash-on-Cash Return
3.3%
Cap rate
0.6%
Rent to Value Ratio
Active
$559,000
4
bds
|
3
ba
|
2,459
sqft
|
built
2020
1052 Parkview Dr Way, Salado, TX 76571
$-1,126
Cash flow
-10.5%
Cash-on-Cash Return
3.3%
Cap rate
0.6%
Rent to Value Ratio
Active
$639,900
4
bds
|
4
ba
|
2,757
sqft
|
built
2023
8152 Evenfall Ln, Temple, TX 76501
$-1,659
Cash flow
-13.5%
Cash-on-Cash Return
2.6%
Cap rate
0.5%
Rent to Value Ratio
Active
$295,000
3
bds
|
2
ba
|
1,211
sqft
|
built
2003
1402 Sharon Rd, Belton, TX 76513
$-683
Cash flow
-12.1%
Cash-on-Cash Return
2.9%
Cap rate
0.6%
Rent to Value Ratio
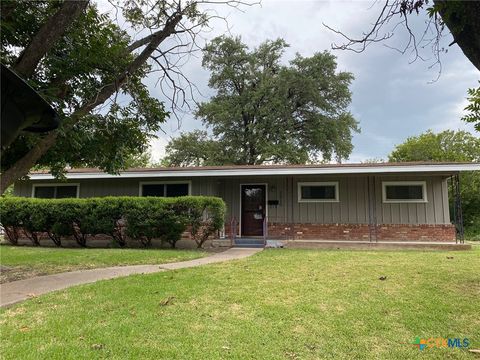
Active
$219,000
3
bds
|
2
ba
|
1,786
sqft
|
built
1956
2610 N 15th St, Temple, TX 76501
$-188
Cash flow
-4.5%
Cash-on-Cash Return
4.6%
Cap rate
0.8%
Rent to Value Ratio
Active
$228,500
3
bds
|
2
ba
|
1,974
sqft
|
built
2005
2104 Prestige Loop, Killeen, TX 76549
$-359
Cash flow
-8.2%
Cash-on-Cash Return
3.8%
Cap rate
0.7%
Rent to Value Ratio
Active
$228,500
3
bds
|
2
ba
|
1,431
sqft
|
built
1986
3321 Sungate Dr, Killeen, TX 76549
$-308
Cash flow
-7.0%
Cash-on-Cash Return
4.1%
Cap rate
0.7%
Rent to Value Ratio
Active
$339,000
4
bds
|
3
ba
|
3,368
sqft
|
built
2004
5307 White Rock Dr, Killeen, TX 76542
$-744
Cash flow
-11.5%
Cash-on-Cash Return
3.0%
Cap rate
0.6%
Rent to Value Ratio
Active
$245,000
3
bds
|
2
ba
|
1,244
sqft
|
built
2023
813 S 22nd St, Temple, TX 76501
$-279
Cash flow
-5.9%
Cash-on-Cash Return
4.3%
Cap rate
0.7%
Rent to Value Ratio
Active
$489,900
4
bds
|
3
ba
|
2,445
sqft
|
built
1961
2810 Lilac Ln, Temple, TX 76502
$-1,653
Cash flow
-17.6%
Cash-on-Cash Return
1.6%
Cap rate
0.4%
Rent to Value Ratio
Active
$168,000
3
bds
|
1
ba
|
1,011
sqft
|
built
1963
1203 Valentine St, Killeen, TX 76549
$-148
Cash flow
-4.6%
Cash-on-Cash Return
4.6%
Cap rate
0.7%
Rent to Value Ratio
Active
$359,000
bds
|
0
ba
|
2,520
sqft
|
built
2021
2313 Zanoletti Dr, Temple, TX 76504
$-1,528
Cash flow
-22.2%
Cash-on-Cash Return
0.6%
Cap rate
0.4%
Rent to Value Ratio
Active
$479,000
4
bds
|
3
ba
|
2,630
sqft
|
built
2024
711 Saddlehorn Dr, Temple, TX 76502
$-1,530
Cash flow
-16.7%
Cash-on-Cash Return
1.8%
Cap rate
0.2%
Rent to Value Ratio
Active
$264,000
4
bds
|
2
ba
|
1,836
sqft
|
built
2005
5504 Southern Crossing Dr, Temple, TX 76502
$-507
Cash flow
-10.0%
Cash-on-Cash Return
3.4%
Cap rate
0.7%
Rent to Value Ratio
Active
$294,500
4
bds
|
2
ba
|
1,808
sqft
|
built
1973
889 Nola Ruth Blvd, Harker Heights, TX 76548
$-534
Cash flow
-9.5%
Cash-on-Cash Return
3.5%
Cap rate
0.6%
Rent to Value Ratio
Active
$1,040,000
4
bds
|
5
ba
|
3,182
sqft
|
built
2021
4013 Turning Leaf Dr, Nolanville, TX 76559
$-4,384
Cash flow
-22.0%
Cash-on-Cash Return
0.6%
Cap rate
0.2%
Rent to Value Ratio
Active
$319,900
3
bds
|
2
ba
|
1,781
sqft
|
built
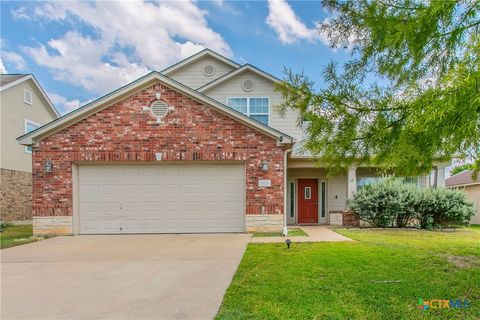
2019
3316 Braford Dr, Belton, TX 76513
$-658
Cash flow
-10.7%
Cash-on-Cash Return
3.2%
Cap rate
0.6%
Rent to Value Ratio
Active
$302,500
4
bds
|
2
ba
|
1,671
sqft
|
built
2023
2089 Mercer St, Nolanville, TX 76559
$-378
Cash flow
-6.5%
Cash-on-Cash Return
4.2%
Cap rate
0.7%
Rent to Value Ratio
Active
$260,000
4
bds
|
3
ba
|
1,659
sqft
|
built
2022
3504 Oglala Trl, Temple, TX 76502
$-389
Cash flow
-7.8%
Cash-on-Cash Return
3.9%
Cap rate
0.8%
Rent to Value Ratio
Active
$899,000
5
bds
|
4
ba
|
3,430
sqft
|
built
2022
12018 Callie Christina Ct, Salado, TX 76571
$-1,218
Cash flow
-7.1%
Cash-on-Cash Return
4.1%
Cap rate
0.5%
Rent to Value Ratio
Active
$251,000
3
bds
|
2
ba
|
1,300
sqft
|
built
2019
2513 Petersburg Ln, Temple, TX 76504
$-459
Cash flow
-9.5%
Cash-on-Cash Return
3.5%
Cap rate
0.7%
Rent to Value Ratio
Active
$250,000
3
bds
|
2
ba
|
1,206
sqft
|
built
1997
477 Bremser Dr, Killeen, TX 76542
$-372
Cash flow
-7.8%
Cash-on-Cash Return
3.9%
Cap rate
0.6%
Rent to Value Ratio
Active
$280,000
3
bds
|
2
ba
|
1,605
sqft
|
built
2018
5325 Cicero Dr, Belton, TX 76513
$-54
Cash flow
-1.0%
Cash-on-Cash Return
5.4%
Cap rate
0.7%
Rent to Value Ratio
Active
$550,000
4
bds
|
3
ba
|
2,638
sqft
|
built
2002
2113 Red Rock Dr, Belton, TX 76513
$-1,659
Cash flow
-15.7%
Cash-on-Cash Return
2.1%
Cap rate
0.5%
Rent to Value Ratio
Active
$335,000
5
bds
|
3
ba
|
3,168
sqft
|
built
2009
6204 Taree Loop, Killeen, TX 76549
$-605
Cash flow
-9.4%
Cash-on-Cash Return
3.5%
Cap rate
0.7%
Rent to Value Ratio
Active
$535,000
5
bds
|
4
ba
|
3,435
sqft
|
built
2021
8302 Elander Dr, Killeen, TX 76542
$-1,448
Cash flow
-14.1%
Cash-on-Cash Return
2.4%
Cap rate
0.5%
Rent to Value Ratio
Active
$435,000
bds
|
0
ba
|
4,230
sqft
|
built
2005
4000 Doraine Ct, Killeen, TX 76549
$-2,359
Cash flow
-28.3%
Cash-on-Cash Return
-0.8%
Cap rate
0.1%
Rent to Value Ratio

Active
$325,000
4
bds
|
2
ba
|
1,737
sqft
|
built
2022
2120 Blackhawk Loop, Belton, TX 76513
$-481
Cash flow
-7.7%
Cash-on-Cash Return
3.9%
Cap rate
0.7%
Rent to Value Ratio

Active
$397,000
4
bds
|
2
ba
|
1,659
sqft
|
built
1947
4978 Sparta Rd, Belton, TX 76513
$-1,066
Cash flow
-14.0%
Cash-on-Cash Return
2.5%
Cap rate
0.4%
Rent to Value Ratio
Active
$315,000
4
bds
|
3
ba
|
2,632
sqft
|
built
2005
303 Buckskin Trl, Harker Heights, TX 76548
$-600
Cash flow
-9.9%
Cash-on-Cash Return
3.4%
Cap rate
0.6%
Rent to Value Ratio
Active
$174,500
3
bds
|
2
ba
|
1,350
sqft
|
built
2000
1402 Nina Dr, Killeen, TX 76549
$-116
Cash flow
-3.5%
Cash-on-Cash Return
4.9%
Cap rate
0.9%
Rent to Value Ratio
Active
$430,000
4
bds
|
2
ba
|
3,131
sqft
|
built
1973
3105 Hemlock Blvd, Temple, TX 76502
$-1,393
Cash flow
-16.9%
Cash-on-Cash Return
1.8%
Cap rate
0.6%
Rent to Value Ratio
Active
$299,000
4
bds
|
3
ba
|
2,229
sqft
|
built
2005
7810 Redbrush, Temple, TX 76502
$-502
Cash flow
-8.8%
Cash-on-Cash Return
3.7%
Cap rate
0.7%
Rent to Value Ratio
Active
$185,000
3
bds
|
2
ba
|
1,965
sqft
|
built
1963
1214 Chippendale Dr, Killeen, TX 76549
$-29
Cash flow
-0.8%
Cash-on-Cash Return
5.5%
Cap rate
0.9%
Rent to Value Ratio
Active
$195,000
3
bds
|
2
ba
|
1,197
sqft
|
built
1993
2305 Timberline Dr, Killeen, TX 76543
$-266
Cash flow
-7.1%
Cash-on-Cash Return
4.0%
Cap rate
0.7%
Rent to Value Ratio
Active
$179,000
3
bds
|
2
ba
|
1,125
sqft
|
built
1965
1405 Camilla Rd, Killeen, TX 76549
$-113
Cash flow
-3.3%
Cash-on-Cash Return
4.9%
Cap rate
0.7%
Rent to Value Ratio