Fort Bend County Investment Properties for Sale
Browse homes for sale and investment properties in Fort Bend County. Refine your search by price, property type, or more.
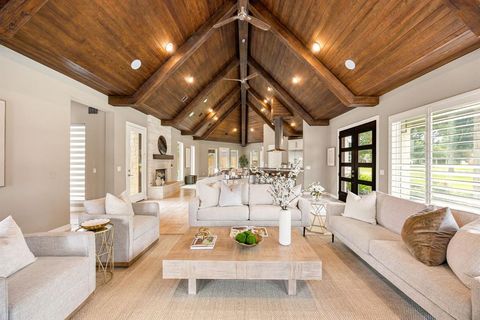
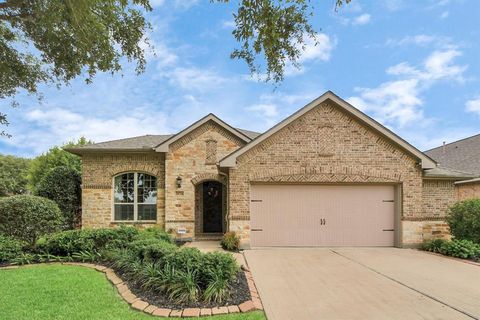
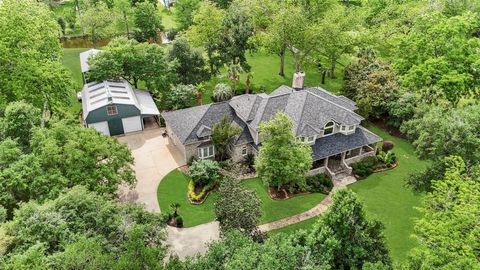
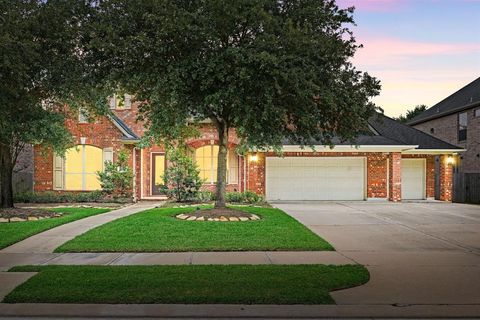
Best cash flowing properties in Fort Bend County
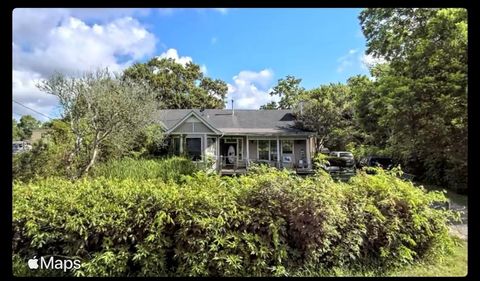
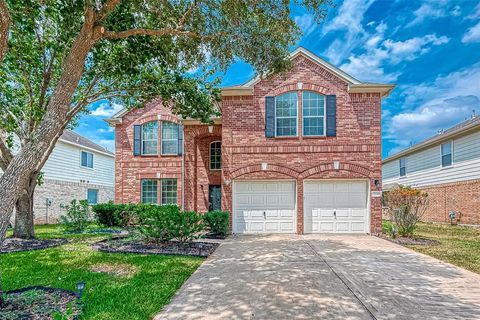
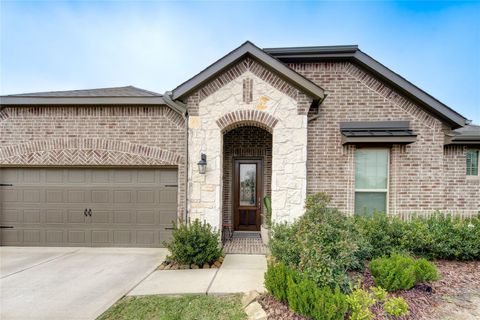
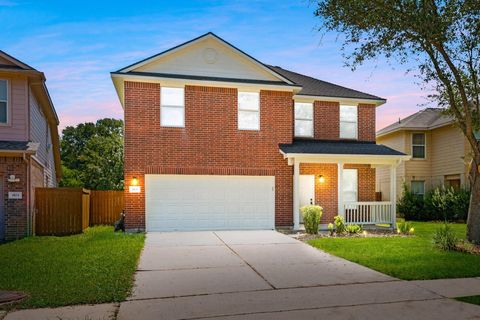
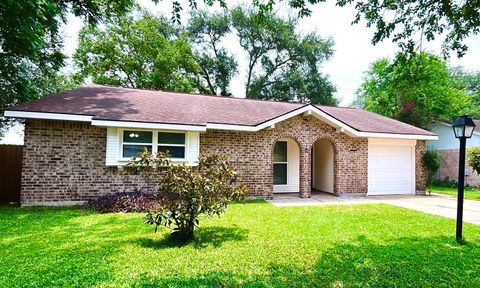
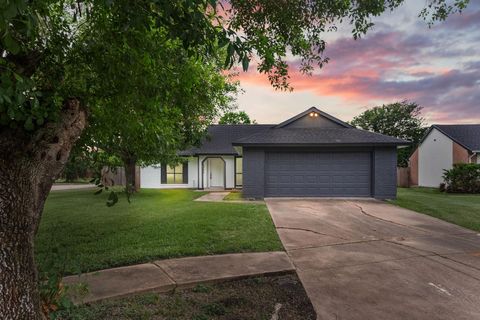
Active
$160,000
3
bds
|
2
ba
|
1,488
sqft
|
built
1986
827 Coen Rd, Rosharon, TX 77583
$144
Cash flow
4.7%
Cash-on-Cash Return
6.8%
Cap rate
1.0%
Rent to Value Ratio
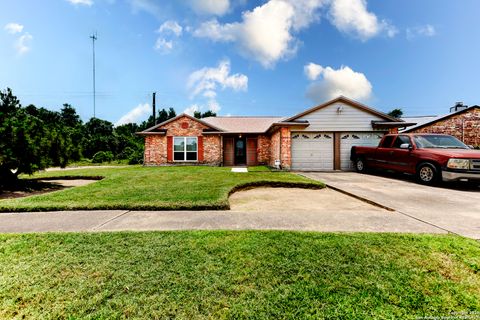
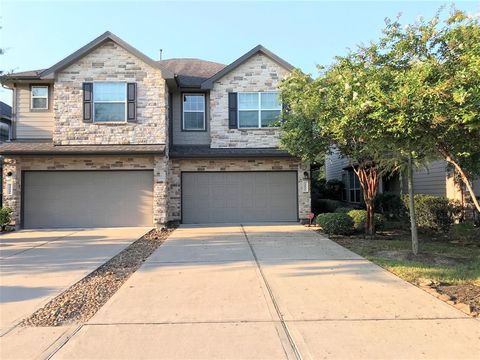
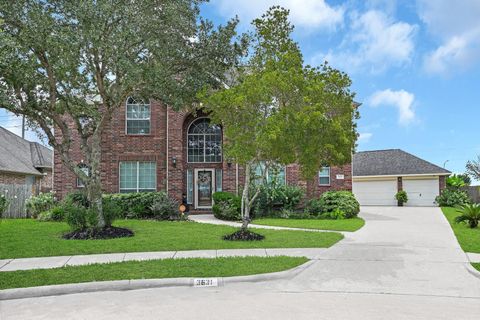
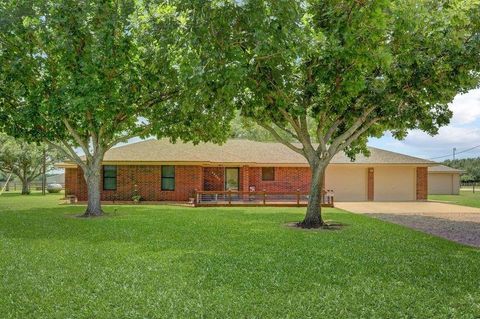
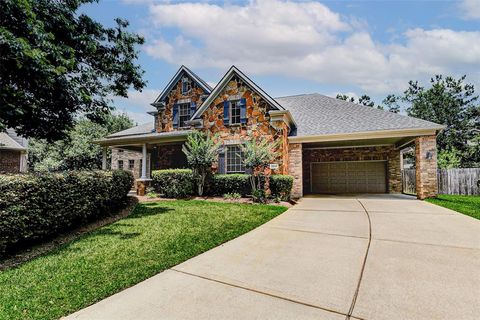
Active
$164,950
3
bds
|
2
ba
|
1,244
sqft
|
built
1972
4911 E Ridge Creek Dr, Houston, TX 77053
$90
Cash flow
2.8%
Cash-on-Cash Return
6.3%
Cap rate
1.0%
Rent to Value Ratio
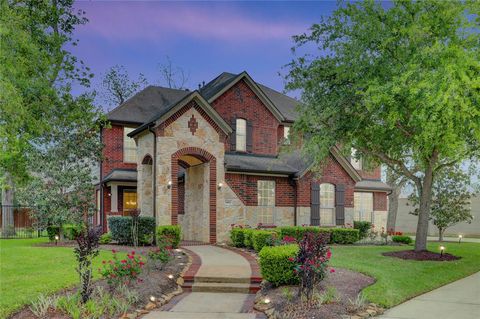
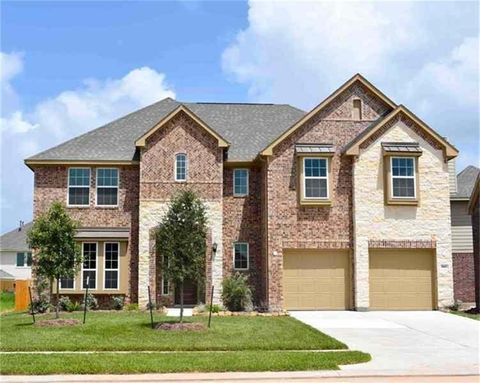
1,355 out of 1,447 properties for sale in Fort Bend County
Limited Results Shown
Create a free account, or log in to reveal all property listings and enjoy the complete experience.
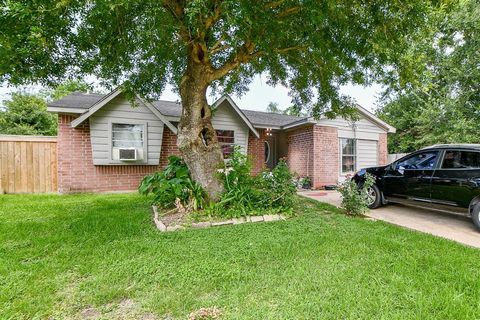
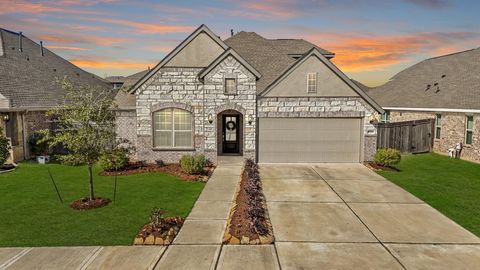
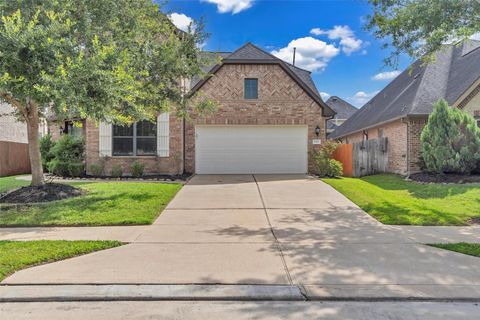
Active
$230,000
3
bds
|
2
ba
|
1,472
sqft
|
built
1982
8403 S Meadow Bird Cir, Missouri City, TX 77489
$-155
Cash flow
-3.5%
Cash-on-Cash Return
4.9%
Cap rate
0.8%
Rent to Value Ratio
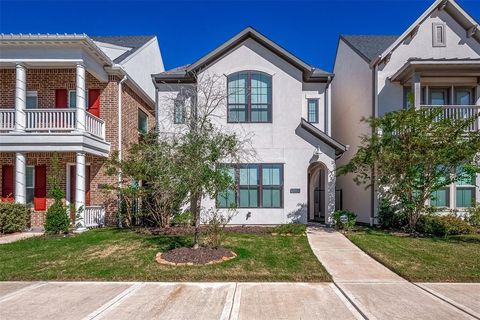
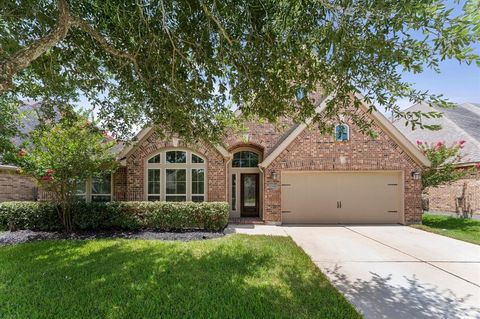
Active
$485,000
4
bds
|
4
ba
|
2,804
sqft
|
built
2017
21323 Crested Valley Dr, Richmond, TX 77407
$-369
Cash flow
-4.0%
Cash-on-Cash Return
4.8%
Cap rate
0.6%
Rent to Value Ratio
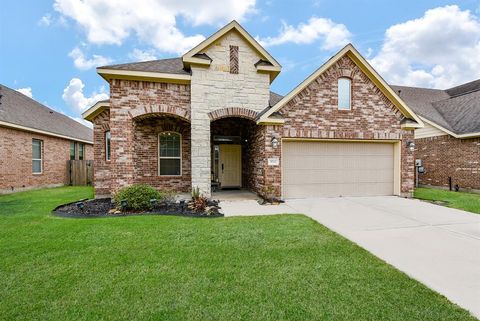
Active
$1,250,000
5
bds
|
6
ba
|
5,268
sqft
|
built
1991
14 Tredington St, Sugar Land, TX 77479
$-4,624
Cash flow
-19.3%
Cash-on-Cash Return
1.2%
Cap rate
0.4%
Rent to Value Ratio

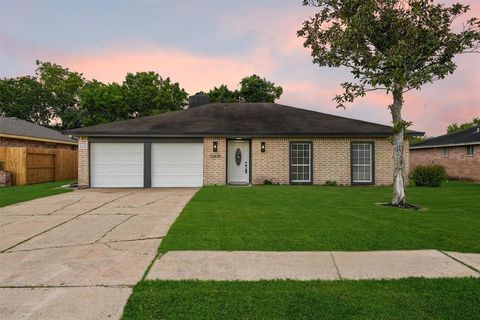
Active
$419,000
4
bds
|
4
ba
|
3,267
sqft
|
built
2012
21902 Juniper Wood Ln, Richmond, TX 77469
$-1,222
Cash flow
-15.2%
Cash-on-Cash Return
2.2%
Cap rate
0.6%
Rent to Value Ratio
Active
$835,000
4
bds
|
4
ba
|
3,634
sqft
|
built
2006
25606 Payton Chase Ct, Katy, TX 77494
$-2,776
Cash flow
-17.3%
Cash-on-Cash Return
1.7%
Cap rate
0.4%
Rent to Value Ratio
Active
$535,000
4
bds
|
4
ba
|
3,319
sqft
|
built
2005
24206 Moon Ridge Ct, Katy, TX 77494
$-1,244
Cash flow
-12.1%
Cash-on-Cash Return
2.9%
Cap rate
0.6%
Rent to Value Ratio
Active
$325,000
3
bds
|
2
ba
|
1,923
sqft
|
built
2018
29907 Tallow Grove Ln, Brookshire, TX 77423
$-728
Cash flow
-11.7%
Cash-on-Cash Return
3.0%
Cap rate
0.7%
Rent to Value Ratio
Active
$420,000
4
bds
|
3
ba
|
2,442
sqft
|
built
2005
2218 Falcon Knoll Ln, Katy, TX 77494
$-248
Cash flow
-3.1%
Cash-on-Cash Return
5.0%
Cap rate
0.6%
Rent to Value Ratio
Active
$695,000
4
bds
|
5
ba
|
4,122
sqft
|
built
2016
2418 Sandhill Crest Ln, Brookshire, TX 77423
$-1,585
Cash flow
-11.9%
Cash-on-Cash Return
2.9%
Cap rate
0.7%
Rent to Value Ratio
Active
$774,000
4
bds
|
4
ba
|
4,676
sqft
|
built
2017
27419 Overland Gap Ct, Katy, TX 77494
$-2,171
Cash flow
-14.6%
Cash-on-Cash Return
2.3%
Cap rate
0.6%
Rent to Value Ratio
Active
$214,950
4
bds
|
2
ba
|
1,900
sqft
|
built
2006
835 Dracena Ct, Richmond, TX 77406
$-455
Cash flow
-11.0%
Cash-on-Cash Return
3.1%
Cap rate
0.8%
Rent to Value Ratio
Active
$459,990
4
bds
|
4
ba
|
2,663
sqft
|
built
2019
3502 Harper Ferry Pl, Katy, TX 77494
$-1,148
Cash flow
-13.0%
Cash-on-Cash Return
2.7%
Cap rate
0.7%
Rent to Value Ratio
Active
$307,000
3
bds
|
3
ba
|
1,436
sqft
|
built
2011
24642 Folkstone Cir, Katy, TX 77494
$-56
Cash flow
-1.0%
Cash-on-Cash Return
5.5%
Cap rate
0.7%
Rent to Value Ratio
Active
$268,000
4
bds
|
2
ba
|
1,879
sqft
|
built
2021
1135 Della Ln, Rosharon, TX 77583
$-402
Cash flow
-7.8%
Cash-on-Cash Return
3.9%
Cap rate
0.9%
Rent to Value Ratio
Active
$425,000
4
bds
|
3
ba
|
2,779
sqft
|
built
1990
21735 Cayman Point Dr, Katy, TX 77450
$-767
Cash flow
-9.4%
Cash-on-Cash Return
3.5%
Cap rate
0.7%
Rent to Value Ratio
Active
$2,099,000
6
bds
|
6
ba
|
5,445
sqft
|
built
2017
2911 S Saddlebrook Ln, Katy, TX 77494
$-6,919
Cash flow
-17.2%
Cash-on-Cash Return
1.7%
Cap rate
0.4%
Rent to Value Ratio

Active
$345,500
4
bds
|
2
ba
|
2,480
sqft
|
built
2018
28335 Buffalo Fork Ln, Katy, TX 77494
$-740
Cash flow
-11.2%
Cash-on-Cash Return
3.1%
Cap rate
0.8%
Rent to Value Ratio

Active
$458,000
4
bds
|
3
ba
|
2,927
sqft
|
built
2006
7603 Chimney Gap, Missouri City, TX 77459
$-359
Cash flow
-4.1%
Cash-on-Cash Return
4.7%
Cap rate
0.6%
Rent to Value Ratio
Active
$475,000
3
bds
|
2
ba
|
2,479
sqft
|
built
2011
16726 Aliana Lakes Ct, Richmond, TX 77407
$-493
Cash flow
-5.4%
Cash-on-Cash Return
4.4%
Cap rate
0.6%
Rent to Value Ratio
Active
$1,950,000
4
bds
|
4
ba
|
5,800
sqft
|
built
1998
6111 Creekview Dr, Sugar Land, TX 77479
$-5,848
Cash flow
-15.6%
Cash-on-Cash Return
2.1%
Cap rate
0.4%
Rent to Value Ratio
Active
$664,000
3
bds
|
5
ba
|
3,692
sqft
|
built
2007
21510 Briar Landing Ln, Katy, TX 77450
$-1,767
Cash flow
-13.9%
Cash-on-Cash Return
2.5%
Cap rate
0.5%
Rent to Value Ratio
Active
$299,900
3
bds
|
3
ba
|
1,948
sqft
|
built
2005
4835 Montclair Hill Ln, Fresno, TX 77545
$-520
Cash flow
-9.0%
Cash-on-Cash Return
3.6%
Cap rate
0.7%
Rent to Value Ratio

Active
$1,599,800
4
bds
|
5
ba
|
4,350
sqft
|
built
2012
1103 Vista Creek Dr, Sugar Land, TX 77478
$-6,522
Cash flow
-21.3%
Cash-on-Cash Return
0.8%
Cap rate
0.3%
Rent to Value Ratio
Active
$575,000
4
bds
|
4
ba
|
3,528
sqft
|
built
2003
3631 Shady Bay Ln, Missouri City, TX 77459
$-1,527
Cash flow
-13.9%
Cash-on-Cash Return
2.5%
Cap rate
0.6%
Rent to Value Ratio
Active
$535,000
4
bds
|
3
ba
|
3,320
sqft
|
built
2004
21114 Falcon Creek Ct, Richmond, TX 77406
$-1,277
Cash flow
-12.5%
Cash-on-Cash Return
2.8%
Cap rate
0.6%
Rent to Value Ratio
Active
$329,900
4
bds
|
3
ba
|
2,458
sqft
|
built
2006
7407 Jacobs Well Dr, Richmond, TX 77407
$-705
Cash flow
-11.1%
Cash-on-Cash Return
3.1%
Cap rate
0.7%
Rent to Value Ratio
Active
$265,000
3
bds
|
2
ba
|
1,414
sqft
|
built
1970
13419 Greenway Dr, Sugar Land, TX 77498
$-381
Cash flow
-7.5%
Cash-on-Cash Return
4.0%
Cap rate
0.7%
Rent to Value Ratio
Active
$489,000
3
bds
|
2
ba
|
1,924
sqft
|
built
1992
13302 Kettler Rd, Needville, TX 77461
$-1,416
Cash flow
-15.1%
Cash-on-Cash Return
2.2%
Cap rate
0.4%
Rent to Value Ratio
Active
$409,900
4
bds
|
4
ba
|
2,413
sqft
|
built
2021
8711 Fairbrook Dr, Missouri City, TX 77459
$-917
Cash flow
-11.7%
Cash-on-Cash Return
3.0%
Cap rate
0.8%
Rent to Value Ratio
Active
$475,000
3
bds
|
4
ba
|
2,549
sqft
|
built
2021
5038 Galahad Ct, Missouri City, TX 77459
$-879
Cash flow
-9.7%
Cash-on-Cash Return
3.5%
Cap rate
0.7%
Rent to Value Ratio
Active
$549,000
4
bds
|
3
ba
|
3,304
sqft
|
built
2014
4511 Hickory Branch Ln, Sugar Land, TX 77479
$-1,235
Cash flow
-11.7%
Cash-on-Cash Return
3.0%
Cap rate
0.6%
Rent to Value Ratio
Active
$395,699
4
bds
|
3
ba
|
2,513
sqft
|
built
2014
6222 Milam Branch Ln, Rosenberg, TX 77471
$-935
Cash flow
-12.3%
Cash-on-Cash Return
2.8%
Cap rate
0.6%
Rent to Value Ratio
Active
$345,000
3
bds
|
2
ba
|
1,826
sqft
|
built
2013
9311 Gilbert Hollow Dr, Rosenberg, TX 77469
$-563
Cash flow
-8.5%
Cash-on-Cash Return
3.7%
Cap rate
0.7%
Rent to Value Ratio
Active
$268,000
4
bds
|
2
ba
|
1,428
sqft
|
built
1971
15439 Indian Woods Dr, Missouri City, TX 77489
$-284
Cash flow
-5.5%
Cash-on-Cash Return
4.4%
Cap rate
0.7%
Rent to Value Ratio
Active
$234,900
3
bds
|
2
ba
|
1,452
sqft
|
built
1981
16234 Bowridge Ln, Houston, TX 77053
$-219
Cash flow
-4.9%
Cash-on-Cash Return
4.6%
Cap rate
0.8%
Rent to Value Ratio
Active
$745,000
5
bds
|
5
ba
|
4,547
sqft
|
built
2001
22110 Stone Cross Ct, Katy, TX 77450
$-2,080
Cash flow
-14.6%
Cash-on-Cash Return
2.3%
Cap rate
0.5%
Rent to Value Ratio
Active
$639,999
4
bds
|
4
ba
|
4,075
sqft
|
built
2013
5402 Bending Branch Dr, Missouri City, TX 77459
$-2,136
Cash flow
-17.4%
Cash-on-Cash Return
1.7%
Cap rate
0.6%
Rent to Value Ratio
Active
$520,000
5
bds
|
5
ba
|
4,178
sqft
|
built
2017
811 River Delta Ln, Rosenberg, TX 77469
$-1,225
Cash flow
-12.3%
Cash-on-Cash Return
2.9%
Cap rate
0.7%
Rent to Value Ratio