Brazoria County Investment Properties for Sale
Browse homes for sale and investment properties in Brazoria County. Refine your search by price, property type, or more.
Best cash flowing properties in Brazoria County
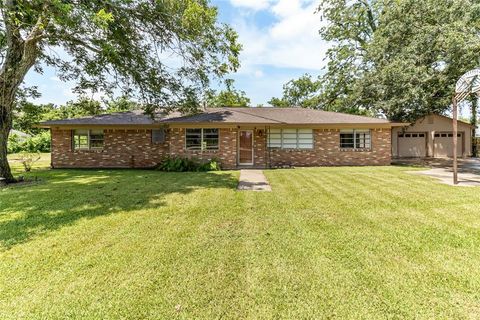
Active
$218,000
3
bds
|
2
ba
|
1,560
sqft
|
built
1979
6377 County Road 659, Brazoria, TX 77422
$348
Cash flow
8.3%
Cash-on-Cash Return
7.6%
Cap rate
0.9%
Rent to Value Ratio
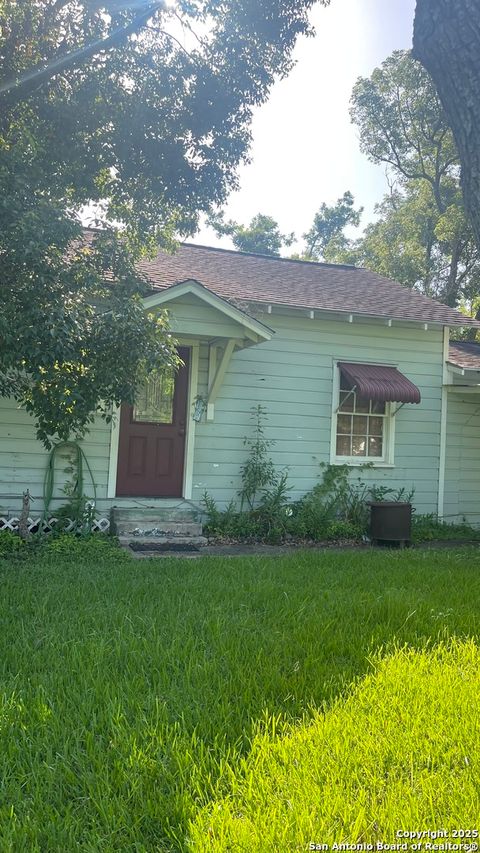
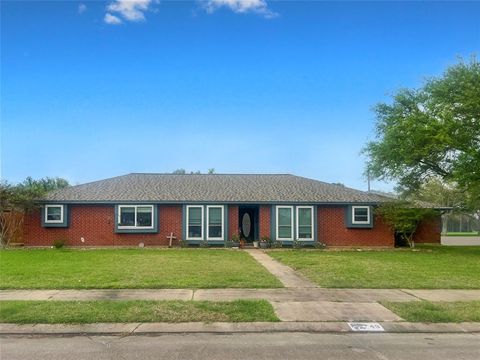
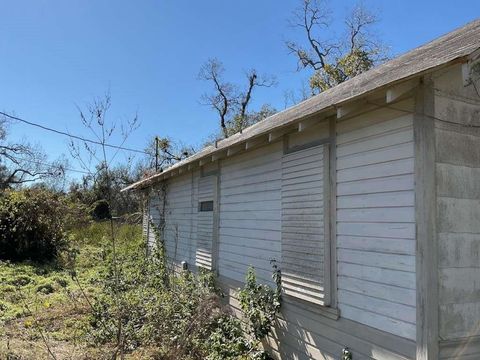
Active
$120,000
3
bds
|
1
ba
|
1,056
sqft
|
built
1945
332 S Arcola St, Angleton, TX 77515
$267
Cash flow
11.6%
Cash-on-Cash Return
8.4%
Cap rate
1.3%
Rent to Value Ratio
781 out of 953 properties for sale in Brazoria County
Limited Results Shown
Create a free account, or log in to reveal all property listings and enjoy the complete experience.
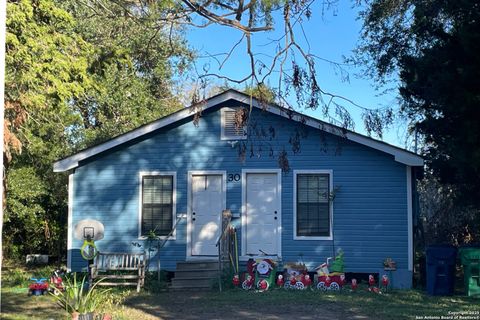
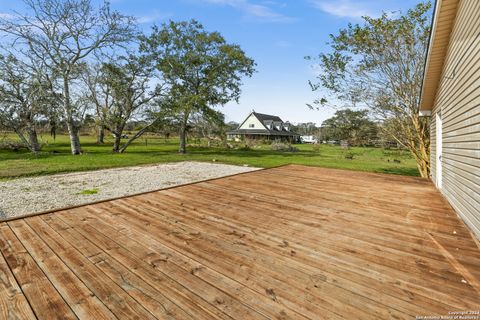
Active
$130,000
2
bds
|
2
ba
|
1,022
sqft
|
built
1950
30 Cypress Ct, Richwood, TX 77531
$128
Cash flow
5.1%
Cash-on-Cash Return
6.9%
Cap rate
1.0%
Rent to Value Ratio
Active
$126,000
2
bds
|
1
ba
|
736
sqft
|
built
1950
10 Cypress Ct, Richwood, TX 77531
$216
Cash flow
8.9%
Cash-on-Cash Return
7.7%
Cap rate
1.1%
Rent to Value Ratio
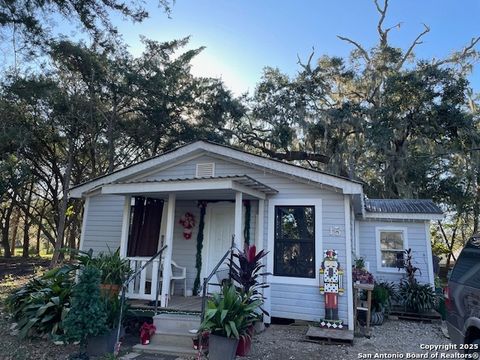
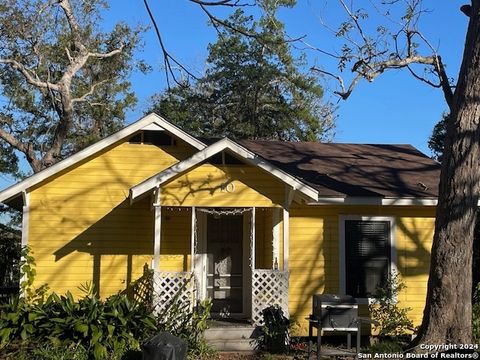
Active
$127,000
3
bds
|
1
ba
|
964
sqft
|
built
1950
15 Cypress Ct, Richwood, TX 77531
$74
Cash flow
3.0%
Cash-on-Cash Return
6.4%
Cap rate
0.9%
Rent to Value Ratio
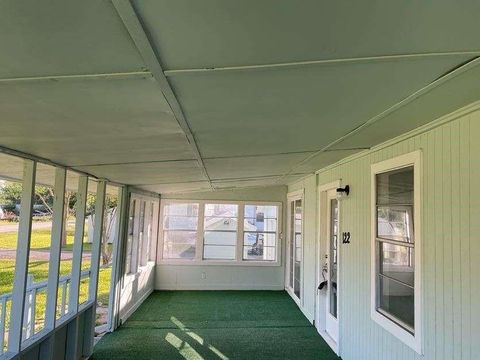
Active
$139,999
2
bds
|
1
ba
|
816
sqft
|
built
1982
122 S Circle Dr, Liverpool, TX 77577
$36
Cash flow
1.3%
Cash-on-Cash Return
6.0%
Cap rate
0.9%
Rent to Value Ratio
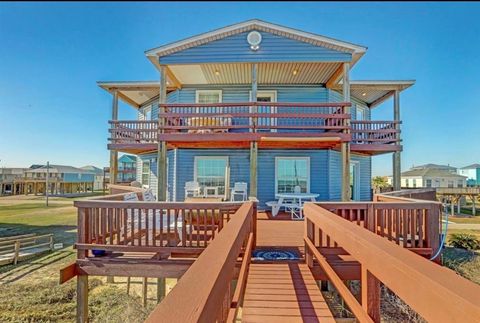
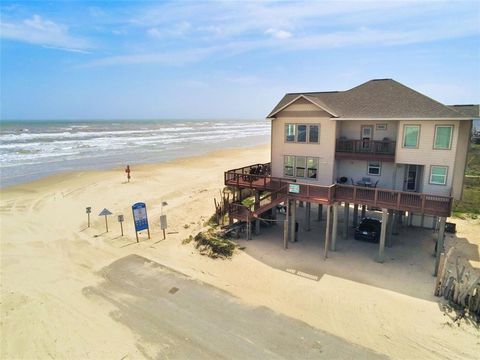
Active
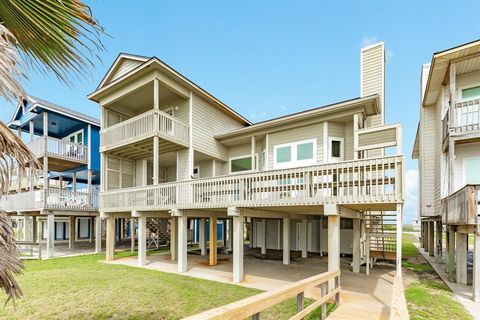
$699,000
4
bds
|
4
ba
|
1,720
sqft
|
built
2007
601 Wave Ct, Surfside Beach, TX 77541
$-1,435
Cash flow
-10.7%
Cash-on-Cash Return
3.2%
Cap rate
0.6%
Rent to Value Ratio
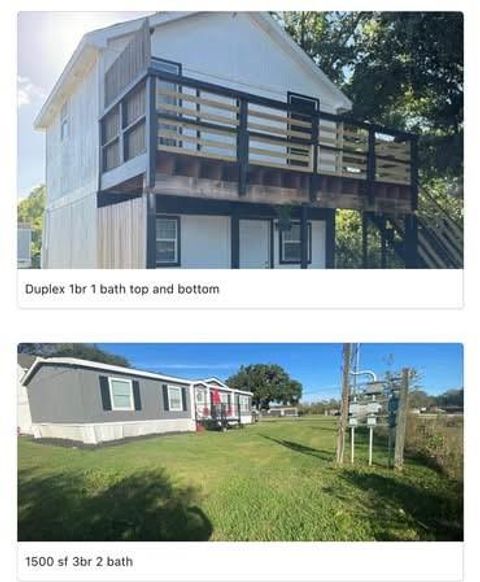
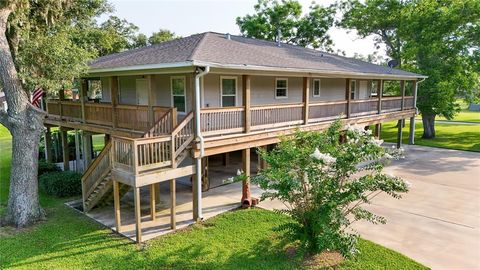
Active
$300,000
bds
|
0
ba
|
1,456
sqft
|
built
2010
861 County Road 947, Alvin, TX 77511
$38
Cash flow
0.7%
Cash-on-Cash Return
5.8%
Cap rate
0.8%
Rent to Value Ratio
Active
$1,290,000
4
bds
|
4
ba
|
2,755
sqft
|
built
2005
2330 Blue Water Hwy, Surfside Beach, TX 77541
$-4,980
Cash flow
-20.1%
Cash-on-Cash Return
1.0%
Cap rate
0.3%
Rent to Value Ratio

Active
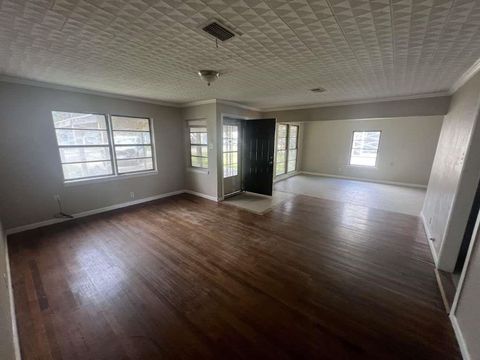
$250,000
3
bds
|
1
ba
|
2,028
sqft
|
built
1955
1518 S Columbia Dr, West Columbia, TX 77486
$-407
Cash flow
-8.5%
Cash-on-Cash Return
3.7%
Cap rate
0.7%
Rent to Value Ratio
Active
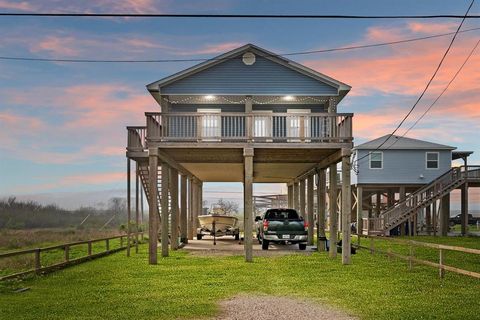
$370,000
2
bds
|
3
ba
|
1,540
sqft
|
built
2018
915 Live Oak Dr, Jones Creek, TX 77541
$-708
Cash flow
-10.0%
Cash-on-Cash Return
3.4%
Cap rate
0.6%
Rent to Value Ratio
Active
$169,749
3
bds
|
1
ba
|
1,260
sqft
|
built
1951
401 Farrer St, Angleton, TX 77515
$48
Cash flow
1.5%
Cash-on-Cash Return
6.0%
Cap rate
0.9%
Rent to Value Ratio
Active
$410,000
3
bds
|
2
ba
|
1,104
sqft
|
built
2021
1310 Monument Dr, Surfside Beach, TX 77541
$-1,038
Cash flow
-13.2%
Cash-on-Cash Return
2.6%
Cap rate
0.5%
Rent to Value Ratio
Active
$364,900
4
bds
|
3
ba
|
2,474
sqft
|
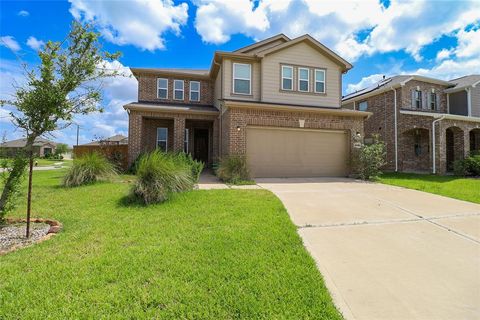
built
2004
3026 Ripple Bend Ct, Pearland, TX 77581
$-753
Cash flow
-10.8%
Cash-on-Cash Return
3.2%
Cap rate
0.7%
Rent to Value Ratio

Active
$170,000
3
bds
|
2
ba
|
1,201
sqft
|
built
1956
1510 W 11th St, Freeport, TX 77541
$-125
Cash flow
-3.8%
Cash-on-Cash Return
4.8%
Cap rate
0.8%
Rent to Value Ratio
Active
$395,900
3
bds
|
2
ba
|
1,152
sqft
|
built
2012
818 Surf Dr, Surfside Beach, TX 77541
$-957
Cash flow
-12.6%
Cash-on-Cash Return
2.8%
Cap rate
0.5%
Rent to Value Ratio
Active
$273,000
3
bds
|
3
ba
|
1,843
sqft
|
built
2023
4050 Champlain Way, Iowa Colony, TX 77583
$-372
Cash flow
-7.1%
Cash-on-Cash Return
4.0%
Cap rate
1.0%
Rent to Value Ratio
Active
$143,559
2
bds
|
1
ba
|
1,040
sqft
|
built
1940
1311 W 6th St, Freeport, TX 77541
$52
Cash flow
1.9%
Cash-on-Cash Return
6.1%
Cap rate
1.0%
Rent to Value Ratio
Active
$380,000
4
bds
|
3
ba
|
2,691
sqft
|
built
1999
6505 River Glen Ct, Pearland, TX 77584
$-664
Cash flow
-9.1%
Cash-on-Cash Return
3.6%
Cap rate
0.7%
Rent to Value Ratio
Active
$239,000
4
bds
|
2
ba
|
2,352
sqft
|
built
1961
2417 County Road 349, Brazoria, TX 77422
$171
Cash flow
3.7%
Cash-on-Cash Return
6.5%
Cap rate
1.0%
Rent to Value Ratio
Active
$325,000
3
bds
|
3
ba
|
2,203
sqft
|
built
1985
49 Colony Sq, Angleton, TX 77515
$-214
Cash flow
-3.4%
Cash-on-Cash Return
4.9%
Cap rate
0.9%
Rent to Value Ratio
Active
$399,888
3
bds
|
2
ba
|
2,056
sqft
|
built
2014
34 Rodeo Dr, Manvel, TX 77578
$-1,082
Cash flow
-14.1%
Cash-on-Cash Return
2.4%
Cap rate
0.6%
Rent to Value Ratio
Active
$265,000
3
bds
|
2
ba
|
1,526
sqft
|
built
1982
2803 N Brompton Dr, Pearland, TX 77584
$-408
Cash flow
-8.0%
Cash-on-Cash Return
3.8%
Cap rate
0.8%
Rent to Value Ratio
Active
$550,000
4
bds
|
3
ba
|
3,330
sqft
|
built
2001
515 Silver Leaf Ct, Pearland, TX 77584
$-1,627
Cash flow
-15.4%
Cash-on-Cash Return
2.1%
Cap rate
0.5%
Rent to Value Ratio
Active
$315,000
3
bds
|
2
ba
|
1,910
sqft
|
built
2008
4602 Pompton Ct, Pearland, TX 77584
$-599
Cash flow
-9.9%
Cash-on-Cash Return
3.4%
Cap rate
0.8%
Rent to Value Ratio
Active
$199,000
2
bds
|
2
ba
|
1,029
sqft
|
built
2021
135 Ellis Ln, West Columbia, TX 77486
$-27
Cash flow
-0.7%
Cash-on-Cash Return
5.5%
Cap rate
0.9%
Rent to Value Ratio
Active
$366,000
3
bds
|
2
ba
|
1,808
sqft
|
built
1994
3530 Wellington Dr, Pearland, TX 77584
$-719
Cash flow
-10.2%
Cash-on-Cash Return
3.3%
Cap rate
0.6%
Rent to Value Ratio
Active
$559,000
4
bds
|
4
ba
|
1,995
sqft
|
built
2005
206 Sand Dune Ct, Surfside Beach, TX 77541
$-1,366
Cash flow
-12.7%
Cash-on-Cash Return
2.7%
Cap rate
0.6%
Rent to Value Ratio
Active
$469,995
5
bds
|
4
ba
|
3,230
sqft
|
built
2000
5109 Playa Dr, Pearland, TX 77584
$-839
Cash flow
-9.3%
Cash-on-Cash Return
3.5%
Cap rate
0.7%
Rent to Value Ratio
Active
$410,000
4
bds
|
3
ba
|
2,653
sqft
|
built
2017
4320 Mesquite Terrace Dr, Manvel, TX 77578
$-1,166
Cash flow
-14.8%
Cash-on-Cash Return
2.3%
Cap rate
0.7%
Rent to Value Ratio
Active
$899,999
4
bds
|
5
ba
|
2,407
sqft
|
built
2016
107 Yucca Ave, Surfside Beach, TX 77541
$-2,575
Cash flow
-14.9%
Cash-on-Cash Return
2.2%
Cap rate
0.5%
Rent to Value Ratio
Active
$399,900
3
bds
|
2
ba
|
1,269
sqft
|
built
2015
2709 Swan Ct, Surfside Beach, TX 77541
$-1,290
Cash flow
-16.8%
Cash-on-Cash Return
1.8%
Cap rate
0.5%
Rent to Value Ratio

Active
$250,000
3
bds
|
2
ba
|
1,190
sqft
|
built
1976
5216-4 County Road 469, Brazoria, TX 77422
$-267
Cash flow
-5.6%
Cash-on-Cash Return
4.4%
Cap rate
0.6%
Rent to Value Ratio
Active
$360,000
4
bds
|
3
ba
|
2,596
sqft
|
built
2021
1418 Red Hills Dr, Iowa Colony, TX 77583
$-633
Cash flow
-9.2%
Cash-on-Cash Return
3.6%
Cap rate
0.9%
Rent to Value Ratio
Active
$299,999
3
bds
|
3
ba
|
2,086
sqft
|
built
1995
3718 Brighton Ln, Pearland, TX 77584
$-455
Cash flow
-7.9%
Cash-on-Cash Return
3.9%
Cap rate
0.8%
Rent to Value Ratio
Active
$422,000
4
bds
|
4
ba
|
2,768
sqft
|
built
2020
1834 Alyssa Way, Alvin, TX 77511
$-1,004
Cash flow
-12.4%
Cash-on-Cash Return
2.8%
Cap rate
0.6%
Rent to Value Ratio
Active
$198,249
2
bds
|
1
ba
|
1,278
sqft
|
built
1936
7103 Highway 36, Jones Creek, TX 77541
$-192
Cash flow
-5.1%
Cash-on-Cash Return
4.5%
Cap rate
0.7%
Rent to Value Ratio
Active
$285,000
5
bds
|
3
ba
|
1,733
sqft
|
built
2005
5519 Rio Sabinas St, Rosharon, TX 77583
$-392
Cash flow
-7.2%
Cash-on-Cash Return
4.0%
Cap rate
0.7%
Rent to Value Ratio
Active
$295,000
4
bds
|
2
ba
|
2,120
sqft
|
built
2015
4519 Apple Point Ln, Rosharon, TX 77583
$-484
Cash flow
-8.6%
Cash-on-Cash Return
3.7%
Cap rate
0.8%
Rent to Value Ratio
Active
$379,990
4
bds
|
3
ba
|
2,533
sqft
|
built
2017
9803 Faulkner Trl, Iowa Colony, TX 77583
$-970
Cash flow
-13.3%
Cash-on-Cash Return
2.6%
Cap rate
0.8%
Rent to Value Ratio