Brazoria County Investment Properties for Sale
Browse homes for sale and investment properties in Brazoria County. Refine your search by price, property type, or more.
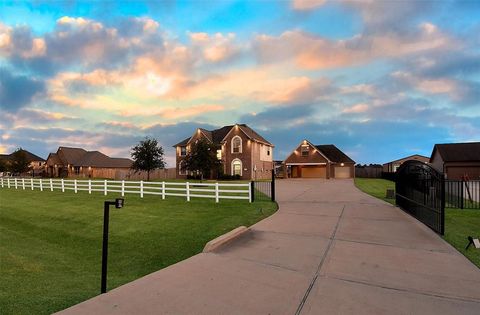
Best cash flowing properties in Brazoria County
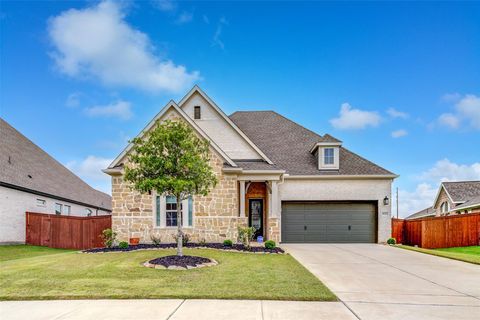
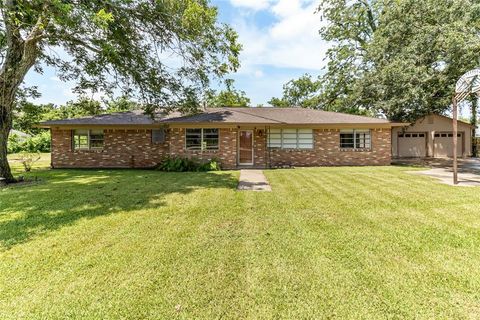
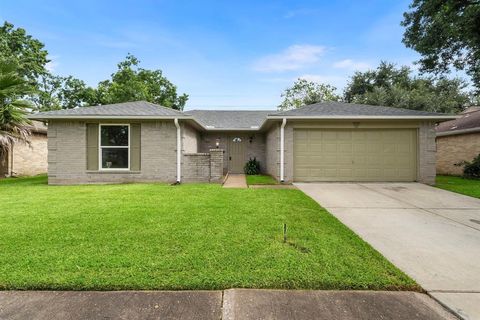
Active
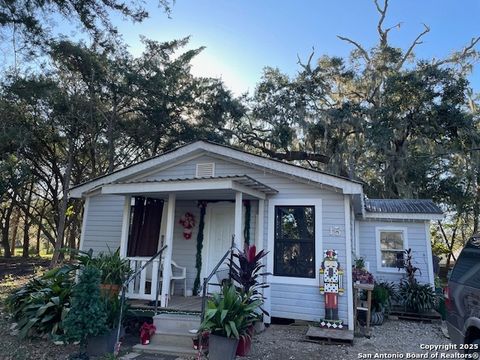
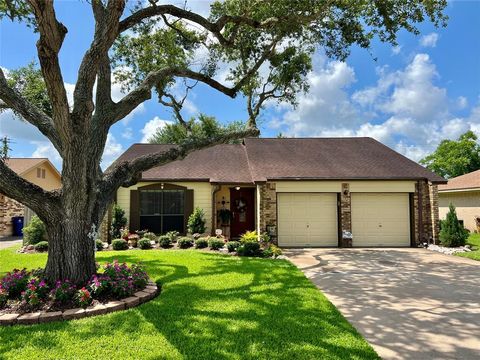
$218,000
3
bds
|
2
ba
|
1,560
sqft
|
built
1979
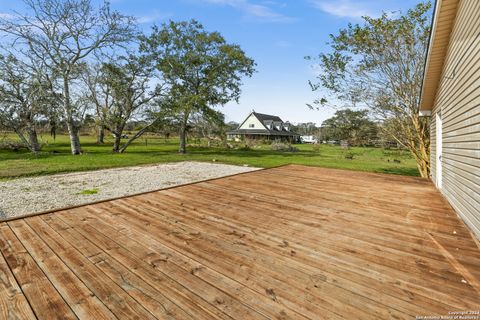
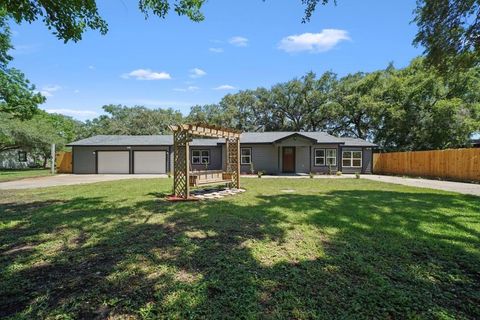
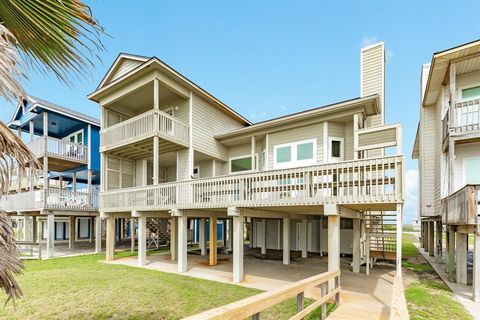
6377 County Road 659, Brazoria, TX 77422
$348
Cash flow
8.3%
Cash-on-Cash Return
7.6%
Cap rate
0.9%
Rent to Value Ratio

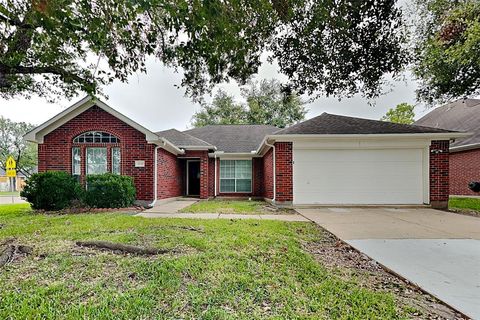
Active
$98,000
3
bds
|
1
ba
|
1,080
sqft
|
built
1950
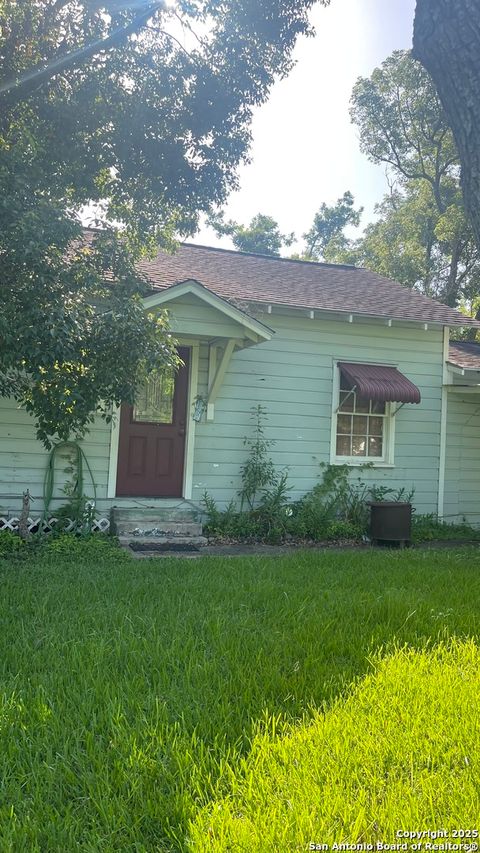
105 N Avenue D, Freeport, TX 77541
$345
Cash flow
18.4%
Cash-on-Cash Return
9.9%
Cap rate
1.4%
Rent to Value Ratio
816 out of 993 properties for sale in Brazoria County
Limited Results Shown
Create a free account, or log in to reveal all property listings and enjoy the complete experience.
Active
$120,000
3
bds
|
1
ba
|
1,056
sqft
|
built
1945
332 S Arcola St, Angleton, TX 77515
$267
Cash flow
11.6%
Cash-on-Cash Return
8.4%
Cap rate
1.3%
Rent to Value Ratio
Active
$130,000
2
bds
|
2
ba
|
1,022
sqft
|
built
1950
30 Cypress Ct, Richwood, TX 77531
$128
Cash flow
5.1%
Cash-on-Cash Return
6.9%
Cap rate
1.0%
Rent to Value Ratio
Active
$126,000
2
bds
|
1
ba
|
736
sqft
|
built
1950
10 Cypress Ct, Richwood, TX 77531
$216
Cash flow
8.9%
Cash-on-Cash Return
7.7%
Cap rate
1.1%
Rent to Value Ratio
Active
$127,000
3
bds
|
1
ba
|
964
sqft
|
built
1950
15 Cypress Ct, Richwood, TX 77531
$74
Cash flow
3.0%
Cash-on-Cash Return
6.4%
Cap rate
0.9%
Rent to Value Ratio

Active
$599,999
4
bds
|
4
ba
|
3,342
sqft
|
built
2022
9527 Sanger Way, Rosharon, TX 77583
$-1,526
Cash flow
-13.3%
Cash-on-Cash Return
2.6%
Cap rate
0.7%
Rent to Value Ratio
Active
$1,020,000
4
bds
|
5
ba
|
5,325
sqft
|
built
2022
4903 Grapevine Ln, Manvel, TX 77578
$44
Cash flow
0.2%
Cash-on-Cash Return
5.7%
Cap rate
0.7%
Rent to Value Ratio
Active
$750,000
5
bds
|
5
ba
|
3,705
sqft
|
built
2022
543 Buffalo Trl, Angleton, TX 77515
$-1,642
Cash flow
-11.4%
Cash-on-Cash Return
3.1%
Cap rate
0.5%
Rent to Value Ratio
Active
$399,000
4
bds
|
3
ba
|
2,556
sqft
|
built
2022
553 Green Meadows Dr, West Columbia, TX 77486
$-695
Cash flow
-9.1%
Cash-on-Cash Return
3.6%
Cap rate
0.7%
Rent to Value Ratio
Active
$369,000
4
bds
|
3
ba
|
2,543
sqft
|
built
1945
848 Nursery Rd, Clute, TX 77531
$-849
Cash flow
-12.0%
Cash-on-Cash Return
2.9%
Cap rate
0.4%
Rent to Value Ratio
Active
$725,000
4
bds
|
4
ba
|
4,138
sqft
|
built
2004
3602 Lindhaven Dr, Pearland, TX 77584
$-2,150
Cash flow
-15.5%
Cash-on-Cash Return
2.1%
Cap rate
0.5%
Rent to Value Ratio
Active
$374,900
2
bds
|
1
ba
|
1,064
sqft
|
built
1990
4619 Blue Water Hwy, Freeport, TX 77541
$-914
Cash flow
-12.7%
Cash-on-Cash Return
2.8%
Cap rate
0.5%
Rent to Value Ratio
Active
$335,000
4
bds
|
3
ba
|
2,331
sqft
|
built
1994
3502 Sheldon Dr, Pearland, TX 77584
$-528
Cash flow
-8.2%
Cash-on-Cash Return
3.8%
Cap rate
0.7%
Rent to Value Ratio
Active
$259,500
3
bds
|
2
ba
|
1,458
sqft
|
built
1981
728 S Remington Dr, Angleton, TX 77515
$-350
Cash flow
-7.0%
Cash-on-Cash Return
4.1%
Cap rate
0.7%
Rent to Value Ratio
Active
$139,999
2
bds
|
1
ba
|
816
sqft
|
built
1982
122 S Circle Dr, Liverpool, TX 77577
$36
Cash flow
1.3%
Cash-on-Cash Return
6.0%
Cap rate
0.9%
Rent to Value Ratio
Active
$699,000
4
bds
|
4
ba
|
1,720
sqft
|
built
2007
601 Wave Ct, Surfside Beach, TX 77541
$-1,435
Cash flow
-10.7%
Cash-on-Cash Return
3.2%
Cap rate
0.6%
Rent to Value Ratio
Active
$300,000
bds
|
0
ba
|
1,456
sqft
|
built
2010
861 County Road 947, Alvin, TX 77511
$38
Cash flow
0.7%
Cash-on-Cash Return
5.8%
Cap rate
0.8%
Rent to Value Ratio
Active
$1,290,000
4
bds
|
4
ba
|
2,755
sqft
|
built
2005
2330 Blue Water Hwy, Surfside Beach, TX 77541
$-4,980
Cash flow
-20.1%
Cash-on-Cash Return
1.0%
Cap rate
0.3%
Rent to Value Ratio
Active
$615,000
4
bds
|
5
ba
|
2,841
sqft
|
built
2019
227 Mayad Blvd, Rosharon, TX 77583
$-1,124
Cash flow
-9.5%
Cash-on-Cash Return
3.5%
Cap rate
0.6%
Rent to Value Ratio
Active
$774,900
5
bds
|
4
ba
|
3,366
sqft
|
built
1962
4615 W Walnut St, Pearland, TX 77581
$-1,673
Cash flow
-11.3%
Cash-on-Cash Return
3.1%
Cap rate
0.5%
Rent to Value Ratio
Active
$260,000
3
bds
|
2
ba
|
1,592
sqft
|
built
1973
1106 Glenda St, Pearland, TX 77581
$-306
Cash flow
-6.1%
Cash-on-Cash Return
4.3%
Cap rate
0.7%
Rent to Value Ratio

Active
$375,000
4
bds
|
3
ba
|
2,352
sqft
|
built
2022
10603 Scrub Oak Dr, Rosharon, TX 77583
$-741
Cash flow
-10.3%
Cash-on-Cash Return
3.3%
Cap rate
0.8%
Rent to Value Ratio
Active
$515,000
4
bds
|
4
ba
|
2,850
sqft
|
built
2022
9823 Starry Night Ln, Manvel, TX 77578
$-1,510
Cash flow
-15.3%
Cash-on-Cash Return
2.2%
Cap rate
0.7%
Rent to Value Ratio
Active
$520,000
3
bds
|
4
ba
|
2,968
sqft
|
built
2014
4810 County Road 63, Rosharon, TX 77583
$-1,070
Cash flow
-10.7%
Cash-on-Cash Return
3.2%
Cap rate
0.7%
Rent to Value Ratio
Active
$535,000
4
bds
|
2
ba
|
2,384
sqft
|
built
2011
1549 Frontier Trl, Angleton, TX 77515
$-805
Cash flow
-7.9%
Cash-on-Cash Return
3.9%
Cap rate
0.7%
Rent to Value Ratio
Active
$637,500
4
bds
|
4
ba
|
3,841
sqft
|
built
2023
9951 Chapman Trl, Manvel, TX 77578
$-1,634
Cash flow
-13.4%
Cash-on-Cash Return
2.6%
Cap rate
0.7%
Rent to Value Ratio
Active
$380,000
4
bds
|
3
ba
|
2,691
sqft
|
built
1999
6505 River Glen Ct, Pearland, TX 77584
$-664
Cash flow
-9.1%
Cash-on-Cash Return
3.6%
Cap rate
0.7%
Rent to Value Ratio

Active
$170,000
3
bds
|
2
ba
|
1,201
sqft
|
built
1956
1510 W 11th St, Freeport, TX 77541
$-125
Cash flow
-3.8%
Cash-on-Cash Return
4.8%
Cap rate
0.8%
Rent to Value Ratio
Active
$395,900
3
bds
|
2
ba
|
1,152
sqft
|
built
2012
818 Surf Dr, Surfside Beach, TX 77541
$-957
Cash flow
-12.6%
Cash-on-Cash Return
2.8%
Cap rate
0.5%
Rent to Value Ratio
Active
$273,000
3
bds
|
3
ba
|
1,843
sqft
|
built
2023
4050 Champlain Way, Iowa Colony, TX 77583
$-372
Cash flow
-7.1%
Cash-on-Cash Return
4.0%
Cap rate
1.0%
Rent to Value Ratio
Active
$246,000
3
bds
|
2
ba
|
1,596
sqft
|
built
2014
9439 Amethyst Glen Dr, Rosharon, TX 77583
$-551
Cash flow
-11.7%
Cash-on-Cash Return
3.0%
Cap rate
0.8%
Rent to Value Ratio
Active
$239,000
4
bds
|
2
ba
|
2,352
sqft
|
built
1961
2417 County Road 349, Brazoria, TX 77422
$171
Cash flow
3.7%
Cash-on-Cash Return
6.5%
Cap rate
1.0%
Rent to Value Ratio

Active
$250,000
3
bds
|
1
ba
|
2,028
sqft
|
built
1955
1518 S Columbia Dr, West Columbia, TX 77486
$-407
Cash flow
-8.5%
Cash-on-Cash Return
3.7%
Cap rate
0.7%
Rent to Value Ratio
Active
$370,000
2
bds
|
3
ba
|
1,540
sqft
|
built
2018
915 Live Oak Dr, Jones Creek, TX 77541
$-708
Cash flow
-10.0%
Cash-on-Cash Return
3.4%
Cap rate
0.6%
Rent to Value Ratio
Active
$199,000
2
bds
|
2
ba
|
1,029
sqft
|
built
2021
135 Ellis Ln, West Columbia, TX 77486
$-27
Cash flow
-0.7%
Cash-on-Cash Return
5.5%
Cap rate
0.9%
Rent to Value Ratio
Active
$315,000
3
bds
|
2
ba
|
1,910
sqft
|
built
2008
4602 Pompton Ct, Pearland, TX 77584
$-599
Cash flow
-9.9%
Cash-on-Cash Return
3.4%
Cap rate
0.8%
Rent to Value Ratio
Active
$265,000
3
bds
|
2
ba
|
1,526
sqft
|
built
1982
2803 N Brompton Dr, Pearland, TX 77584
$-408
Cash flow
-8.0%
Cash-on-Cash Return
3.8%
Cap rate
0.8%
Rent to Value Ratio
Active
$366,000
3
bds
|
2
ba
|
1,808
sqft
|
built
1994
3530 Wellington Dr, Pearland, TX 77584
$-719
Cash flow
-10.2%
Cash-on-Cash Return
3.3%
Cap rate
0.6%
Rent to Value Ratio
Active
$410,000
4
bds
|
3
ba
|
2,653
sqft
|
built
2017
4320 Mesquite Terrace Dr, Manvel, TX 77578
$-1,166
Cash flow
-14.8%
Cash-on-Cash Return
2.3%
Cap rate
0.7%
Rent to Value Ratio