Bexar County Investment Properties for Sale
Browse homes for sale and investment properties in Bexar County. Refine your search by price, property type, or more.
Best cash flowing properties in Bexar County
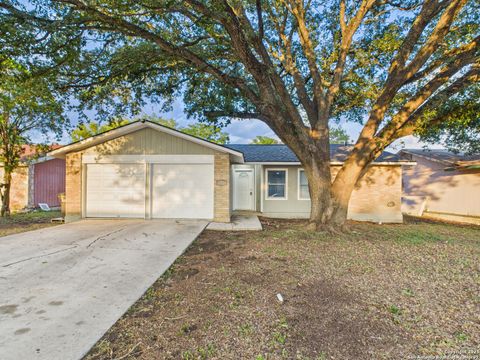
Active
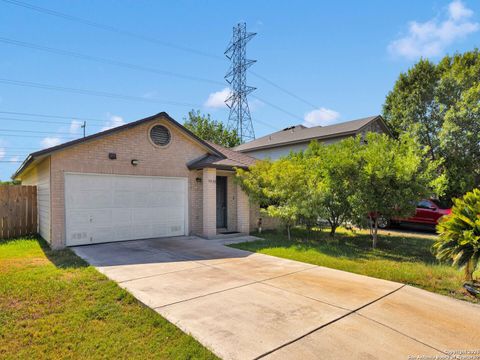
$184,900
3
bds
|
2
ba
|
1,056
sqft
|
built
2001
7838 Cortland Oak, San Antonio, TX 78254
$-86
Cash flow
-2.4%
Cash-on-Cash Return
5.1%
Cap rate
0.9%
Rent to Value Ratio
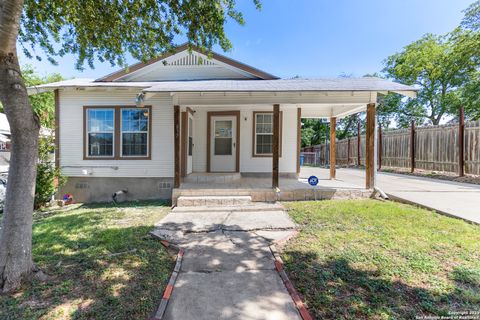
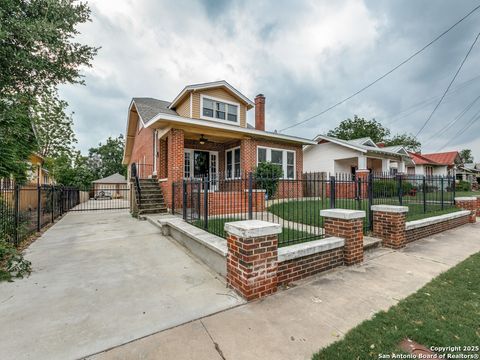
Active
$164,000
2
bds
|
1
ba
|
958
sqft
|
built
1926
837 Westfall Ave, San Antonio, TX 78210
$-130
Cash flow
-4.1%
Cash-on-Cash Return
4.7%
Cap rate
1.0%
Rent to Value Ratio
3,370 out of 3,714 properties for sale in Bexar County
Limited Results Shown
Create a free account, or log in to reveal all property listings and enjoy the complete experience.
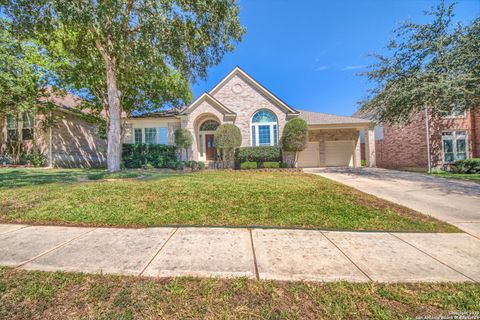
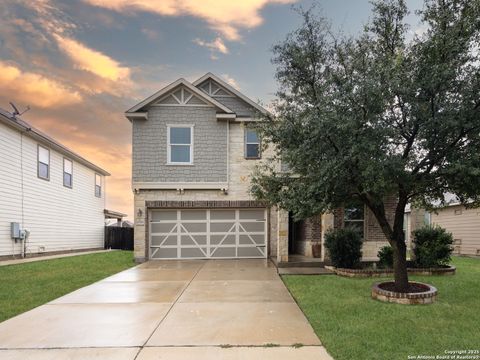
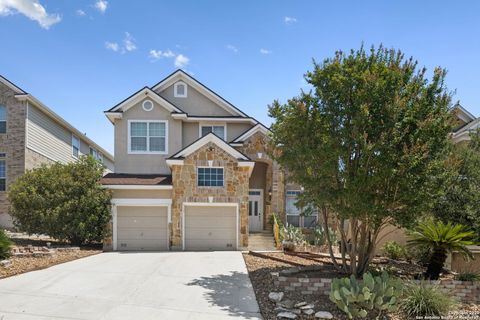
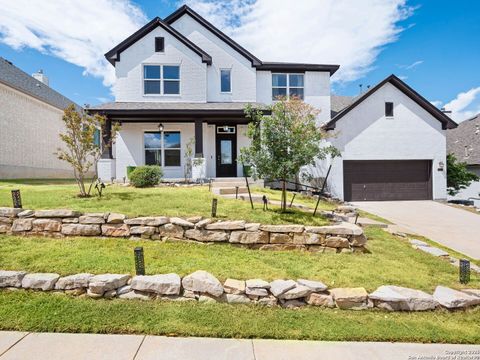
Active
$589,000
4
bds
|
4
ba
|
3,191
sqft
|
built
2002
1711 Montecino, San Antonio, TX 78258
$-1,522
Cash flow
-13.5%
Cash-on-Cash Return
2.6%
Cap rate
0.6%
Rent to Value Ratio

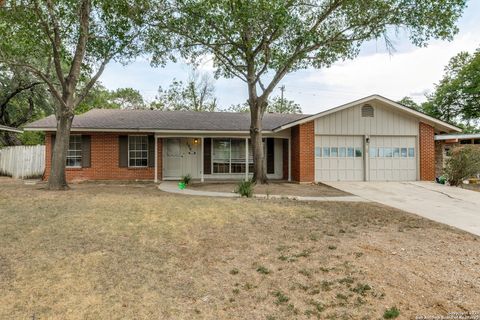
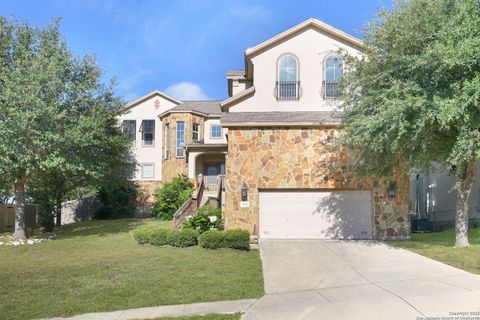
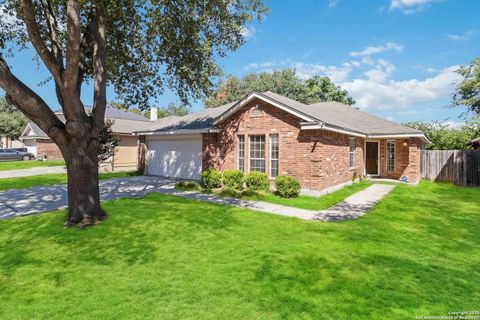
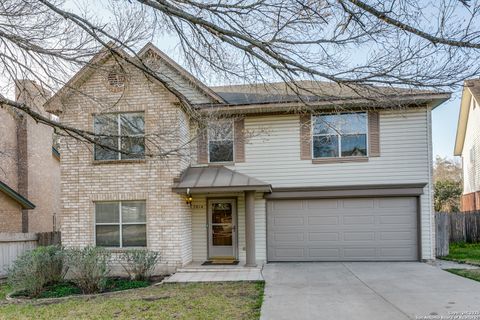
Active
$465,000
4
bds
|
3
ba
|
2,531
sqft
|
built
2011
25151 Buttermilk Ln, San Antonio, TX 78255
$-1,781
Cash flow
-20.0%
Cash-on-Cash Return
1.1%
Cap rate
0.4%
Rent to Value Ratio
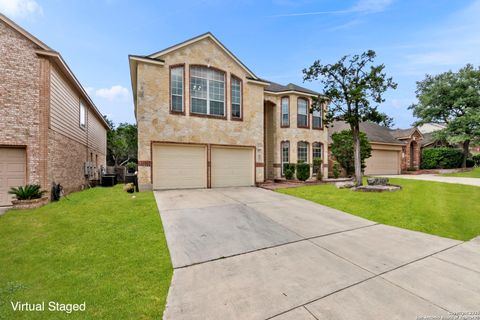
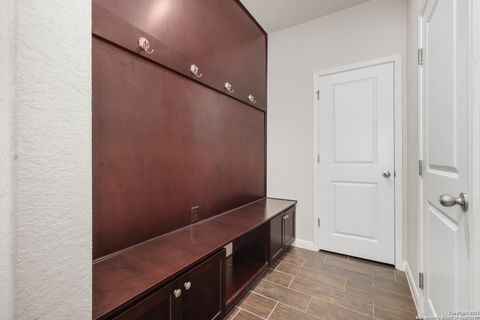
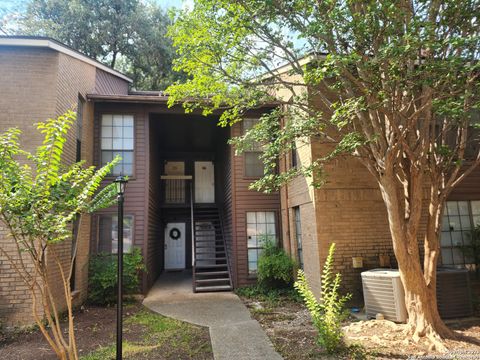
Active
$248,000
3
bds
|
2
ba
|
1,318
sqft
|
built
1960
106 Warwich Dr, San Antonio, TX 78216
$-388
Cash flow
-8.2%
Cash-on-Cash Return
3.8%
Cap rate
0.7%
Rent to Value Ratio

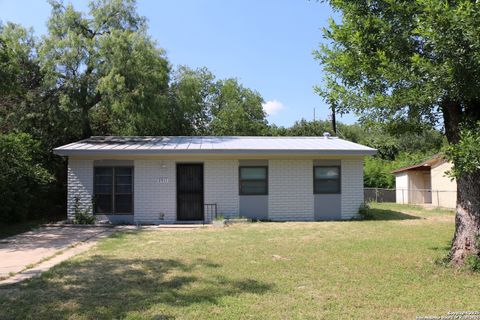
Active
$245,000
3
bds
|
3
ba
|
1,911
sqft
|
built
2015
231 Pleasanton Cir, San Antonio, TX 78221
$-433
Cash flow
-9.2%
Cash-on-Cash Return
3.6%
Cap rate
0.7%
Rent to Value Ratio
Active
$285,000
3
bds
|
2
ba
|
1,646
sqft
|
built
1984
6003 Broadmeadow, San Antonio, TX 78240
$-672
Cash flow
-12.3%
Cash-on-Cash Return
2.9%
Cap rate
0.6%
Rent to Value Ratio
Active
$400,000
4
bds
|
3
ba
|
3,048
sqft
|
built
2001
12707 Happy Cedar, Helotes, TX 78023
$-883
Cash flow
-11.5%
Cash-on-Cash Return
3.0%
Cap rate
0.6%
Rent to Value Ratio

Active
$177,999
2
bds
|
3
ba
|
1,099
sqft
|
built
1982
11815 Vance Jackson Rd, San Antonio, TX 78230
$-692
Cash flow
-20.3%
Cash-on-Cash Return
1.0%
Cap rate
0.8%
Rent to Value Ratio
Active
$309,843
2
bds
|
3
ba
|
1,838
sqft
|
built
2008
6926 Abbey Fls, San Antonio, TX 78249
$-894
Cash flow
-15.1%
Cash-on-Cash Return
2.2%
Cap rate
0.6%
Rent to Value Ratio
Active
$315,000
4
bds
|
3
ba
|
2,194
sqft
|
built
2021
15231 Harbor Lndg, Von Ormy, TX 78073
$-823
Cash flow
-13.6%
Cash-on-Cash Return
2.5%
Cap rate
0.6%
Rent to Value Ratio
Active
$220,000
4
bds
|
2
ba
|
1,208
sqft
|
built
1985
6459 Marcum Dr, San Antonio, TX 78227
$-435
Cash flow
-10.3%
Cash-on-Cash Return
3.3%
Cap rate
0.6%
Rent to Value Ratio
Active
$375,000
3
bds
|
3
ba
|
2,732
sqft
|
built
2008
12018 Treewell Gln, San Antonio, TX 78249
$-827
Cash flow
-11.5%
Cash-on-Cash Return
3.0%
Cap rate
0.7%
Rent to Value Ratio
Active
$520,000
4
bds
|
3
ba
|
3,100
sqft
|
built
2004
23110 Fairway Brg, San Antonio, TX 78258
$-1,278
Cash flow
-12.8%
Cash-on-Cash Return
2.7%
Cap rate
0.6%
Rent to Value Ratio

Active
$197,500
2
bds
|
3
ba
|
932
sqft
|
built
1946
2336 E Houston St, San Antonio, TX 78202
$-629
Cash flow
-16.6%
Cash-on-Cash Return
1.9%
Cap rate
0.5%
Rent to Value Ratio
Active
$426,000
4
bds
|
3
ba
|
2,380
sqft
|
built
2023
11110 Coppola, San Antonio, TX 78254
$-809
Cash flow
-9.9%
Cash-on-Cash Return
3.4%
Cap rate
0.6%
Rent to Value Ratio
Active
$265,000
3
bds
|
3
ba
|
2,424
sqft
|
built
2000
4507 River Brook Dr, San Antonio, TX 78244
$-462
Cash flow
-9.1%
Cash-on-Cash Return
3.6%
Cap rate
0.7%
Rent to Value Ratio
Active
$295,000
3
bds
|
3
ba
|
1,906
sqft
|
built
2016
6527 Wind Path, San Antonio, TX 78239
$-443
Cash flow
-7.8%
Cash-on-Cash Return
3.9%
Cap rate
0.7%
Rent to Value Ratio
Active
$300,000
5
bds
|
3
ba
|
2,215
sqft
|
built
1983
2518 Ridge Leaf, San Antonio, TX 78251
$-739
Cash flow
-12.9%
Cash-on-Cash Return
2.7%
Cap rate
0.6%
Rent to Value Ratio
Active
$200,000
3
bds
|
2
ba
|
1,386
sqft
|
built
1995
8307 Morning Grv, Converse, TX 78109
$-162
Cash flow
-4.2%
Cash-on-Cash Return
4.7%
Cap rate
0.8%
Rent to Value Ratio
Active
$414,000
4
bds
|
3
ba
|
2,280
sqft
|
built
1924
1520 Virginia Blvd, San Antonio, TX 78203
$-930
Cash flow
-11.7%
Cash-on-Cash Return
3.0%
Cap rate
0.6%
Rent to Value Ratio
Active
$330,000
4
bds
|
3
ba
|
2,409
sqft
|
built
2015
8318 Pioneer Fld, San Antonio, TX 78253
$-627
Cash flow
-9.9%
Cash-on-Cash Return
3.4%
Cap rate
0.7%
Rent to Value Ratio
Active
$580,000
4
bds
|
4
ba
|
3,120
sqft
|
built
2006
7306 Washita Way, San Antonio, TX 78256
$-1,355
Cash flow
-12.2%
Cash-on-Cash Return
2.9%
Cap rate
0.6%
Rent to Value Ratio
Active
$500,000
5
bds
|
3
ba
|
3,238
sqft
|
built
2006
26415 Walden Oak, San Antonio, TX 78260
$-1,274
Cash flow
-13.3%
Cash-on-Cash Return
2.6%
Cap rate
0.5%
Rent to Value Ratio
Active
$515,000
4
bds
|
3
ba
|
3,453
sqft
|
built
2007
21419 La Pena Dr, San Antonio, TX 78258
$-1,359
Cash flow
-13.8%
Cash-on-Cash Return
2.5%
Cap rate
0.5%
Rent to Value Ratio
Active
$290,000
3
bds
|
2
ba
|
1,948
sqft
|
built
2000
5403 Stormy Autumn, San Antonio, TX 78247
$-713
Cash flow
-12.8%
Cash-on-Cash Return
2.7%
Cap rate
0.6%
Rent to Value Ratio
Active
$425,000
5
bds
|
3
ba
|
2,959
sqft
|
built
2021
13826 Chester Knl, San Antonio, TX 78253
$-901
Cash flow
-11.1%
Cash-on-Cash Return
3.1%
Cap rate
0.6%
Rent to Value Ratio
Active
$179,900
3
bds
|
2
ba
|
962
sqft
|
built
1971
2911 Cumbre Dr, San Antonio, TX 78237
$-298
Cash flow
-8.6%
Cash-on-Cash Return
3.7%
Cap rate
0.7%
Rent to Value Ratio
Active
$239,900
3
bds
|
2
ba
|
1,243
sqft
|
built
1980
9134 Ocean Gate St, San Antonio, TX 78242
$-439
Cash flow
-9.5%
Cash-on-Cash Return
3.5%
Cap rate
0.7%
Rent to Value Ratio
Active
$569,900
5
bds
|
4
ba
|
4,228
sqft
|
built
2006
2747 Trinity Vw, San Antonio, TX 78261
$-1,705
Cash flow
-15.6%
Cash-on-Cash Return
2.1%
Cap rate
0.5%
Rent to Value Ratio

Active
$420,000
4
bds
|
3
ba
|
2,621
sqft
|
built
1966
3703 Newrock Dr, San Antonio, TX 78230
$-1,021
Cash flow
-12.7%
Cash-on-Cash Return
2.8%
Cap rate
0.5%
Rent to Value Ratio
Active
$358,750
3
bds
|
3
ba
|
2,515
sqft
|
built
1995
2814 Redrock Trl, San Antonio, TX 78259
$-762
Cash flow
-11.1%
Cash-on-Cash Return
3.1%
Cap rate
0.6%
Rent to Value Ratio

Active
$2,850,000
5
bds
|
8
ba
|
8,842
sqft
|
built
2008
19703 Terra Mont, San Antonio, TX 78255
$-10,748
Cash flow
-19.7%
Cash-on-Cash Return
1.2%
Cap rate
0.3%
Rent to Value Ratio

Active
$280,000
3
bds
|
2
ba
|
1,182
sqft
|
built
1910
706 S Olive St, San Antonio, TX 78203
$-414
Cash flow
-7.7%
Cash-on-Cash Return
3.9%
Cap rate
0.7%
Rent to Value Ratio
Active
$159,500
2
bds
|
2
ba
|
1,030
sqft
|
built
1982
8611 Datapoint Dr, San Antonio, TX 78229
$-417
Cash flow
-13.6%
Cash-on-Cash Return
2.5%
Cap rate
0.8%
Rent to Value Ratio
Active
$625,000
2
bds
|
2
ba
|
1,496
sqft
|
built
2010
610 E Market St, San Antonio, TX 78205
$-2,819
Cash flow
-23.5%
Cash-on-Cash Return
0.3%
Cap rate
0.6%
Rent to Value Ratio
Active
$214,500
2
bds
|
2
ba
|
1,213
sqft
|
built
1983
5742 Larkdale Dr, San Antonio, TX 78233
$-359
Cash flow
-8.7%
Cash-on-Cash Return
3.7%
Cap rate
0.7%
Rent to Value Ratio
Active
$265,000
3
bds
|
3
ba
|
2,174
sqft
|
built
2005
9239 Everton, San Antonio, TX 78245
$-561
Cash flow
-11.0%
Cash-on-Cash Return
3.1%
Cap rate
0.7%
Rent to Value Ratio

Active
$330,000
3
bds
|
2
ba
|
1,969
sqft
|
built
1965
10711 Janet Lee Dr, San Antonio, TX 78230
$-722
Cash flow
-11.4%
Cash-on-Cash Return
3.1%
Cap rate
0.7%
Rent to Value Ratio

Active
$295,000
3
bds
|
3
ba
|
1,381
sqft
|
built
1973
6106 Vance Jackson Rd, San Antonio, TX 78230
$-846
Cash flow
-15.0%
Cash-on-Cash Return
2.2%
Cap rate
0.6%
Rent to Value Ratio