Smith County Investment Properties for Sale
Browse homes for sale and investment properties in Smith County. Refine your search by price, property type, or more.
Best cash flowing properties in Smith County
Active
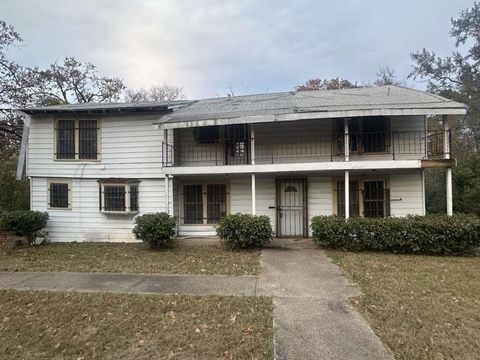
$64,999
3
bds
|
2
ba
|
2,080
sqft
|
built
1937
1552 Crescent Dr, Tyler, TX 75702
$600
Cash flow
10.8%
Cash-on-Cash Return
11.1%
Cap rate
1.8%
Rent to Value Ratio
Active
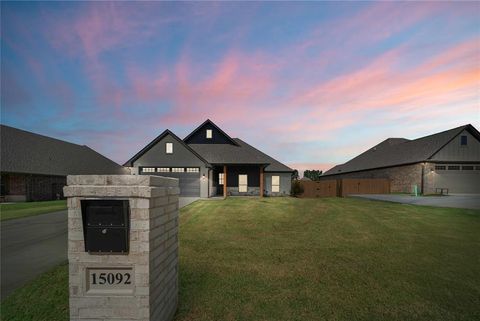
$388,000
3
bds
|
2
ba
|
1,791
sqft
|
built
2024
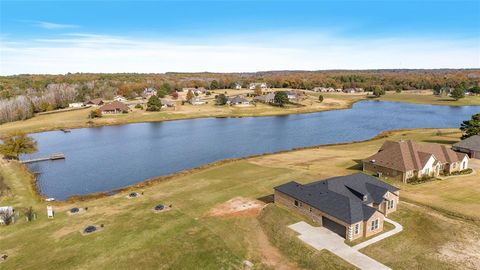
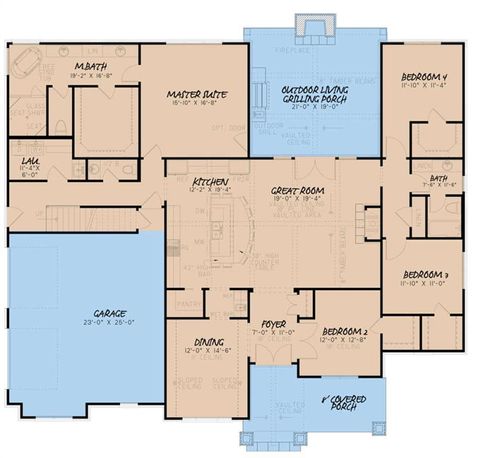
15092 High Country Acres Ln, Tyler, TX 75706
$96
Cash flow
1.3%
Cash-on-Cash Return
6.0%
Cap rate
0.7%
Rent to Value Ratio
17 out of 354 properties for sale in Smith County
Limited Results Shown
Create a free account, or log in to reveal all property listings and enjoy the complete experience.

Active
$779,000
3
bds
|
4
ba
|
3,169
sqft
|
built
2019
202 Winged Foot Dr, Lindale, TX 75771
$-1,831
Cash flow
-12.3%
Cash-on-Cash Return
2.9%
Cap rate
0.4%
Rent to Value Ratio

Active
$935,000
5
bds
|
4
ba
|
3,406
sqft
|
built
2023
4585 Cascades Blvd, Tyler, TX 75709
$-713
Cash flow
-4.0%
Cash-on-Cash Return
4.8%
Cap rate
0.6%
Rent to Value Ratio
Active
$660,000
4
bds
|
3
ba
|
2,743
sqft
|
built
2008
17332 Pintail Dr, Flint, TX 75762
$-1,776
Cash flow
-14.0%
Cash-on-Cash Return
2.4%
Cap rate
0.5%
Rent to Value Ratio
Active
$412,200
4
bds
|
2
ba
|
2,061
sqft
|
built
2021
9031 Teal Flight Way, Tyler, TX 75703
$-747
Cash flow
-9.5%
Cash-on-Cash Return
3.5%
Cap rate
0.6%
Rent to Value Ratio
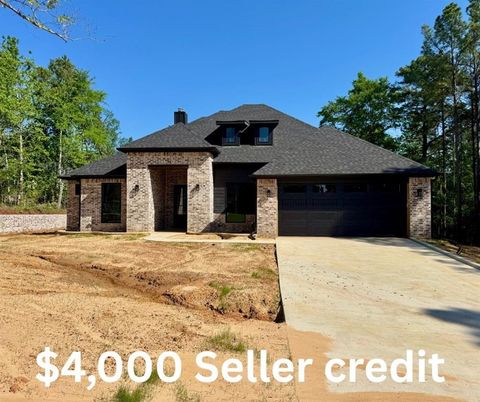
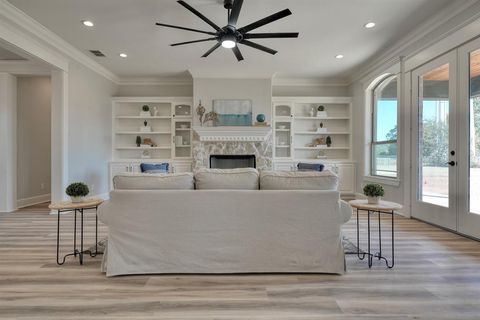
Active
$569,900
4
bds
|
3
ba
|
2,506
sqft
|
built
2025
23690 Champion Dr, Lindale, TX 75771
$-617
Cash flow
-5.6%
Cash-on-Cash Return
4.4%
Cap rate
0.6%
Rent to Value Ratio
Active
$570,000
5
bds
|
3
ba
|
2,537
sqft
|
built
2023
16621 Stallion Shores Ct, Lindale, TX 75771
$-1,238
Cash flow
-11.3%
Cash-on-Cash Return
3.1%
Cap rate
0.4%
Rent to Value Ratio
Active
$269,000
3
bds
|
2
ba
|
1,647
sqft
|
built
2007
440 Maggie Cir, Flint, TX 75762
$-243
Cash flow
-4.7%
Cash-on-Cash Return
4.6%
Cap rate
0.7%
Rent to Value Ratio
Active
$334,900
4
bds
|
2
ba
|
1,735
sqft
|
built
2025
16226 Crossing Cir, Lindale, TX 75771
$92
Cash flow
1.4%
Cash-on-Cash Return
6.0%
Cap rate
0.7%
Rent to Value Ratio

Active
$176,297
2
bds
|
1
ba
|
816
sqft
|
built
1960
506 N Main St, Lindale, TX 75771
$76
Cash flow
2.2%
Cash-on-Cash Return
6.2%
Cap rate
0.9%
Rent to Value Ratio
Active
$239,900
3
bds
|
2
ba
|
1,209
sqft
|
built
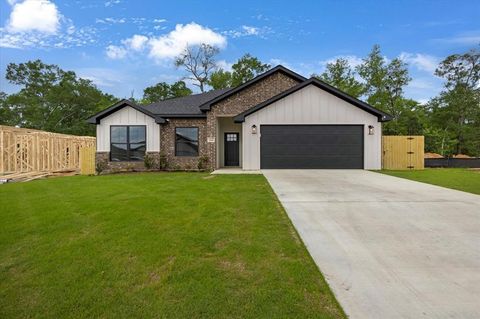
2025
2514 N Glass Ave, Tyler, TX 75702
$-48
Cash flow
-1.0%
Cash-on-Cash Return
5.4%
Cap rate
0.7%
Rent to Value Ratio
Active
$310,000
3
bds
|
2
ba
|
1,780
sqft
|
built
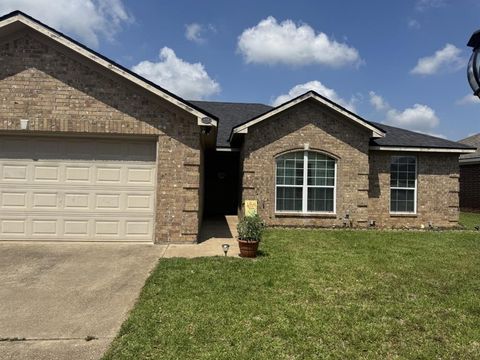
2000
5614 Thomas Nelson Dr, Tyler, TX 75707
$-473
Cash flow
-8.0%
Cash-on-Cash Return
3.8%
Cap rate
0.6%
Rent to Value Ratio
Active
$570,000
5
bds
|
3
ba
|
2,520
sqft
|
built
2023
16651 Stallion Shores Ct, Lindale, TX 75771
$-1,238
Cash flow
-11.3%
Cash-on-Cash Return
3.1%
Cap rate
0.4%
Rent to Value Ratio
Active
$1,385,000
3
bds
|
4
ba
|
3,900
sqft
|
built
2010
20998 Kiva Cir, Flint, TX 75762
$-4,401
Cash flow
-16.6%
Cash-on-Cash Return
1.9%
Cap rate
0.4%
Rent to Value Ratio
Active
$467,000
4
bds
|
3
ba
|
2,440
sqft
|
built
2024
15939 Shepards Gln, Lindale, TX 75771
$-98
Cash flow
-1.1%
Cash-on-Cash Return
5.4%
Cap rate
0.7%
Rent to Value Ratio
Active
$719,000
3
bds
|
3
ba
|
3,100
sqft
|
built
2024
93 Ryder Cup Trl, Hideaway, TX 75771
$-651
Cash flow
-4.7%
Cash-on-Cash Return
4.6%
Cap rate
0.6%
Rent to Value Ratio