Greenwood, IN Investment Properties for Sale
Browse homes for sale and investment properties in Greenwood, IN. Refine your search by price, property type, or more.
Best cash flowing properties in Greenwood, IN
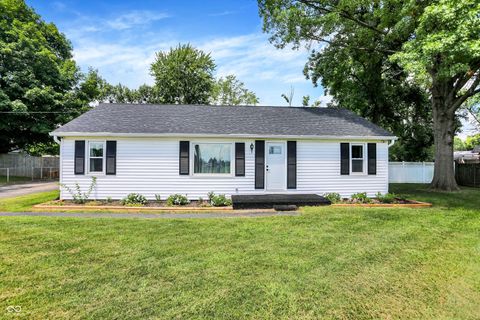
Active
$210,000
3
bds
|
1
ba
|
1,248
sqft
|
built
1956
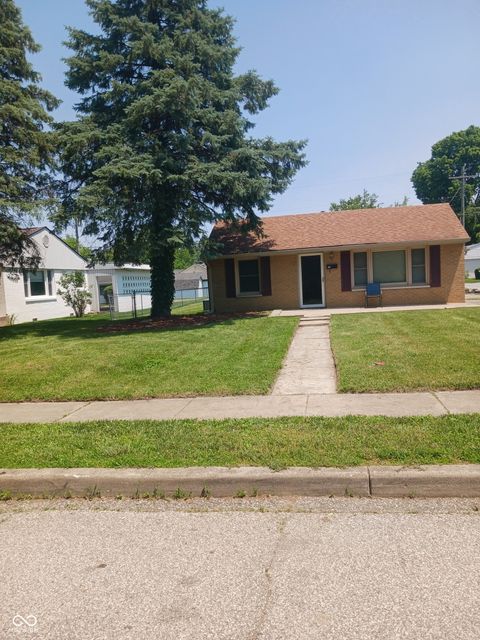
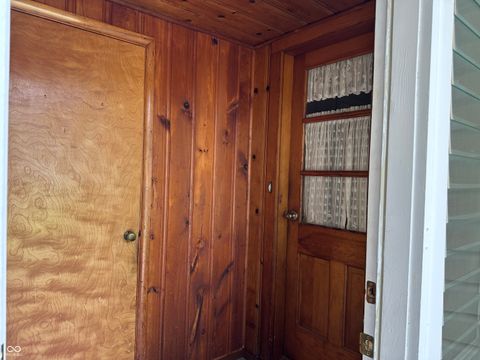
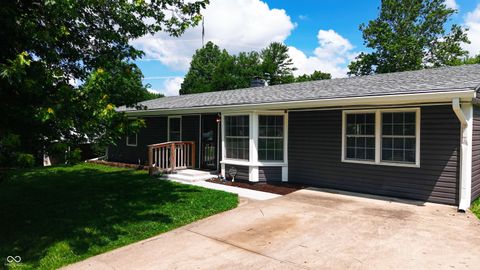
351 N Smart St, Greenwood, IN 46142
$28
Cash flow
0.7%
Cash-on-Cash Return
6.3%
Cap rate
0.8%
Rent to Value Ratio
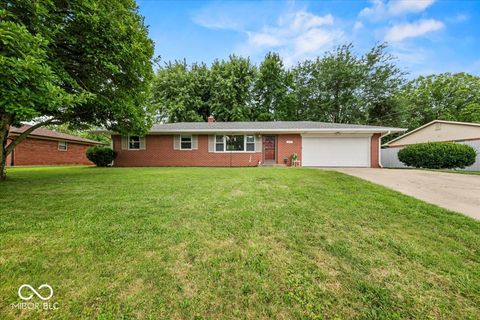
Active
$250,000
3
bds
|
2
ba
|
1,358
sqft
|
built
1954
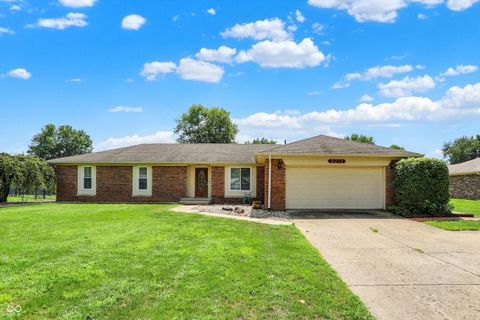
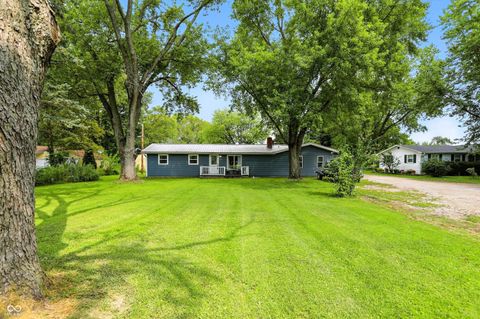
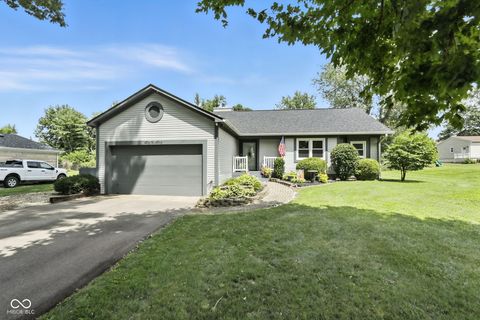
497 S Hendricks Dr, Greenwood, IN 46142
$-39
Cash flow
-0.8%
Cash-on-Cash Return
6.0%
Cap rate
0.7%
Rent to Value Ratio
149 out of 152 properties for sale in Greenwood, IN
Limited Results Shown
Create a free account, or log in to reveal all property listings and enjoy the complete experience.
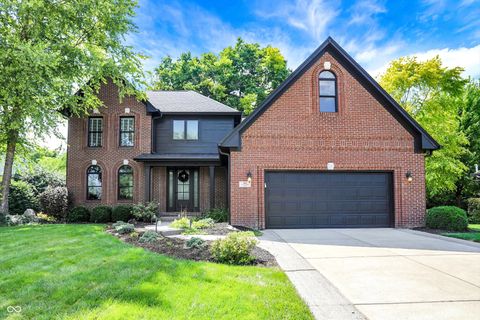
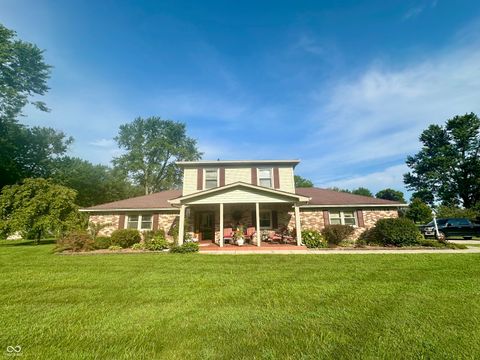
Active
$325,000
3
bds
|
2
ba
|
1,588
sqft
|
built
1977
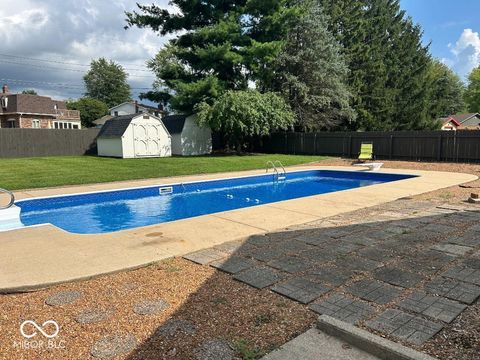
5271 Pattie Ct, Greenwood, IN 46143
$-285
Cash flow
-4.6%
Cash-on-Cash Return
5.1%
Cap rate
0.6%
Rent to Value Ratio
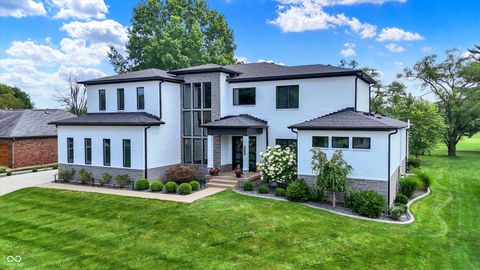
Active
$430,000
3
bds
|
2
ba
|
1,632
sqft
|
built
1958
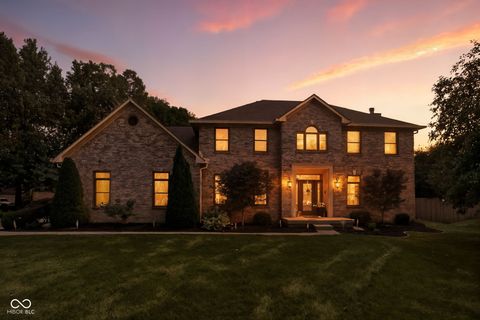
177 Noack Rd, Greenwood, IN 46143
$-961
Cash flow
-11.7%
Cash-on-Cash Return
3.5%
Cap rate
0.4%
Rent to Value Ratio

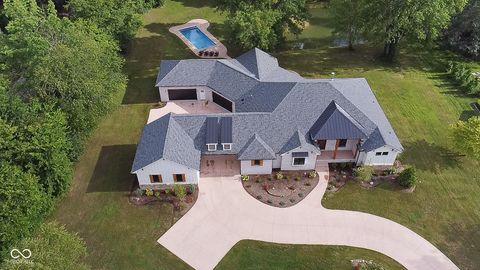
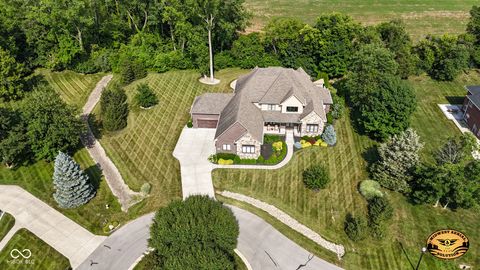
Active
$1,225,000
5
bds
|
5
ba
|
4,845
sqft
|
built
2018
5218 W Smokey Row Rd, Greenwood, IN 46143
$-3,791
Cash flow
-16.1%
Cash-on-Cash Return
2.4%
Cap rate
0.3%
Rent to Value Ratio
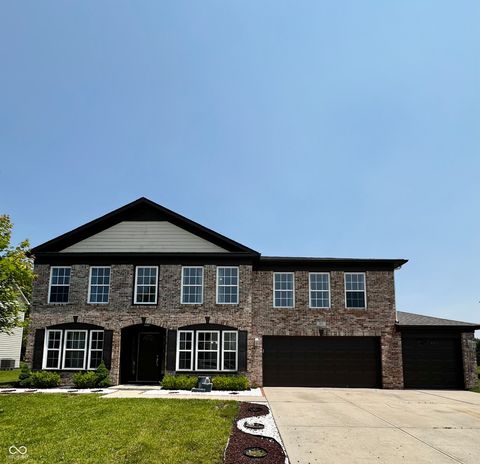
Active
$615,000
4
bds
|
4
ba
|
3,435
sqft
|
built
2002
588 Walnut Woods Dr, Greenwood, IN 46142
$-413
Cash flow
-3.5%
Cash-on-Cash Return
5.3%
Cap rate
0.7%
Rent to Value Ratio
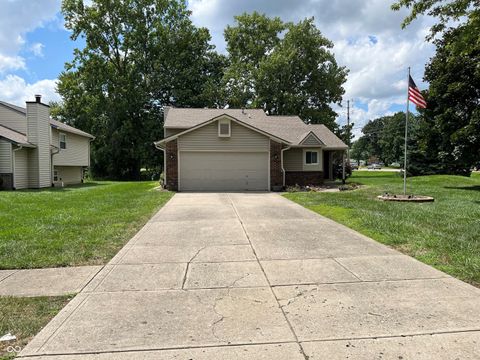
Active
$229,000
3
bds
|
1
ba
|
1,207
sqft
|
built
1960
822 W Smith Valley Rd, Greenwood, IN 46142
$-69
Cash flow
-1.6%
Cash-on-Cash Return
5.8%
Cap rate
0.7%
Rent to Value Ratio
Active
$1,900,000
4
bds
|
4
ba
|
4,995
sqft
|
built
2020
3081 Golfview Dr, Greenwood, IN 46143
$-6,973
Cash flow
-19.1%
Cash-on-Cash Return
1.7%
Cap rate
0.2%
Rent to Value Ratio
Active
$285,900
3
bds
|
2
ba
|
3,096
sqft
|
built
1960
1081 Lawndale Dr, Greenwood, IN 46142
$-223
Cash flow
-4.1%
Cash-on-Cash Return
5.2%
Cap rate
0.6%
Rent to Value Ratio
Active
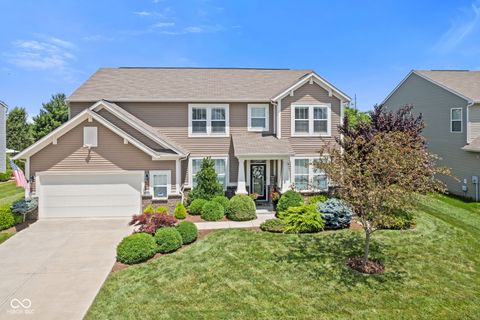
$438,900
4
bds
|
3
ba
|
2,974
sqft
|
built
2014
1294 Vista Way, Greenwood, IN 46143
$-567
Cash flow
-6.7%
Cash-on-Cash Return
4.6%
Cap rate
0.6%
Rent to Value Ratio
Active
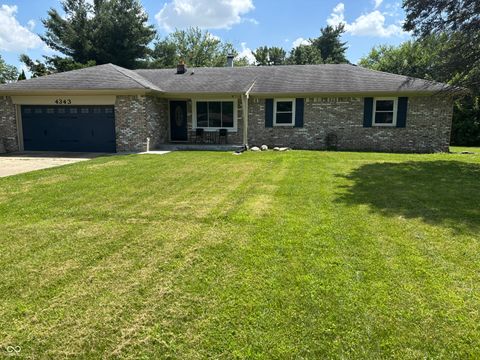
$282,000
3
bds
|
2
ba
|
1,356
sqft
|
built
1975
4343 W Fairview Rd, Greenwood, IN 46142
$-134
Cash flow
-2.5%
Cash-on-Cash Return
5.6%
Cap rate
0.7%
Rent to Value Ratio
Active
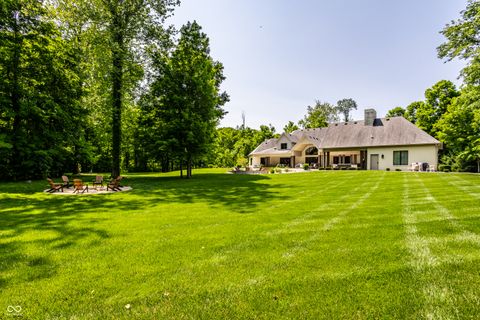
$2,500,000
4
bds
|
5
ba
|
5,779
sqft
|
built
2015
4242 Watson Rd, Greenwood, IN 46143
$-10,322
Cash flow
-21.5%
Cash-on-Cash Return
1.2%
Cap rate
0.1%
Rent to Value Ratio
Active
$635,000
5
bds
|
5
ba
|
4,680
sqft
|
built
1988
1021 Hudson Bay Dr, Greenwood, IN 46142
$-1,045
Cash flow
-8.6%
Cash-on-Cash Return
4.2%
Cap rate
0.5%
Rent to Value Ratio

Active
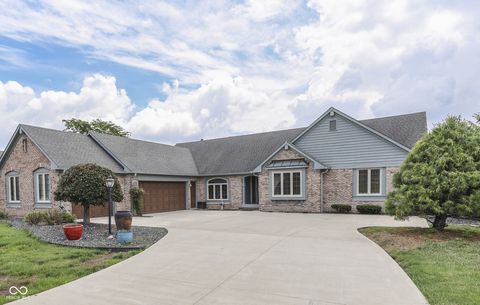
$799,000
4
bds
|
5
ba
|
4,994
sqft
|
built
1998
3256 Waterside Ct, Greenwood, IN 46143
$-643
Cash flow
-4.2%
Cash-on-Cash Return
5.2%
Cap rate
0.6%
Rent to Value Ratio
Active
$1,999,995
5
bds
|
6
ba
|
7,454
sqft
|
built
2022
3621 Olive Branch Rd, Greenwood, IN 46143
$-6,312
Cash flow
-16.5%
Cash-on-Cash Return
2.4%
Cap rate
0.3%
Rent to Value Ratio
Active
$669,900
5
bds
|
4
ba
|
3,431
sqft
|
built
2002
2553 Forest Hills Blvd, Greenwood, IN 46143
$-1,046
Cash flow
-8.1%
Cash-on-Cash Return
4.3%
Cap rate
0.5%
Rent to Value Ratio
Active
$395,000
4
bds
|
3
ba
|
2,362
sqft
|
built
2022
1065 Bent Branch Ln, Greenwood, IN 46143
$-327
Cash flow
-4.3%
Cash-on-Cash Return
5.2%
Cap rate
0.6%
Rent to Value Ratio
Active
$369,000
4
bds
|
3
ba
|
3,115
sqft
|
built
2019
1026 Sorrell Pass, Greenwood, IN 46143
$-205
Cash flow
-2.9%
Cash-on-Cash Return
5.5%
Cap rate
0.7%
Rent to Value Ratio
Active
$265,000
3
bds
|
2
ba
|
1,629
sqft
|
built
1963
988 Rolling Hill Rd, Greenwood, IN 46142
$-115
Cash flow
-2.3%
Cash-on-Cash Return
5.6%
Cap rate
0.7%
Rent to Value Ratio
Active
$300,000
3
bds
|
2
ba
|
1,624
sqft
|
built
1988
5130 Mount Pleasant North St, Greenwood, IN 46142
$-157
Cash flow
-2.7%
Cash-on-Cash Return
5.5%
Cap rate
0.7%
Rent to Value Ratio

Active
$450,000
5
bds
|
4
ba
|
3,132
sqft
|
built
2017
1299 Bobwhite Ct, Greenwood, IN 46143
$-511
Cash flow
-5.9%
Cash-on-Cash Return
4.8%
Cap rate
0.6%
Rent to Value Ratio
Active
$360,000
4
bds
|
2
ba
|
1,626
sqft
|
built
1976
783 Colonial Way, Greenwood, IN 46142
$-602
Cash flow
-8.7%
Cash-on-Cash Return
4.1%
Cap rate
0.5%
Rent to Value Ratio
Active
$515,000
4
bds
|
4
ba
|
3,135
sqft
|
built
1992
4489 Annelo Dr, Greenwood, IN 46142
$-499
Cash flow
-5.1%
Cash-on-Cash Return
5.0%
Cap rate
0.6%
Rent to Value Ratio
Active
$329,000
4
bds
|
3
ba
|
3,250
sqft
|
built
2006
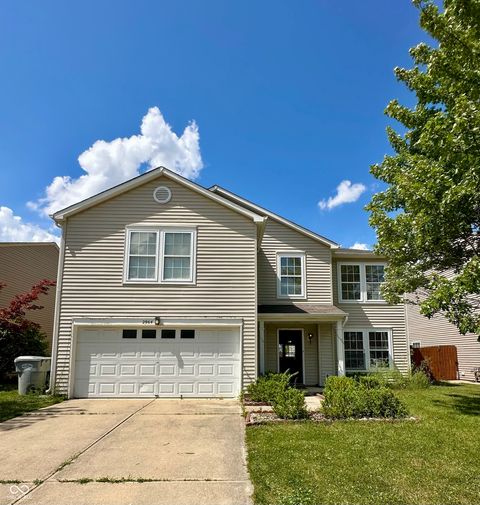
2964 Sentiment Ln, Greenwood, IN 46143
$-196
Cash flow
-3.1%
Cash-on-Cash Return
5.4%
Cap rate
0.7%
Rent to Value Ratio

Active
$299,900
5
bds
|
3
ba
|
2,075
sqft
|
built
2002
768 Tall Timber Dr, Greenwood, IN 46143
$-175
Cash flow
-3.0%
Cash-on-Cash Return
5.4%
Cap rate
0.7%
Rent to Value Ratio

Active
$359,900
3
bds
|
2
ba
|
1,927
sqft
|
built
2006
1790 Woodfield Dr, Greenwood, IN 46143
$-361
Cash flow
-5.2%
Cash-on-Cash Return
4.9%
Cap rate
0.6%
Rent to Value Ratio
Active
$675,000
4
bds
|
4
ba
|
6,684
sqft
|
built
2000
129 Back Creek Overlook, Greenwood, IN 46142
$-1,267
Cash flow
-9.8%
Cash-on-Cash Return
3.9%
Cap rate
0.5%
Rent to Value Ratio

Active
$329,900
4
bds
|
3
ba
|
2,642
sqft
|
built
2013
6451 Enclave Ct, Greenwood, IN 46143
$-136
Cash flow
-2.2%
Cash-on-Cash Return
5.7%
Cap rate
0.7%
Rent to Value Ratio
Active
$396,500
3
bds
|
3
ba
|
1,984
sqft
|
built
1991
4759 Silver Hill Dr, Greenwood, IN 46142
$-325
Cash flow
-4.3%
Cash-on-Cash Return
5.2%
Cap rate
0.6%
Rent to Value Ratio
Active
$314,000
5
bds
|
2
ba
|
2,064
sqft
|
built
1952
121 Ursal Ln, Greenwood, IN 46143
$-90
Cash flow
-1.5%
Cash-on-Cash Return
5.8%
Cap rate
0.7%
Rent to Value Ratio
Active
$415,000
3
bds
|
3
ba
|
2,182
sqft
|
built
2022
1758 Pelham Dr, Greenwood, IN 46143
$-258
Cash flow
-3.2%
Cash-on-Cash Return
5.4%
Cap rate
0.7%
Rent to Value Ratio
Active
$319,900
3
bds
|
2
ba
|
1,875
sqft
|
built
1972
601 Shady Ln, Greenwood, IN 46142
$-146
Cash flow
-2.4%
Cash-on-Cash Return
5.6%
Cap rate
0.7%
Rent to Value Ratio
Active
$314,000
3
bds
|
2
ba
|
2,172
sqft
|
built
1973
931 Beech Dr, Greenwood, IN 46142
$-297
Cash flow
-4.9%
Cash-on-Cash Return
5.0%
Cap rate
0.6%
Rent to Value Ratio
Active
$224,900
3
bds
|
2
ba
|
1,689
sqft
|
built
1962
1110 Barefoot Trl, Greenwood, IN 46142
$-48
Cash flow
-1.1%
Cash-on-Cash Return
5.9%
Cap rate
0.7%
Rent to Value Ratio
Active
$369,900
3
bds
|
3
ba
|
1,895
sqft
|
built
1973
378 Lea Ln, Greenwood, IN 46142
$-515
Cash flow
-7.3%
Cash-on-Cash Return
4.5%
Cap rate
0.5%
Rent to Value Ratio
Active
$1,795,000
5
bds
|
6
ba
|
8,070
sqft
|
built
2014
4545 Pascagoula Run, Greenwood, IN 46143
$-6,780
Cash flow
-19.7%
Cash-on-Cash Return
1.6%
Cap rate
0.2%
Rent to Value Ratio

Active
$425,000
5
bds
|
3
ba
|
3,318
sqft
|
built
1994
3696 Lakeshore Ct, Greenwood, IN 46143
$-67
Cash flow
-0.8%
Cash-on-Cash Return
6.0%
Cap rate
0.7%
Rent to Value Ratio

Active
$295,000
3
bds
|
2
ba
|
1,578
sqft
|
built
1951
3232 Grace St, Greenwood, IN 46143
$-131
Cash flow
-2.3%
Cash-on-Cash Return
5.6%
Cap rate
0.7%
Rent to Value Ratio
Active
$460,000
5
bds
|
3
ba
|
4,700
sqft
|
built
2007
585 Fireside Dr, Greenwood, IN 46143
$-246
Cash flow
-2.8%
Cash-on-Cash Return
5.5%
Cap rate
0.7%
Rent to Value Ratio
Active
$289,000
4
bds
|
3
ba
|
1,563
sqft
|
built
1991
1292 Timber Creek Ln, Greenwood, IN 46142
$-438
Cash flow
-7.9%
Cash-on-Cash Return
4.3%
Cap rate
0.6%
Rent to Value Ratio