Laughlin, NV Investment Properties for Sale
Browse homes for sale and investment properties in Laughlin, NV. Refine your search by price, property type, or more.
Best cash flowing properties in Laughlin, NV

Active
$125,000
1
bds
|
1
ba
|
572
sqft
|
built
1990
3550 Bay Sands Dr, Laughlin, NV 89029
$-143
Cash flow
-6.0%
Cash-on-Cash Return
4.9%
Cap rate
1.0%
Rent to Value Ratio
Active
$110,000
2
bds
|
2
ba
|
986
sqft
|
built
1989
2040 Mesquite Ln, Laughlin, NV 89029
$-159
Cash flow
-7.5%
Cash-on-Cash Return
4.5%
Cap rate
1.0%
Rent to Value Ratio
139 out of 143 properties for sale in Laughlin, NV
Limited Results Shown
Create a free account, or log in to reveal all property listings and enjoy the complete experience.
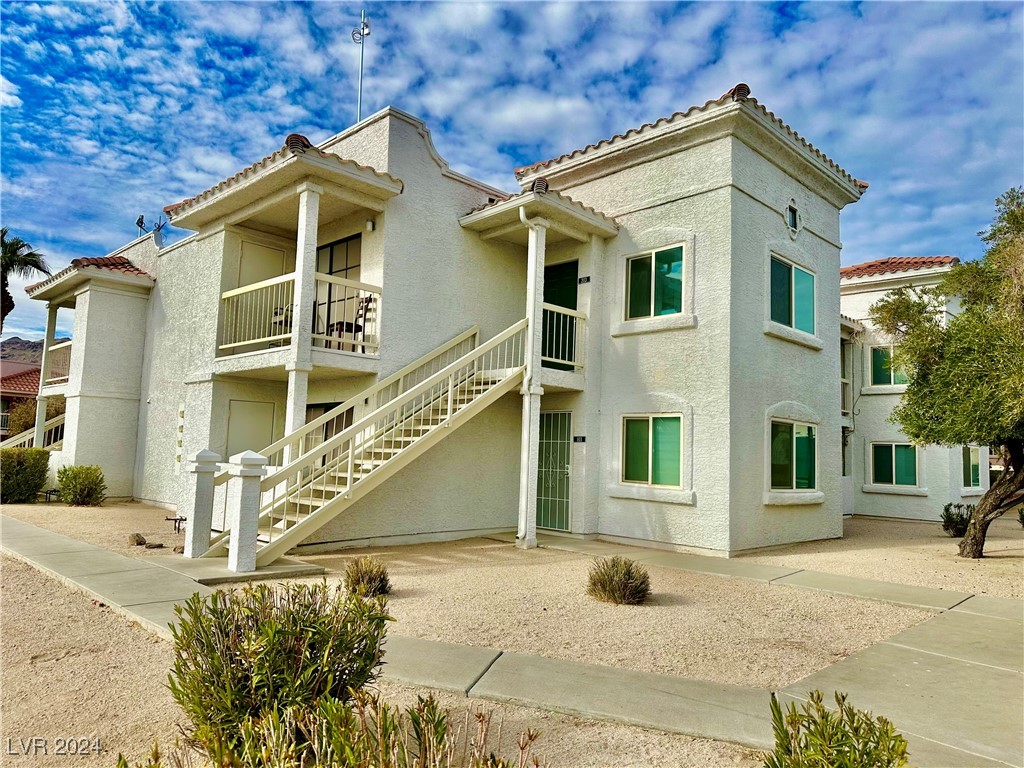
Active
$205,000
2
bds
|
2
ba
|
1,120
sqft
|
built
1989
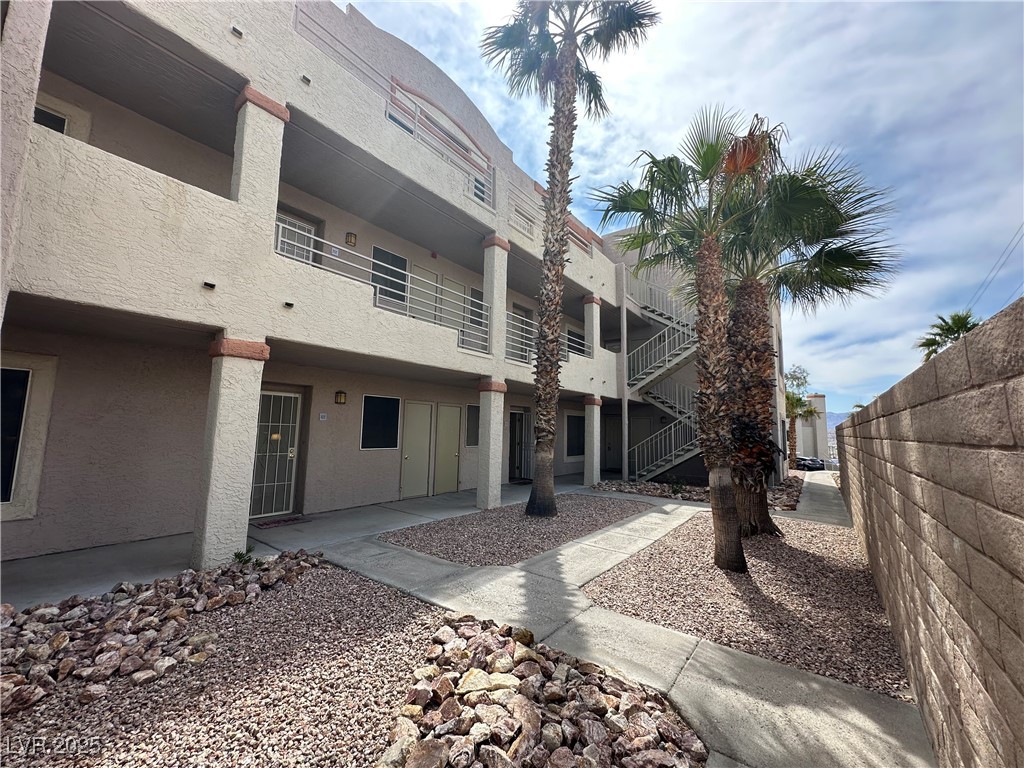
2191 Bay Club Dr, Laughlin, NV 89029
$-583
Cash flow
-14.8%
Cash-on-Cash Return
2.9%
Cap rate
0.6%
Rent to Value Ratio
Active
$179,990
2
bds
|
2
ba
|
900
sqft
|
built
1990
2160 Highpointe Dr, Laughlin, NV 89029
$-544
Cash flow
-15.8%
Cash-on-Cash Return
2.7%
Cap rate
0.6%
Rent to Value Ratio

Pending
$159,000
2
bds
|
2
ba
|
900
sqft
|
built
1990
2160 Highpointe Dr, Laughlin, NV 89029
$-434
Cash flow
-14.2%
Cash-on-Cash Return
3.0%
Cap rate
0.7%
Rent to Value Ratio
Active
$175,000
2
bds
|
1
ba
|
998
sqft
|
built
1994
3550 Bay Sands Dr, Laughlin, NV 89029
$-331
Cash flow
-9.9%
Cash-on-Cash Return
4.0%
Cap rate
0.8%
Rent to Value Ratio

Active
$147,000
2
bds
|
1
ba
|
810
sqft
|
built
1984
3800 Desert Marina Dr, Laughlin, NV 89029
$-319
Cash flow
-11.3%
Cash-on-Cash Return
3.7%
Cap rate
0.8%
Rent to Value Ratio

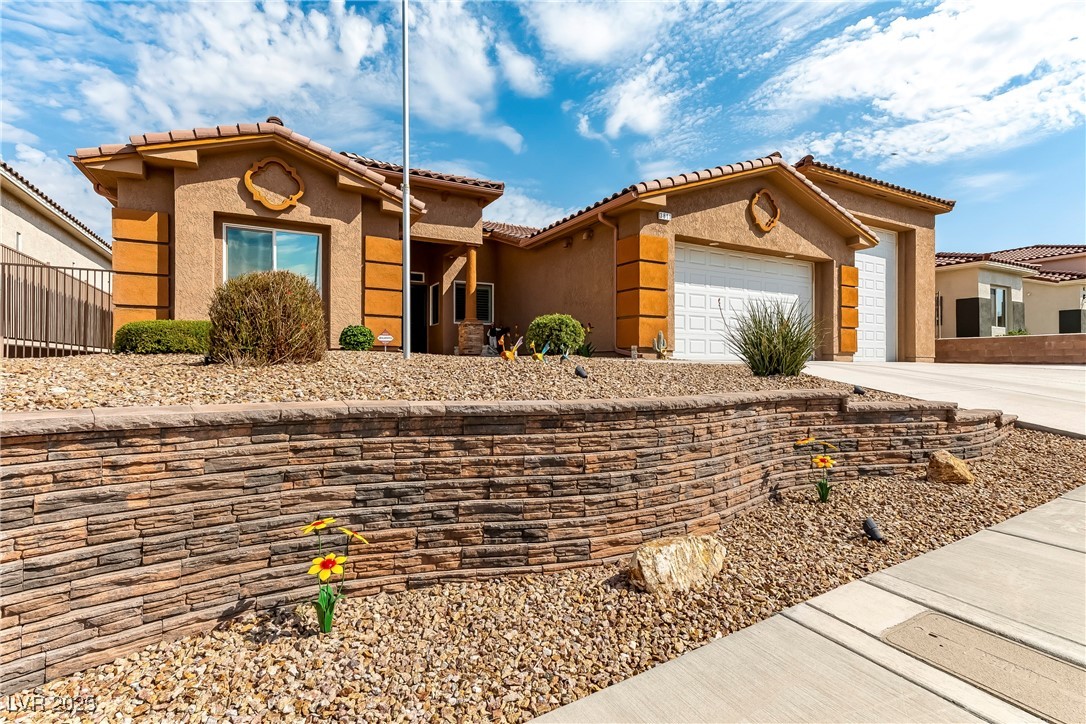
Active
$299,999
3
bds
|
2
ba
|
1,404
sqft
|
built
2018
2175 Limestone Cove Ct, Laughlin, NV 89029
$-666
Cash flow
-11.6%
Cash-on-Cash Return
3.6%
Cap rate
0.6%
Rent to Value Ratio
Active
$130,000
2
bds
|
2
ba
|
990
sqft
|
built
1989
2004 Mesquite Ln, Laughlin, NV 89029
$-228
Cash flow
-9.2%
Cash-on-Cash Return
4.2%
Cap rate
0.8%
Rent to Value Ratio
Active
$125,000
1
bds
|
1
ba
|
572
sqft
|
built
1990
3550 Bay Sands Dr, Laughlin, NV 89029
$-143
Cash flow
-6.0%
Cash-on-Cash Return
4.9%
Cap rate
1.0%
Rent to Value Ratio
Active
$155,000
2
bds
|
2
ba
|
986
sqft
|
built
1988
2076 Mesquite Ln, Laughlin, NV 89029
$-250
Cash flow
-8.4%
Cash-on-Cash Return
4.4%
Cap rate
0.8%
Rent to Value Ratio
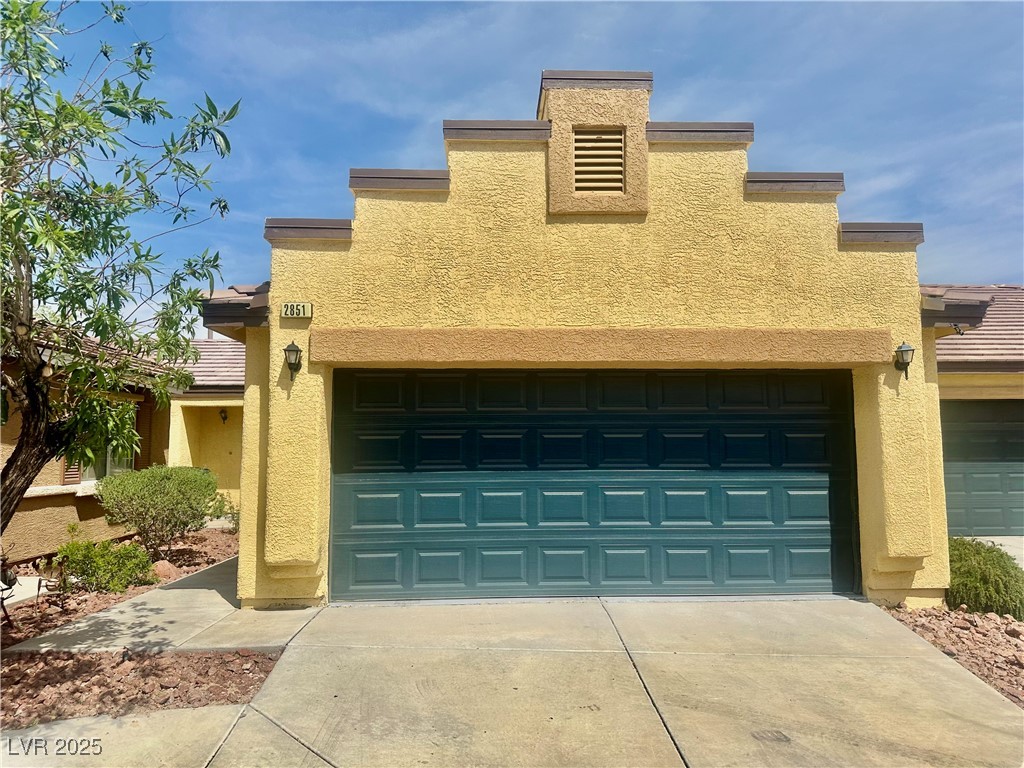
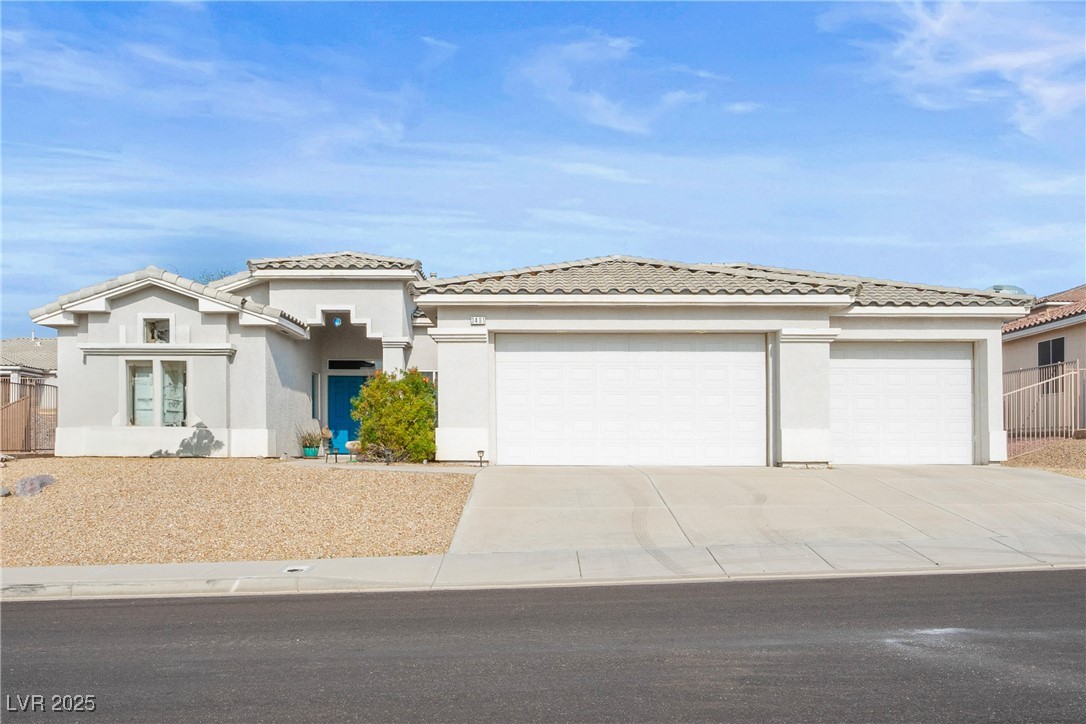
Active
$299,999
3
bds
|
2
ba
|
1,404
sqft
|
built
2007
2851 China Cove St, Laughlin, NV 89029
$-728
Cash flow
-12.7%
Cash-on-Cash Return
3.4%
Cap rate
0.6%
Rent to Value Ratio

Active
$255,000
3
bds
|
2
ba
|
1,161
sqft
|
built
1987
2148 Pebble Creek Ln, Laughlin, NV 89029
$-564
Cash flow
-11.5%
Cash-on-Cash Return
3.6%
Cap rate
0.6%
Rent to Value Ratio
Active
$189,900
2
bds
|
2
ba
|
1,205
sqft
|
built
1984
3791 Desert Marina Dr, Laughlin, NV 89029
$-488
Cash flow
-13.4%
Cash-on-Cash Return
3.2%
Cap rate
0.7%
Rent to Value Ratio

Active
$429,900
4
bds
|
3
ba
|
1,906
sqft
|
built
2017
2748 Brinkley Manor St, Laughlin, NV 89029
$-1,505
Cash flow
-18.3%
Cash-on-Cash Return
2.1%
Cap rate
0.4%
Rent to Value Ratio
Active
$157,900
2
bds
|
2
ba
|
986
sqft
|
built
1989
2072 Mesquite Ln, Laughlin, NV 89029
$-403
Cash flow
-13.3%
Cash-on-Cash Return
3.2%
Cap rate
0.7%
Rent to Value Ratio

Active
$189,900
2
bds
|
2
ba
|
1,067
sqft
|
built
1990
3550 Bay Sands Dr, Laughlin, NV 89029
$-367
Cash flow
-10.1%
Cash-on-Cash Return
4.0%
Cap rate
0.7%
Rent to Value Ratio

Active
$245,000
2
bds
|
3
ba
|
1,617
sqft
|
built
1995
2282 Camel Mesa Dr, Laughlin, NV 89029
$-642
Cash flow
-13.7%
Cash-on-Cash Return
3.1%
Cap rate
0.7%
Rent to Value Ratio
Active
$219,990
2
bds
|
2
ba
|
1,205
sqft
|
built
1984
3740 Desert Marina Dr, Laughlin, NV 89029
$-657
Cash flow
-15.6%
Cash-on-Cash Return
2.7%
Cap rate
0.6%
Rent to Value Ratio
Active
$340,000
2
bds
|
2
ba
|
944
sqft
|
built
1984
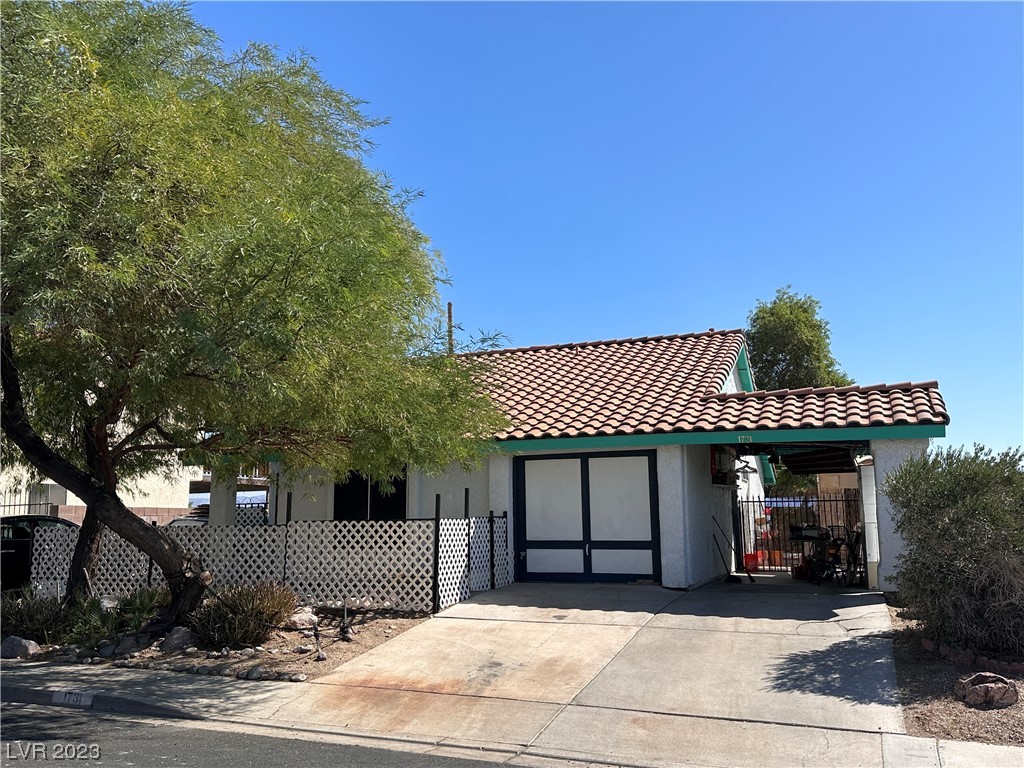
1731 Paloma Ave, Laughlin, NV 89029
$-875
Cash flow
-13.4%
Cash-on-Cash Return
3.2%
Cap rate
0.4%
Rent to Value Ratio
Active
$198,800
2
bds
|
2
ba
|
900
sqft
|
built
1990
2240 Highpointe Dr, Laughlin, NV 89029
$-503
Cash flow
-13.2%
Cash-on-Cash Return
3.2%
Cap rate
0.7%
Rent to Value Ratio
Active
$549,900
3
bds
|
2
ba
|
1,757
sqft
|
built
2016
3811 Queen Elizabeth Ct, Laughlin, NV 89029
$-1,725
Cash flow
-16.4%
Cash-on-Cash Return
2.5%
Cap rate
0.4%
Rent to Value Ratio
Active
$395,900
3
bds
|
2
ba
|
1,757
sqft
|
built
2006
3491 Cottage Thistle Dr, Laughlin, NV 89029
$-902
Cash flow
-11.9%
Cash-on-Cash Return
3.5%
Cap rate
0.5%
Rent to Value Ratio
Active
$188,000
2
bds
|
2
ba
|
1,023
sqft
|
built
1987
1904 Las Palmas Ln, Laughlin, NV 89029
$-337
Cash flow
-9.4%
Cash-on-Cash Return
4.1%
Cap rate
0.8%
Rent to Value Ratio

Active
$260,000
2
bds
|
2
ba
|
1,002
sqft
|
built
2017
2790 Chetco River St, Laughlin, NV 89029
$-593
Cash flow
-11.9%
Cash-on-Cash Return
3.5%
Cap rate
0.6%
Rent to Value Ratio
Active
$269,000
3
bds
|
3
ba
|
1,617
sqft
|
built
1993
2208 Rugged Mesa Dr, Laughlin, NV 89029
$-806
Cash flow
-15.6%
Cash-on-Cash Return
2.7%
Cap rate
0.6%
Rent to Value Ratio
Active
$225,000
2
bds
|
2
ba
|
900
sqft
|
built
1989
2191 Bay Club Dr, Laughlin, NV 89029
$-526
Cash flow
-12.2%
Cash-on-Cash Return
3.5%
Cap rate
0.6%
Rent to Value Ratio

Active
$245,000
2
bds
|
3
ba
|
1,634
sqft
|
built
1989
3859 Desert Marina Dr, Laughlin, NV 89029
$-459
Cash flow
-9.8%
Cash-on-Cash Return
4.0%
Cap rate
0.7%
Rent to Value Ratio

Active
$219,999
2
bds
|
2
ba
|
1,638
sqft
|
built
1989
3883 Desert Marina Dr, Laughlin, NV 89029
$-384
Cash flow
-9.1%
Cash-on-Cash Return
4.2%
Cap rate
0.8%
Rent to Value Ratio

Active
$439,990
3
bds
|
3
ba
|
1,947
sqft
|
built
2007
2681 Benton Cove St, Laughlin, NV 89029
$-1,185
Cash flow
-14.1%
Cash-on-Cash Return
3.1%
Cap rate
0.5%
Rent to Value Ratio

Active
$459,990
4
bds
|
3
ba
|
2,728
sqft
|
built
1989
2089 Avalon Dr, Laughlin, NV 89029
$-1,090
Cash flow
-12.4%
Cash-on-Cash Return
3.4%
Cap rate
0.5%
Rent to Value Ratio
Active
$120,000
1
bds
|
1
ba
|
572
sqft
|
built
1990
3550 Bay Sands Dr, Laughlin, NV 89029
$-312
Cash flow
-13.6%
Cash-on-Cash Return
3.2%
Cap rate
0.8%
Rent to Value Ratio
Active
$159,990
2
bds
|
2
ba
|
986
sqft
|
built
1989
2064 Mesquite Ln, Laughlin, NV 89029
$-414
Cash flow
-13.5%
Cash-on-Cash Return
3.2%
Cap rate
0.7%
Rent to Value Ratio

Active
$136,900
1
bds
|
1
ba
|
716
sqft
|
built
1990
3550 Bay Sands Dr, Laughlin, NV 89029
$-295
Cash flow
-11.2%
Cash-on-Cash Return
3.7%
Cap rate
0.8%
Rent to Value Ratio
Active
$255,000
3
bds
|
3
ba
|
1,617
sqft
|
built
1993
2219 Rugged Mesa Dr, Laughlin, NV 89029
$-855
Cash flow
-17.5%
Cash-on-Cash Return
2.3%
Cap rate
0.6%
Rent to Value Ratio

Active
$292,500
3
bds
|
2
ba
|
1,244
sqft
|
built
1989
2266 Carved Canyon Ln, Laughlin, NV 89029
$-517
Cash flow
-9.2%
Cash-on-Cash Return
4.2%
Cap rate
0.6%
Rent to Value Ratio
Active
$294,000
3
bds
|
2
ba
|
1,202
sqft
|
built
2017
2225 Chandler Ranch Pl, Laughlin, NV 89029
$-610
Cash flow
-10.8%
Cash-on-Cash Return
3.8%
Cap rate
0.6%
Rent to Value Ratio
Active
$400,000
3
bds
|
3
ba
|
2,248
sqft
|
built
2003
2905 Shimmering Bay St, Laughlin, NV 89029
$-864
Cash flow
-11.3%
Cash-on-Cash Return
3.7%
Cap rate
0.5%
Rent to Value Ratio
Active
$110,000
2
bds
|
2
ba
|
986
sqft
|
built
1989
2040 Mesquite Ln, Laughlin, NV 89029
$-159
Cash flow
-7.5%
Cash-on-Cash Return
4.5%
Cap rate
1.0%
Rent to Value Ratio
Active
$440,000
4
bds
|
3
ba
|
2,129
sqft
|
built
2016
2040 Port Royal Dr, Laughlin, NV 89029
$-1,154
Cash flow
-13.7%
Cash-on-Cash Return
3.1%
Cap rate
0.5%
Rent to Value Ratio
Active
$485,000
3
bds
|
3
ba
|
2,372
sqft
|
built
2006
3431 Cottage Thistle Dr, Laughlin, NV 89029
$-1,227
Cash flow
-13.2%
Cash-on-Cash Return
3.2%
Cap rate
0.5%
Rent to Value Ratio

Active
$239,900
3
bds
|
3
ba
|
1,617
sqft
|
built
1993
2223 Rugged Mesa Dr, Laughlin, NV 89029
$-608
Cash flow
-13.2%
Cash-on-Cash Return
3.2%
Cap rate
0.7%
Rent to Value Ratio