Miami Beach, FL Investment Properties for Sale
Browse homes for sale and investment properties in Miami Beach, FL. Refine your search by price, property type, or more.
Best cash flowing properties in Miami Beach, FL

Active
$197,000
bds
|
1
ba
|
420
sqft
|
built
1956
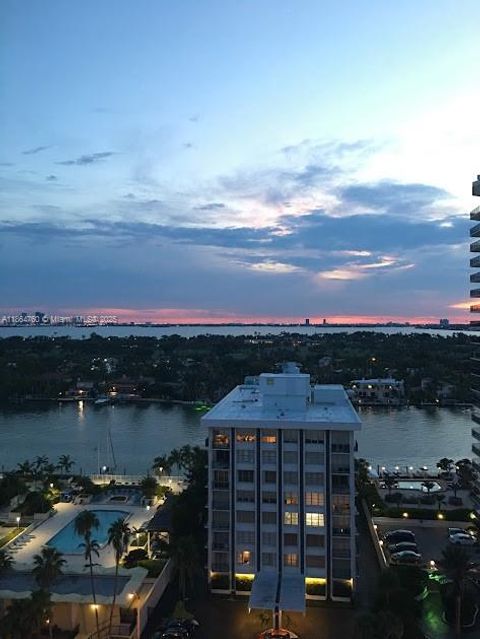
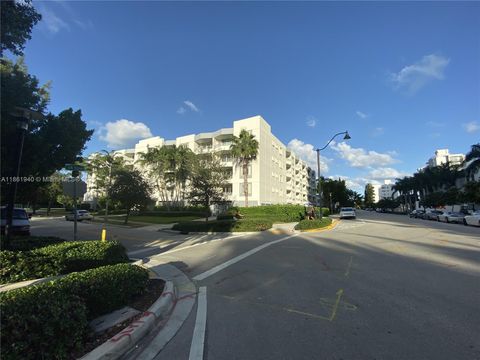
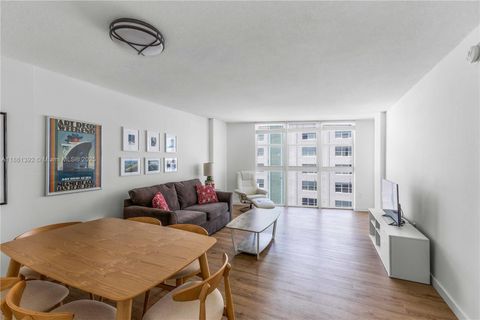
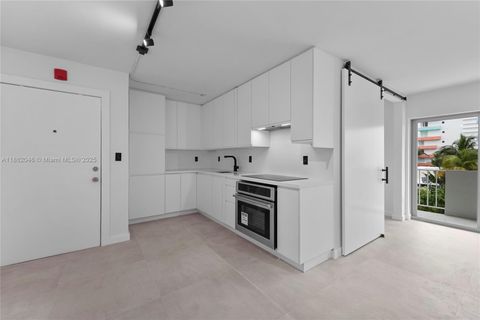
911 Meridian Ave, Miami Beach, FL 33139
$-429
Cash flow
-11.4%
Cash-on-Cash Return
3.5%
Cap rate
0.9%
Rent to Value Ratio

Active
$210,000
1
bds
|
1
ba
|
470
sqft
|
built
1940
750 Jefferson Ave, Miami Beach, FL 33139
$-469
Cash flow
-11.7%
Cash-on-Cash Return
3.5%
Cap rate
1.0%
Rent to Value Ratio
1,361 out of 1,522 properties for sale in Miami Beach, FL
Limited Results Shown
Create a free account, or log in to reveal all property listings and enjoy the complete experience.
Active
$550,000
1
bds
|
2
ba
|
930
sqft
|
built
1968
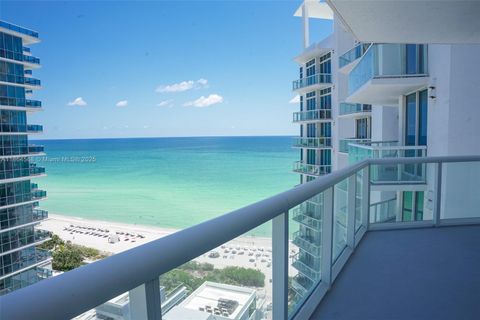
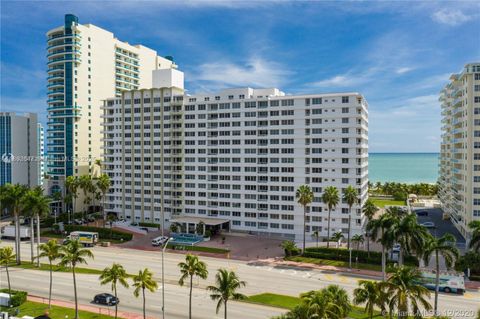
5601 Collins Ave, Miami Beach, FL 33140
$-2,067
Cash flow
-19.6%
Cash-on-Cash Return
1.6%
Cap rate
0.7%
Rent to Value Ratio

Active
$1,090,000
bds
|
1
ba
|
526
sqft
|
built
2005
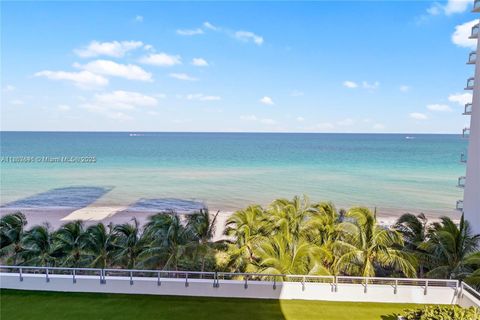
4401 Collins Ave, Miami Beach, FL 33140
$-4,725
Cash flow
-22.6%
Cash-on-Cash Return
0.9%
Cap rate
0.4%
Rent to Value Ratio
Active
$312,000
2
bds
|
1
ba
|
860
sqft
|
built
1957
1265 Marseille Dr, Miami Beach, FL 33141
$-981
Cash flow
-16.4%
Cash-on-Cash Return
2.4%
Cap rate
0.8%
Rent to Value Ratio

Active
$251,000
1
bds
|
1
ba
|
650
sqft
|
built
1965
1150 Euclid Ave, Miami Beach, FL 33139
$-717
Cash flow
-14.9%
Cash-on-Cash Return
2.7%
Cap rate
0.9%
Rent to Value Ratio
Active
$1,625,000
2
bds
|
2
ba
|
1,128
sqft
|
built
2004
6515 Collins Ave, Miami Beach, FL 33141
$-6,639
Cash flow
-21.3%
Cash-on-Cash Return
1.2%
Cap rate
0.4%
Rent to Value Ratio

Active
$450,000
2
bds
|
2
ba
|
950
sqft
|
built
1925
1018 Meridian Ave, Miami Beach, FL 33139
$-1,231
Cash flow
-14.3%
Cash-on-Cash Return
2.9%
Cap rate
0.8%
Rent to Value Ratio

Active
$475,000
2
bds
|
2
ba
|
878
sqft
|
built
1972
1455 West Ave, Miami Beach, FL 33139
$-1,568
Cash flow
-17.2%
Cash-on-Cash Return
2.2%
Cap rate
0.7%
Rent to Value Ratio

Active
$1,695,000
1
bds
|
2
ba
|
960
sqft
|
built
1926
2301 Collins Ave, Miami Beach, FL 33139
$-3,933
Cash flow
-12.1%
Cash-on-Cash Return
3.4%
Cap rate
0.5%
Rent to Value Ratio

Active
$6,600,000
3
bds
|
3
ba
|
2,092
sqft
|
built
2015
102 24th St, Miami Beach, FL 33139
$-39,384
Cash flow
-31.1%
Cash-on-Cash Return
-1.0%
Cap rate
0.1%
Rent to Value Ratio
Active
$259,000
1
bds
|
1
ba
|
750
sqft
|
built
1965
8000 Harding Ave, Miami Beach, FL 33141
$-523
Cash flow
-10.5%
Cash-on-Cash Return
3.7%
Cap rate
0.8%
Rent to Value Ratio
Active
$2,190,000
2
bds
|
2
ba
|
1,290
sqft
|
built
2008
6899 Collins Ave, Miami Beach, FL 33141
$-11,100
Cash flow
-26.4%
Cash-on-Cash Return
0.1%
Cap rate
0.4%
Rent to Value Ratio
Active
$850,000
3
bds
|
2
ba
|
1,363
sqft
|
built
1936
4015 N Meridian Ave, Miami Beach, FL 33140
$-1,783
Cash flow
-10.9%
Cash-on-Cash Return
3.6%
Cap rate
0.5%
Rent to Value Ratio

Active
$10,900,000
3
bds
|
4
ba
|
2,023
sqft
|
built
1935
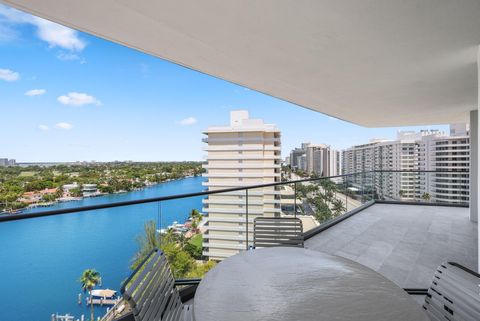
4640 N Bay Rd, Miami Beach, FL 33140
$-59,463
Cash flow
-28.5%
Cash-on-Cash Return
-0.4%
Cap rate
0.1%
Rent to Value Ratio
Active
$615,000
2
bds
|
2
ba
|
1,442
sqft
|
built
1968
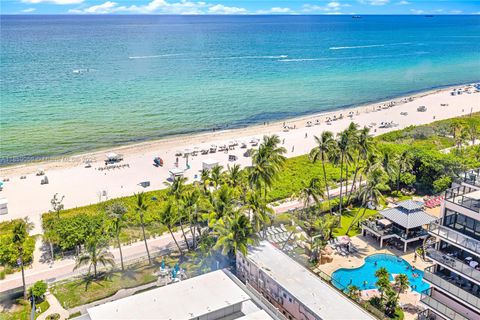
5750 Collins Ave, Miami Beach, FL 33140
$-2,022
Cash flow
-17.2%
Cash-on-Cash Return
2.2%
Cap rate
0.7%
Rent to Value Ratio
Active
$4,600,000
2
bds
|
2
ba
|
5,143
sqft
|
built
2013
980 W 48th St, Miami Beach, FL 33140
$-24,316
Cash flow
-27.6%
Cash-on-Cash Return
-0.2%
Cap rate
0.1%
Rent to Value Ratio

Active
$345,000
1
bds
|
1
ba
|
510
sqft
|
built
1954
865 Collins Ave, Miami Beach, FL 33139
$-787
Cash flow
-11.9%
Cash-on-Cash Return
3.4%
Cap rate
0.7%
Rent to Value Ratio

Active
$499,000
1
bds
|
1
ba
|
723
sqft
|
built
1966
1670 Lincoln Ct, Miami Beach, FL 33139
$-1,589
Cash flow
-16.6%
Cash-on-Cash Return
2.3%
Cap rate
0.7%
Rent to Value Ratio
Active
$269,000
1
bds
|
2
ba
|
780
sqft
|
built
1973
6900 Bay Dr, Miami Beach, FL 33141
$-859
Cash flow
-16.7%
Cash-on-Cash Return
2.3%
Cap rate
0.9%
Rent to Value Ratio
Active
$3,499,000
5
bds
|
5
ba
|
3,392
sqft
|
built
2015
5978 Alton Rd, Miami Beach, FL 33140
$-13,418
Cash flow
-20.0%
Cash-on-Cash Return
1.5%
Cap rate
0.3%
Rent to Value Ratio

Active
$240,000
1
bds
|
1
ba
|
600
sqft
|
built
1966
932 Euclid Ave, Miami Beach, FL 33139
$-907
Cash flow
-19.7%
Cash-on-Cash Return
1.6%
Cap rate
0.8%
Rent to Value Ratio
Active
$379,000
1
bds
|
2
ba
|
840
sqft
|
built
1970
5838 Collins Ave, Miami Beach, FL 33140
$-1,365
Cash flow
-18.8%
Cash-on-Cash Return
1.8%
Cap rate
0.7%
Rent to Value Ratio
Active
$720,000
2
bds
|
2
ba
|
1,290
sqft
|
built
1968
5601 Collins Ave, Miami Beach, FL 33140
$-2,982
Cash flow
-21.6%
Cash-on-Cash Return
1.2%
Cap rate
0.6%
Rent to Value Ratio
Active
$2,725,000
2
bds
|
3
ba
|
1,900
sqft
|
built
2008
1100 West Ave, Miami Beach, FL 33139
$-15,367
Cash flow
-29.4%
Cash-on-Cash Return
-0.6%
Cap rate
0.3%
Rent to Value Ratio
Active
$890,000
bds
|
1
ba
|
526
sqft
|
built
2005
4401 Collins Ave, Miami Beach, FL 33140
$-3,614
Cash flow
-21.2%
Cash-on-Cash Return
1.3%
Cap rate
0.4%
Rent to Value Ratio
Active
$715,000
1
bds
|
2
ba
|
826
sqft
|
built
2004
110 Washington Ave, Miami Beach, FL 33139
$-2,815
Cash flow
-20.5%
Cash-on-Cash Return
1.4%
Cap rate
0.5%
Rent to Value Ratio
Active
$9,950,000
5
bds
|
6
ba
|
4,473
sqft
|
built
2016
1825 Cleveland Rd, Miami Beach, FL 33141
$-51,137
Cash flow
-26.8%
Cash-on-Cash Return
0.0%
Cap rate
0.1%
Rent to Value Ratio
Active
$450,000
2
bds
|
2
ba
|
860
sqft
|
built
1925
1350 Pennsylvania Ave, Miami Beach, FL 33139
$-1,397
Cash flow
-16.2%
Cash-on-Cash Return
2.4%
Cap rate
0.6%
Rent to Value Ratio

Active
$400,000
2
bds
|
2
ba
|
930
sqft
|
built
1925
1027 Pennsylvania Ave, Miami Beach, FL 33139
$-1,159
Cash flow
-15.1%
Cash-on-Cash Return
2.7%
Cap rate
0.8%
Rent to Value Ratio
Active
$495,000
1
bds
|
2
ba
|
1,097
sqft
|
built
1964
5005 Collins Ave, Miami Beach, FL 33140
$-2,639
Cash flow
-27.8%
Cash-on-Cash Return
-0.2%
Cap rate
0.6%
Rent to Value Ratio
Active
$3,900,000
3
bds
|
2
ba
|
2,852
sqft
|
built
1948
4445 N Michigan Ave, Miami Beach, FL 33140
$-17,341
Cash flow
-23.2%
Cash-on-Cash Return
0.8%
Cap rate
0.2%
Rent to Value Ratio

Active
$699,000
2
bds
|
2
ba
|
1,061
sqft
|
built
1960
1500 Bay Rd, Miami Beach, FL 33139
$-2,393
Cash flow
-17.9%
Cash-on-Cash Return
2.0%
Cap rate
0.6%
Rent to Value Ratio
Active
$1,895,000
3
bds
|
5
ba
|
2,868
sqft
|
built
1974
5500 Collins Ave, Miami Beach, FL 33140
$-7,528
Cash flow
-20.7%
Cash-on-Cash Return
1.4%
Cap rate
0.5%
Rent to Value Ratio

Active
$235,000
1
bds
|
1
ba
|
493
sqft
|
built
1935
439 15th St, Miami Beach, FL 33139
$-684
Cash flow
-15.2%
Cash-on-Cash Return
2.7%
Cap rate
0.8%
Rent to Value Ratio
Active
$1,250,000
2
bds
|
3
ba
|
2,534
sqft
|
built
1963
5255 Collins Ave, Miami Beach, FL 33140
$-8,082
Cash flow
-33.7%
Cash-on-Cash Return
-1.6%
Cap rate
0.4%
Rent to Value Ratio
Active
$675,000
2
bds
|
2
ba
|
990
sqft
|
built
1999
1401 Bay Rd, Miami Beach, FL 33139
$-1,875
Cash flow
-14.5%
Cash-on-Cash Return
2.8%
Cap rate
0.5%
Rent to Value Ratio
Active
$349,000
1
bds
|
2
ba
|
750
sqft
|
built
1971
1228 West Ave, Miami Beach, FL 33139
$-1,064
Cash flow
-15.9%
Cash-on-Cash Return
2.5%
Cap rate
0.8%
Rent to Value Ratio
Active
$505,000
1
bds
|
1
ba
|
650
sqft
|
built
1970
240 Collins Ave, Miami Beach, FL 33139
$-924
Cash flow
-9.5%
Cash-on-Cash Return
4.0%
Cap rate
0.8%
Rent to Value Ratio

Active
$799,000
2
bds
|
2
ba
|
1,234
sqft
|
built
1971
1228 West Ave, Miami Beach, FL 33139
$-2,644
Cash flow
-17.3%
Cash-on-Cash Return
2.2%
Cap rate
0.6%
Rent to Value Ratio