Phoenix, AZ Investment Properties for Sale
Browse homes for sale and investment properties in Phoenix, AZ. Refine your search by price, property type, or more.
Best cash flowing properties in Phoenix, AZ
Active
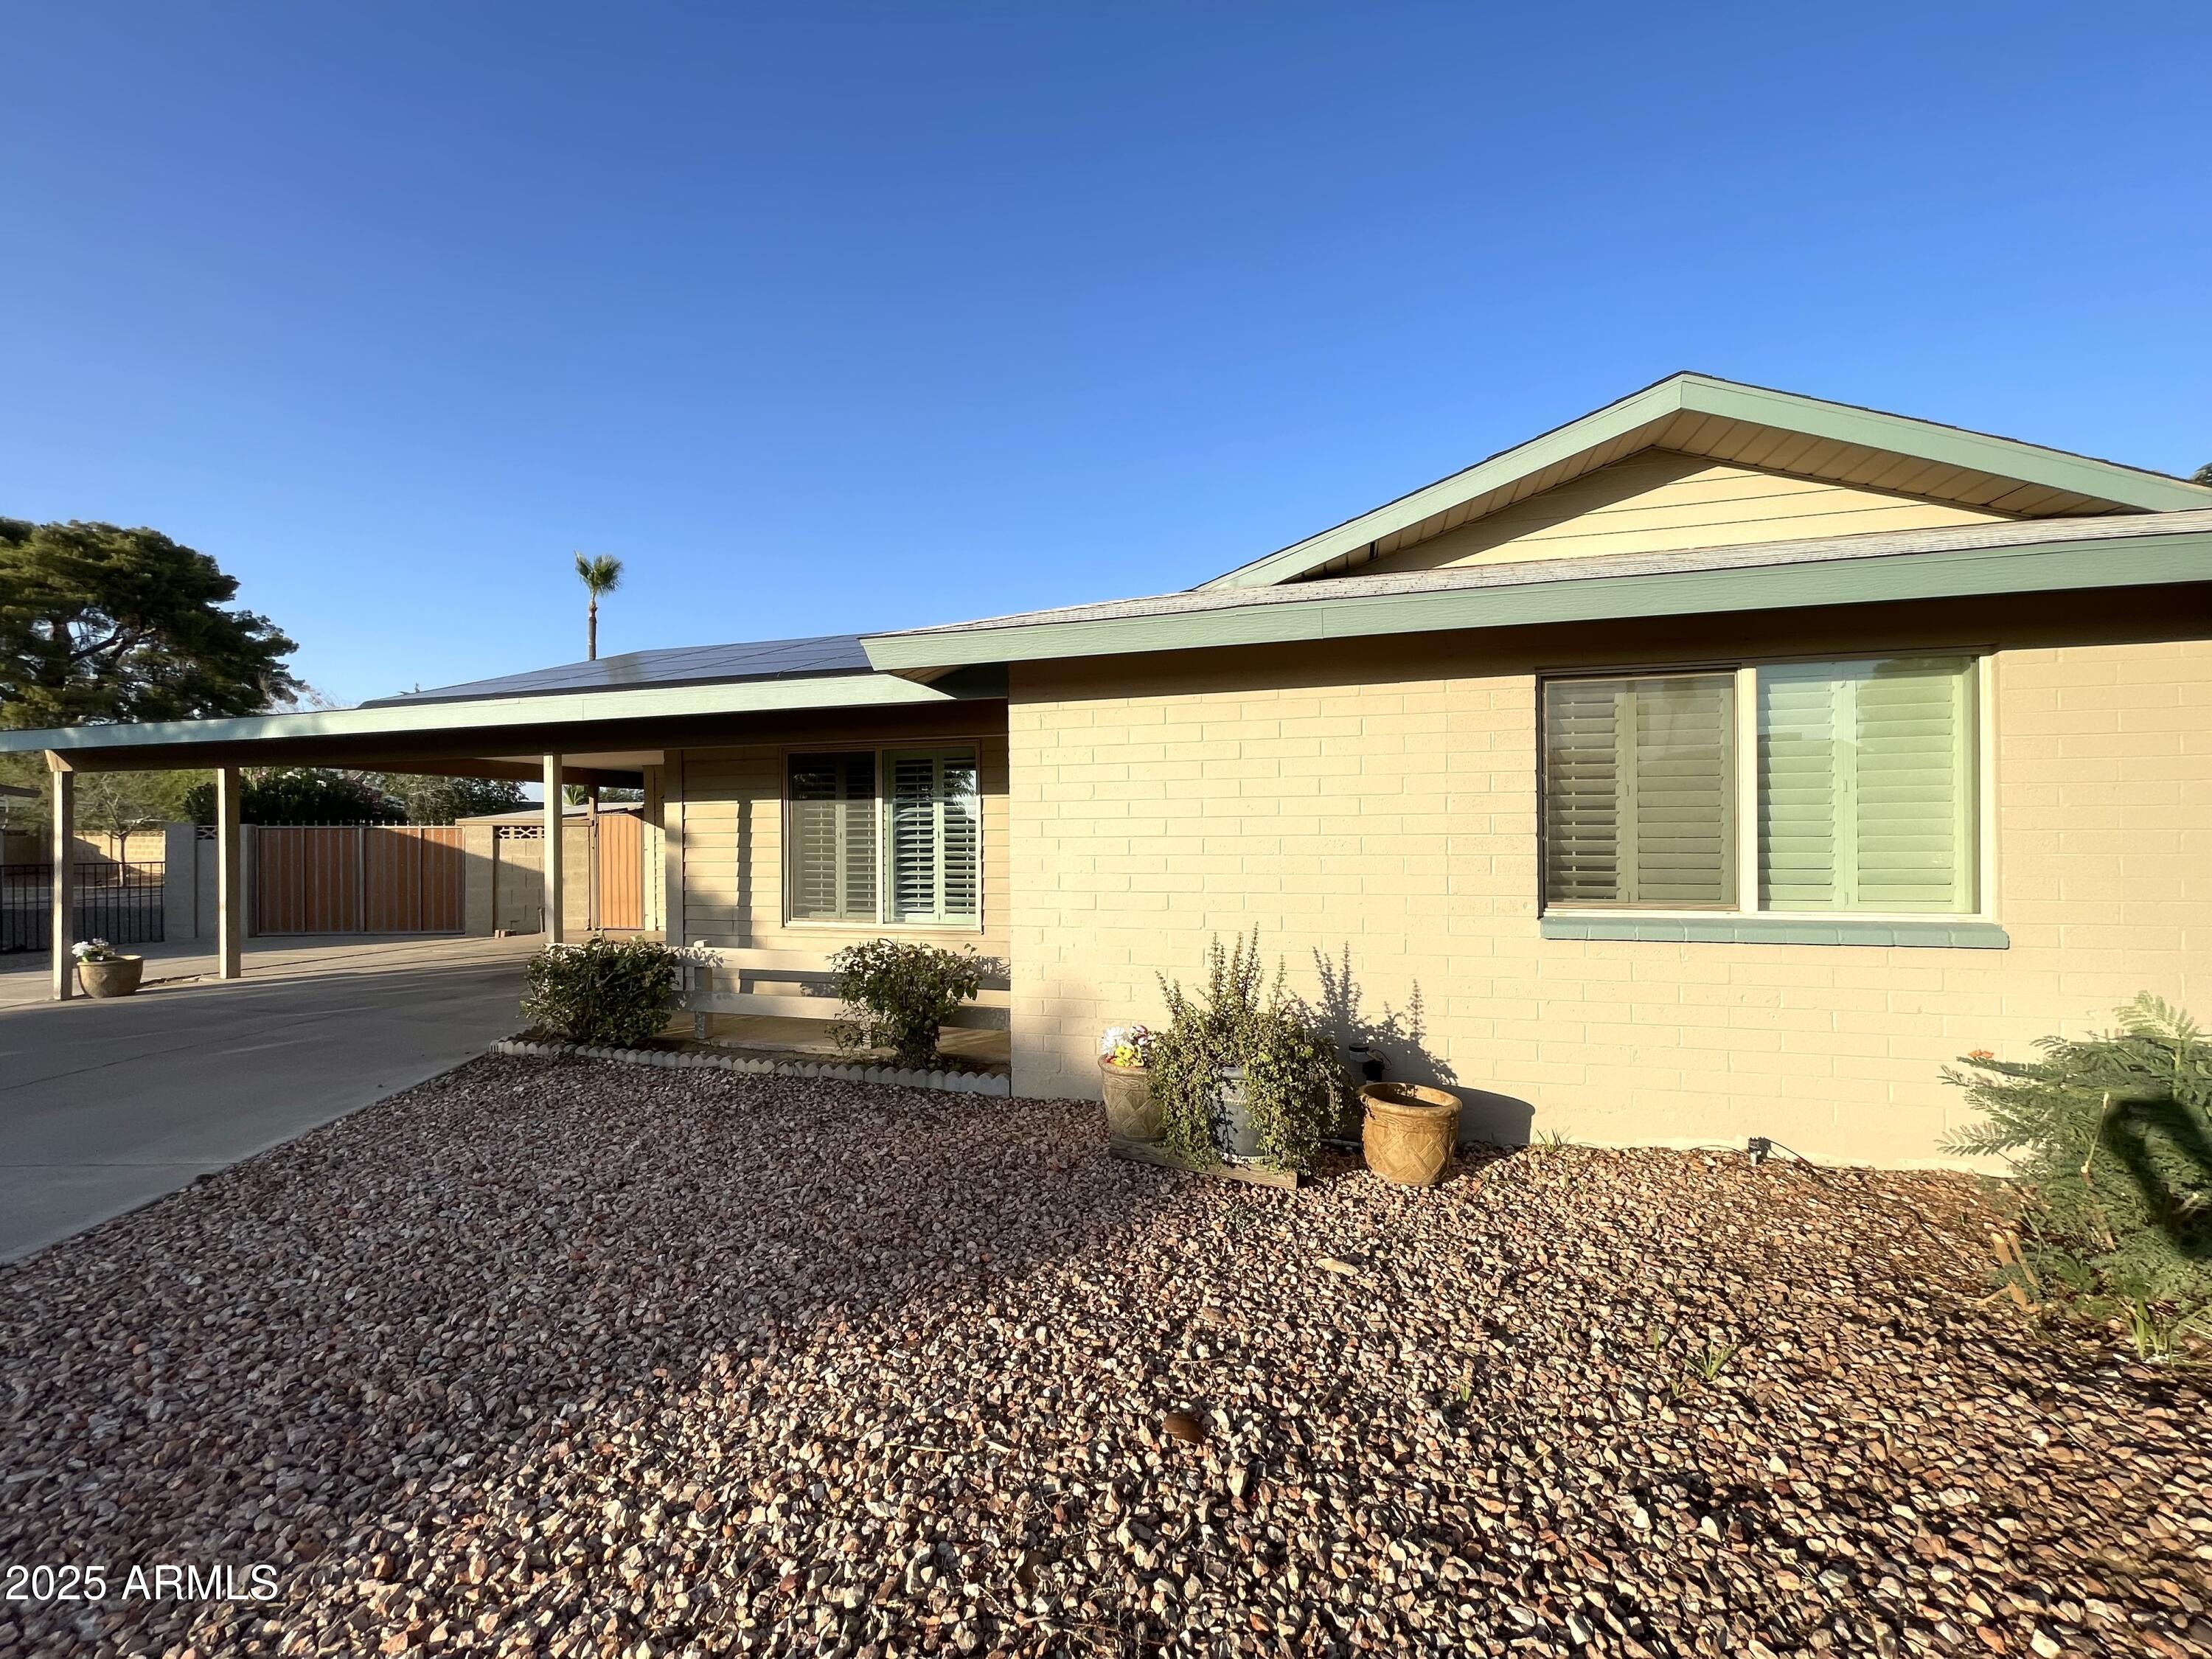
$419,999
4
bds
|
2
ba
|
1,777
sqft
|
built
1970
9615 N 34th Ave, Phoenix, AZ 85051
$-296
Cash flow
-3.7%
Cash-on-Cash Return
4.8%
Cap rate
0.6%
Rent to Value Ratio
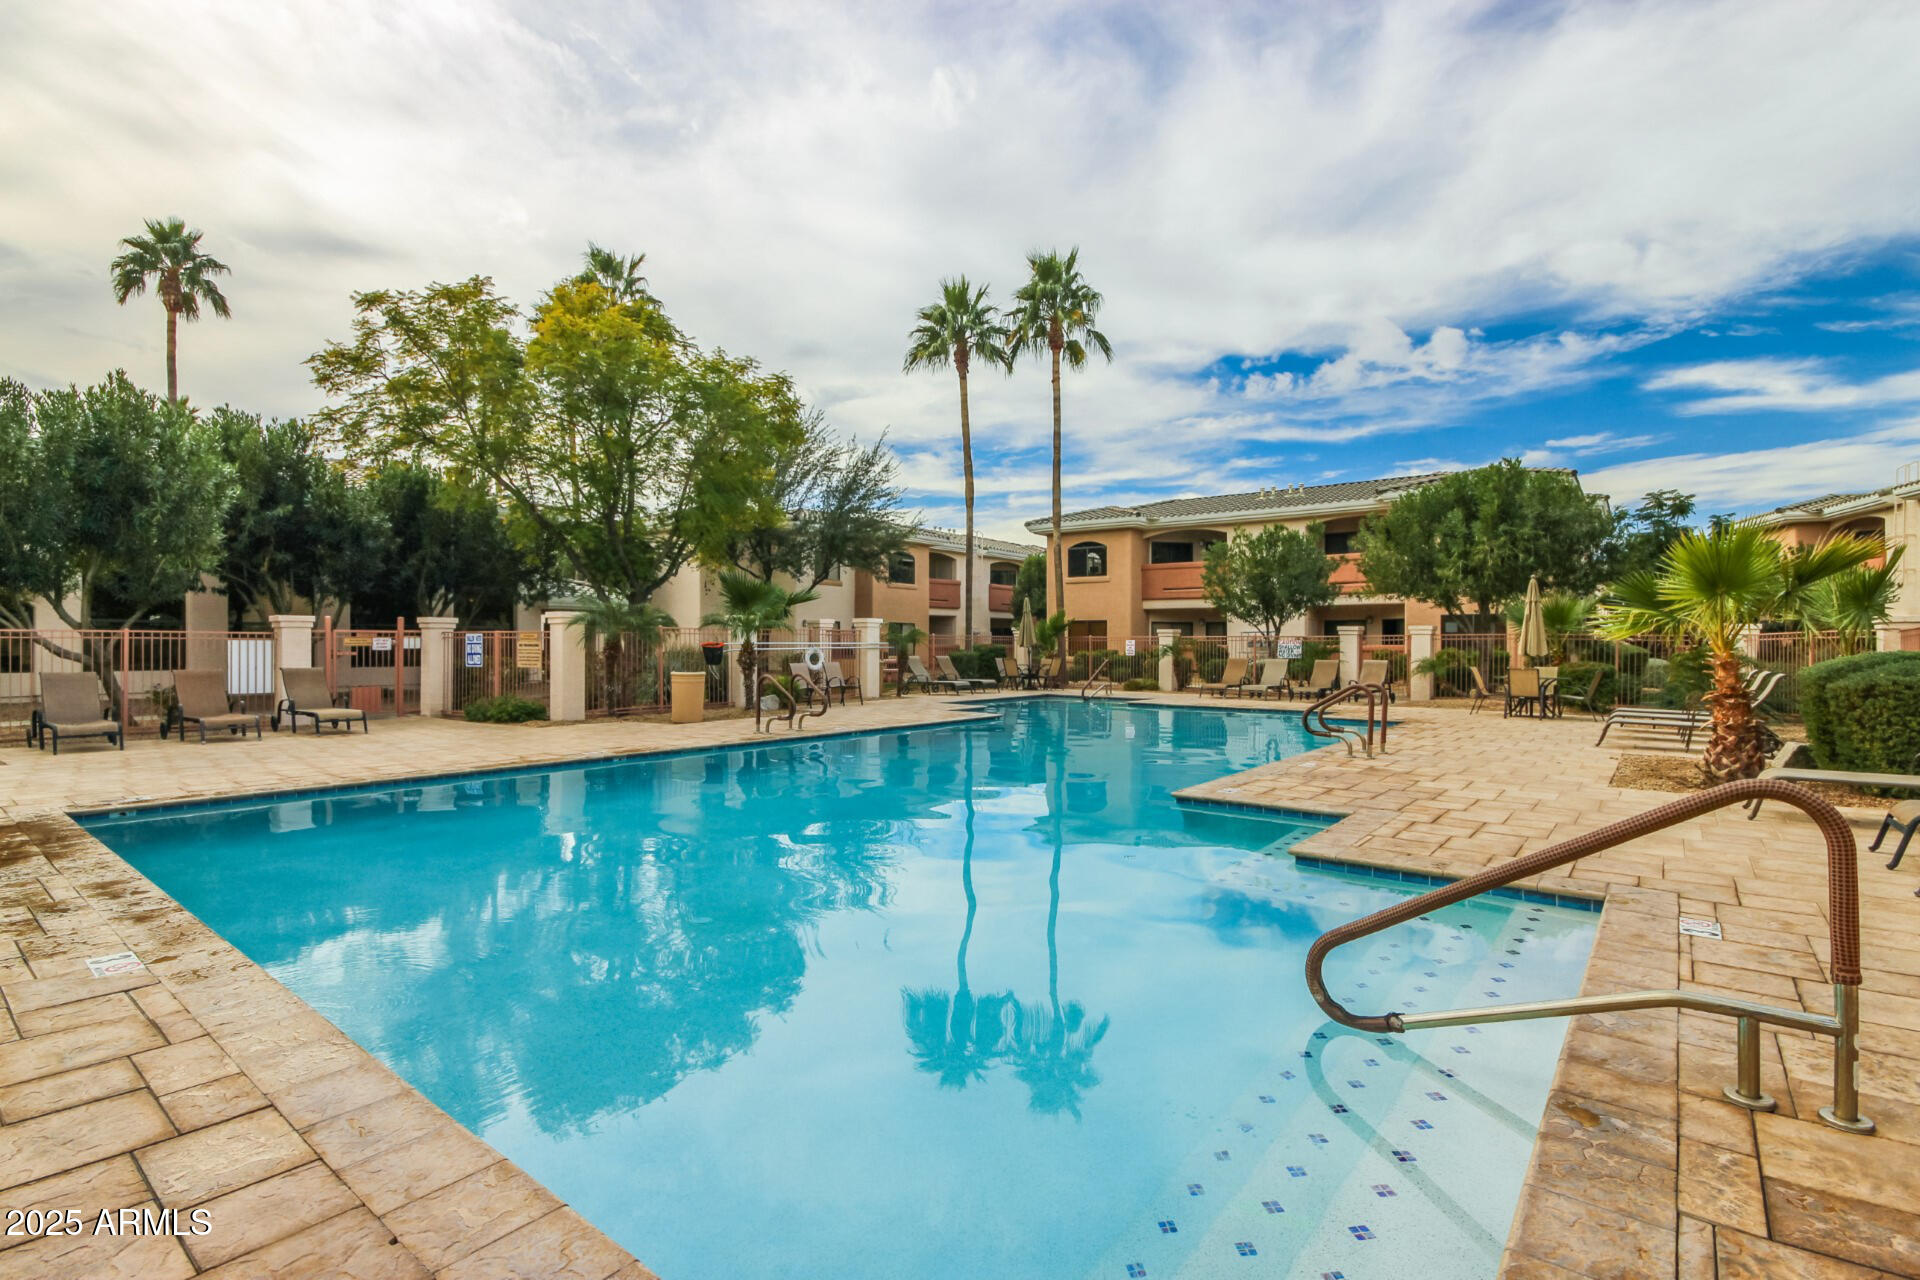
Pending
$260,000
2
bds
|
2
ba
|
1,037
sqft
|
built
1999
10030 W Indian School Rd, Phoenix, AZ 85037
$-395
Cash flow
-7.9%
Cash-on-Cash Return
3.9%
Cap rate
0.7%
Rent to Value Ratio
3,550 out of 3,823 properties for sale in Phoenix, AZ
Limited Results Shown
Create a free account, or log in to reveal all property listings and enjoy the complete experience.
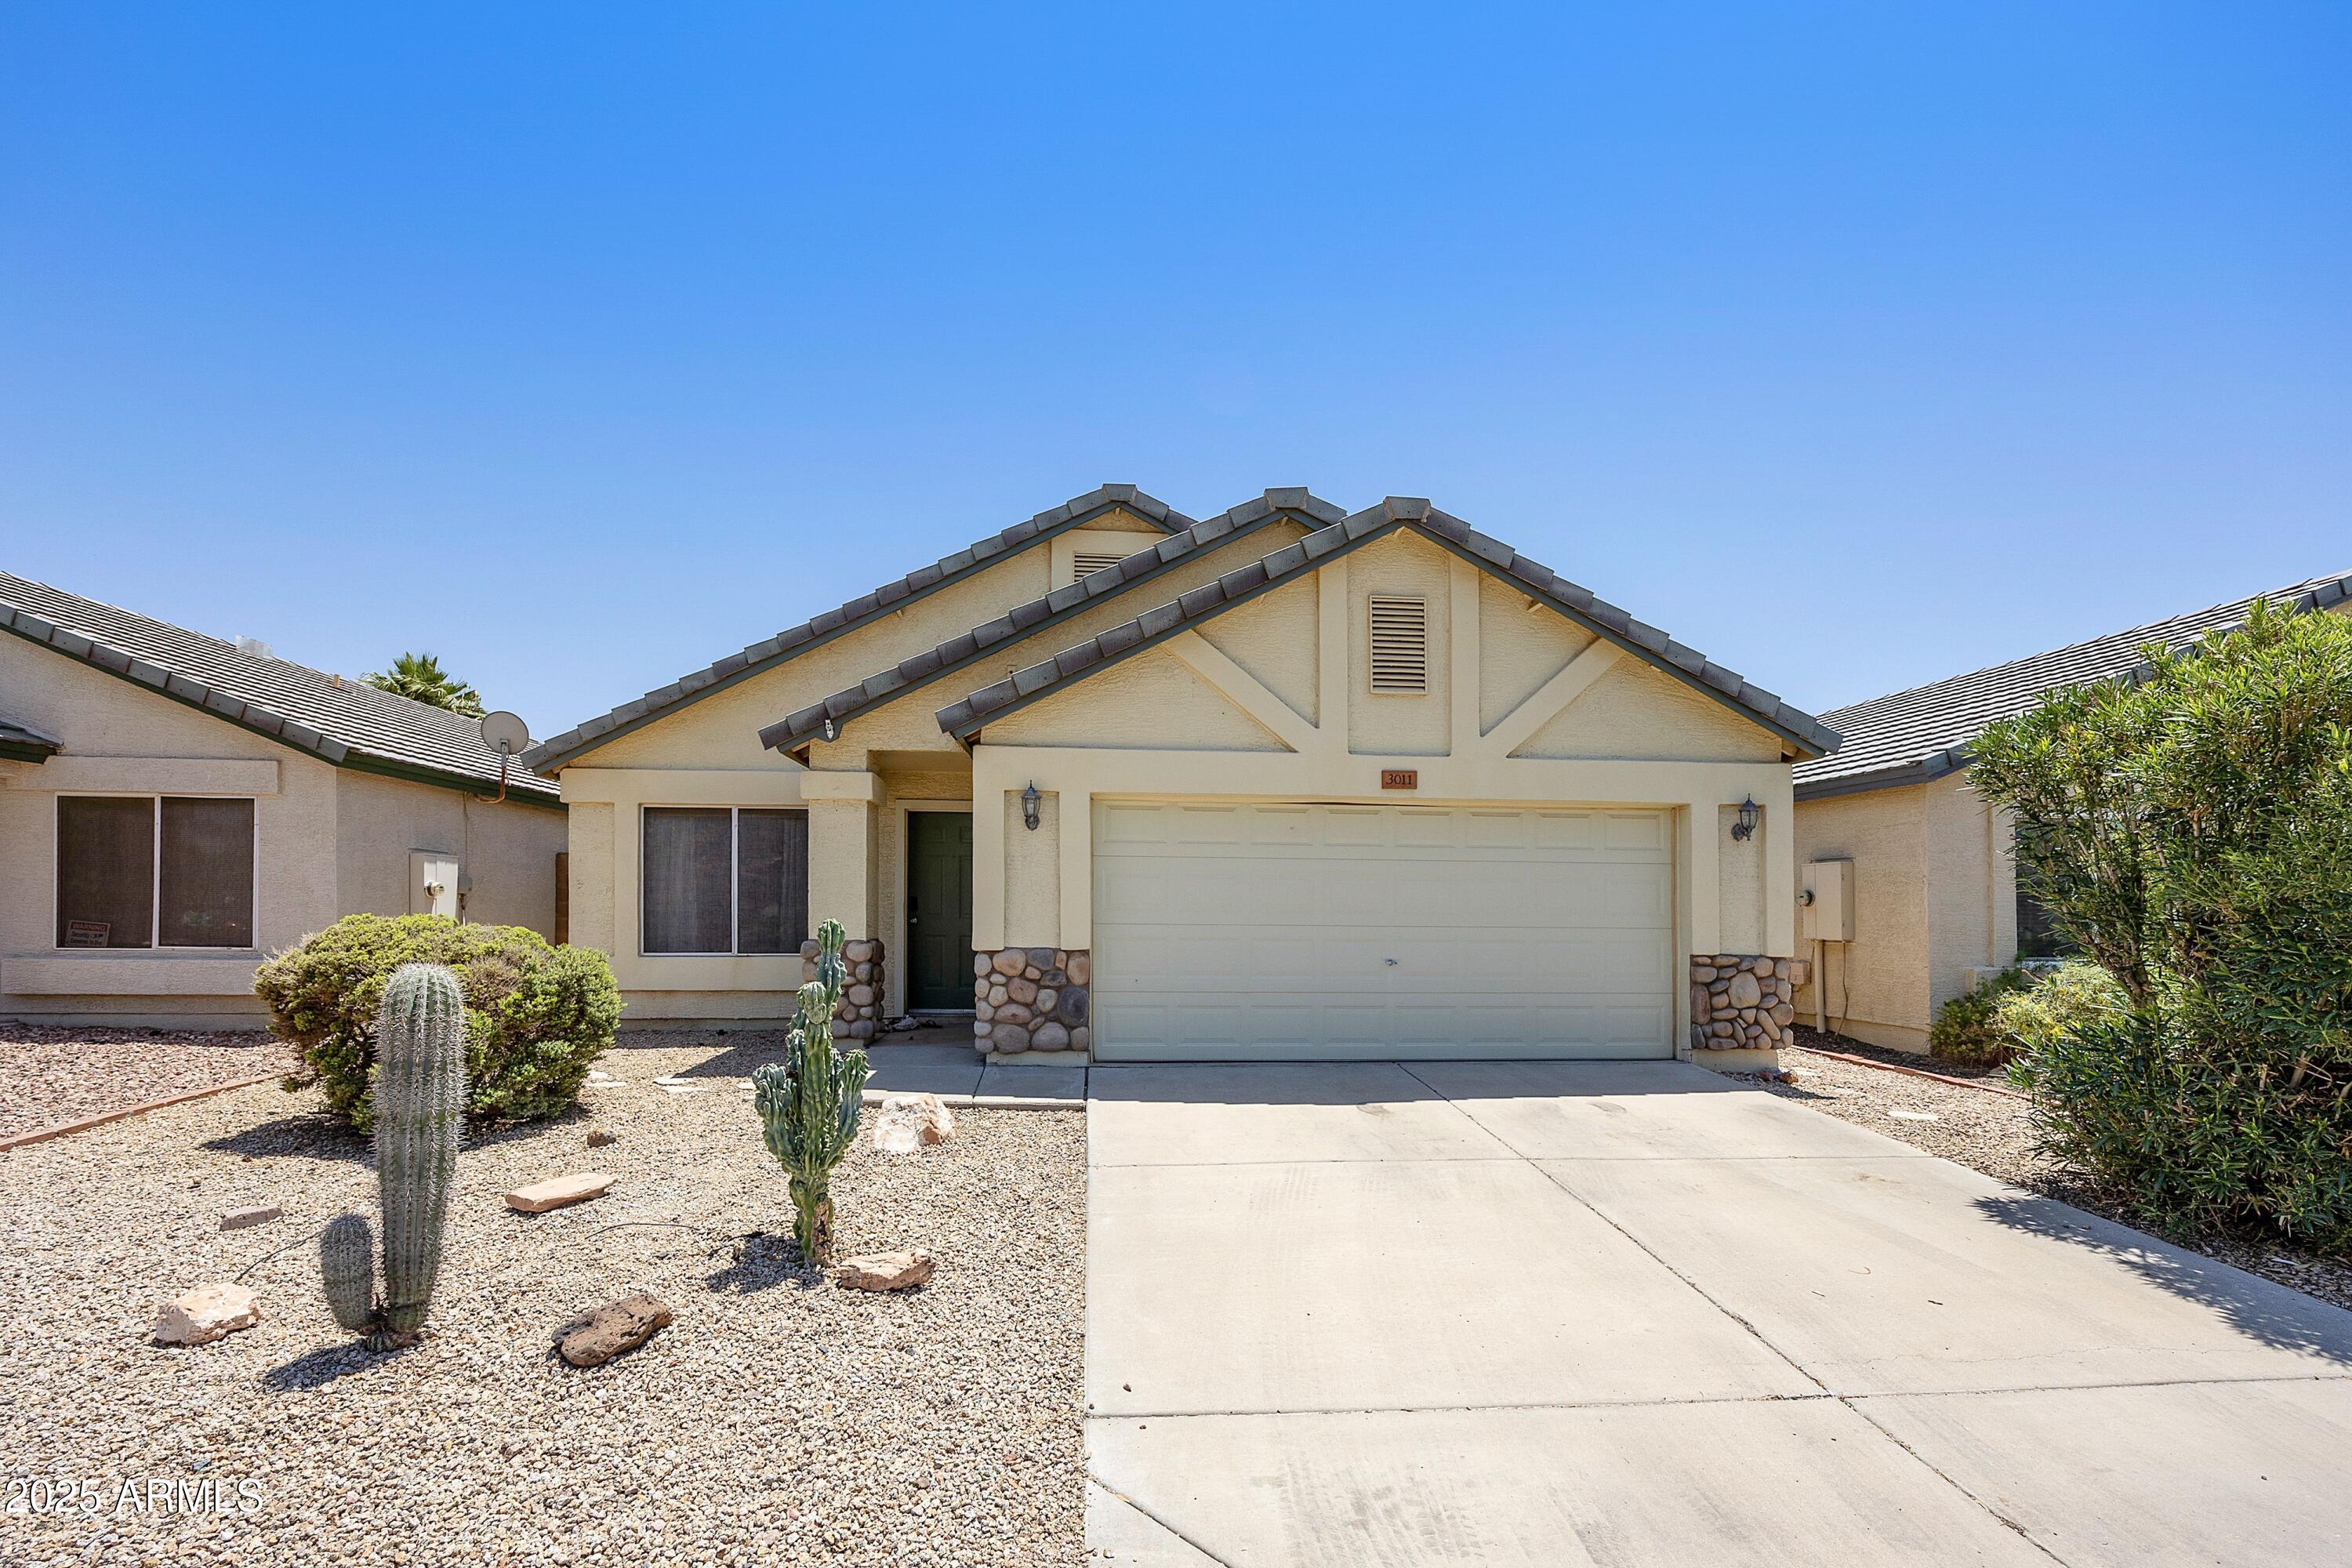
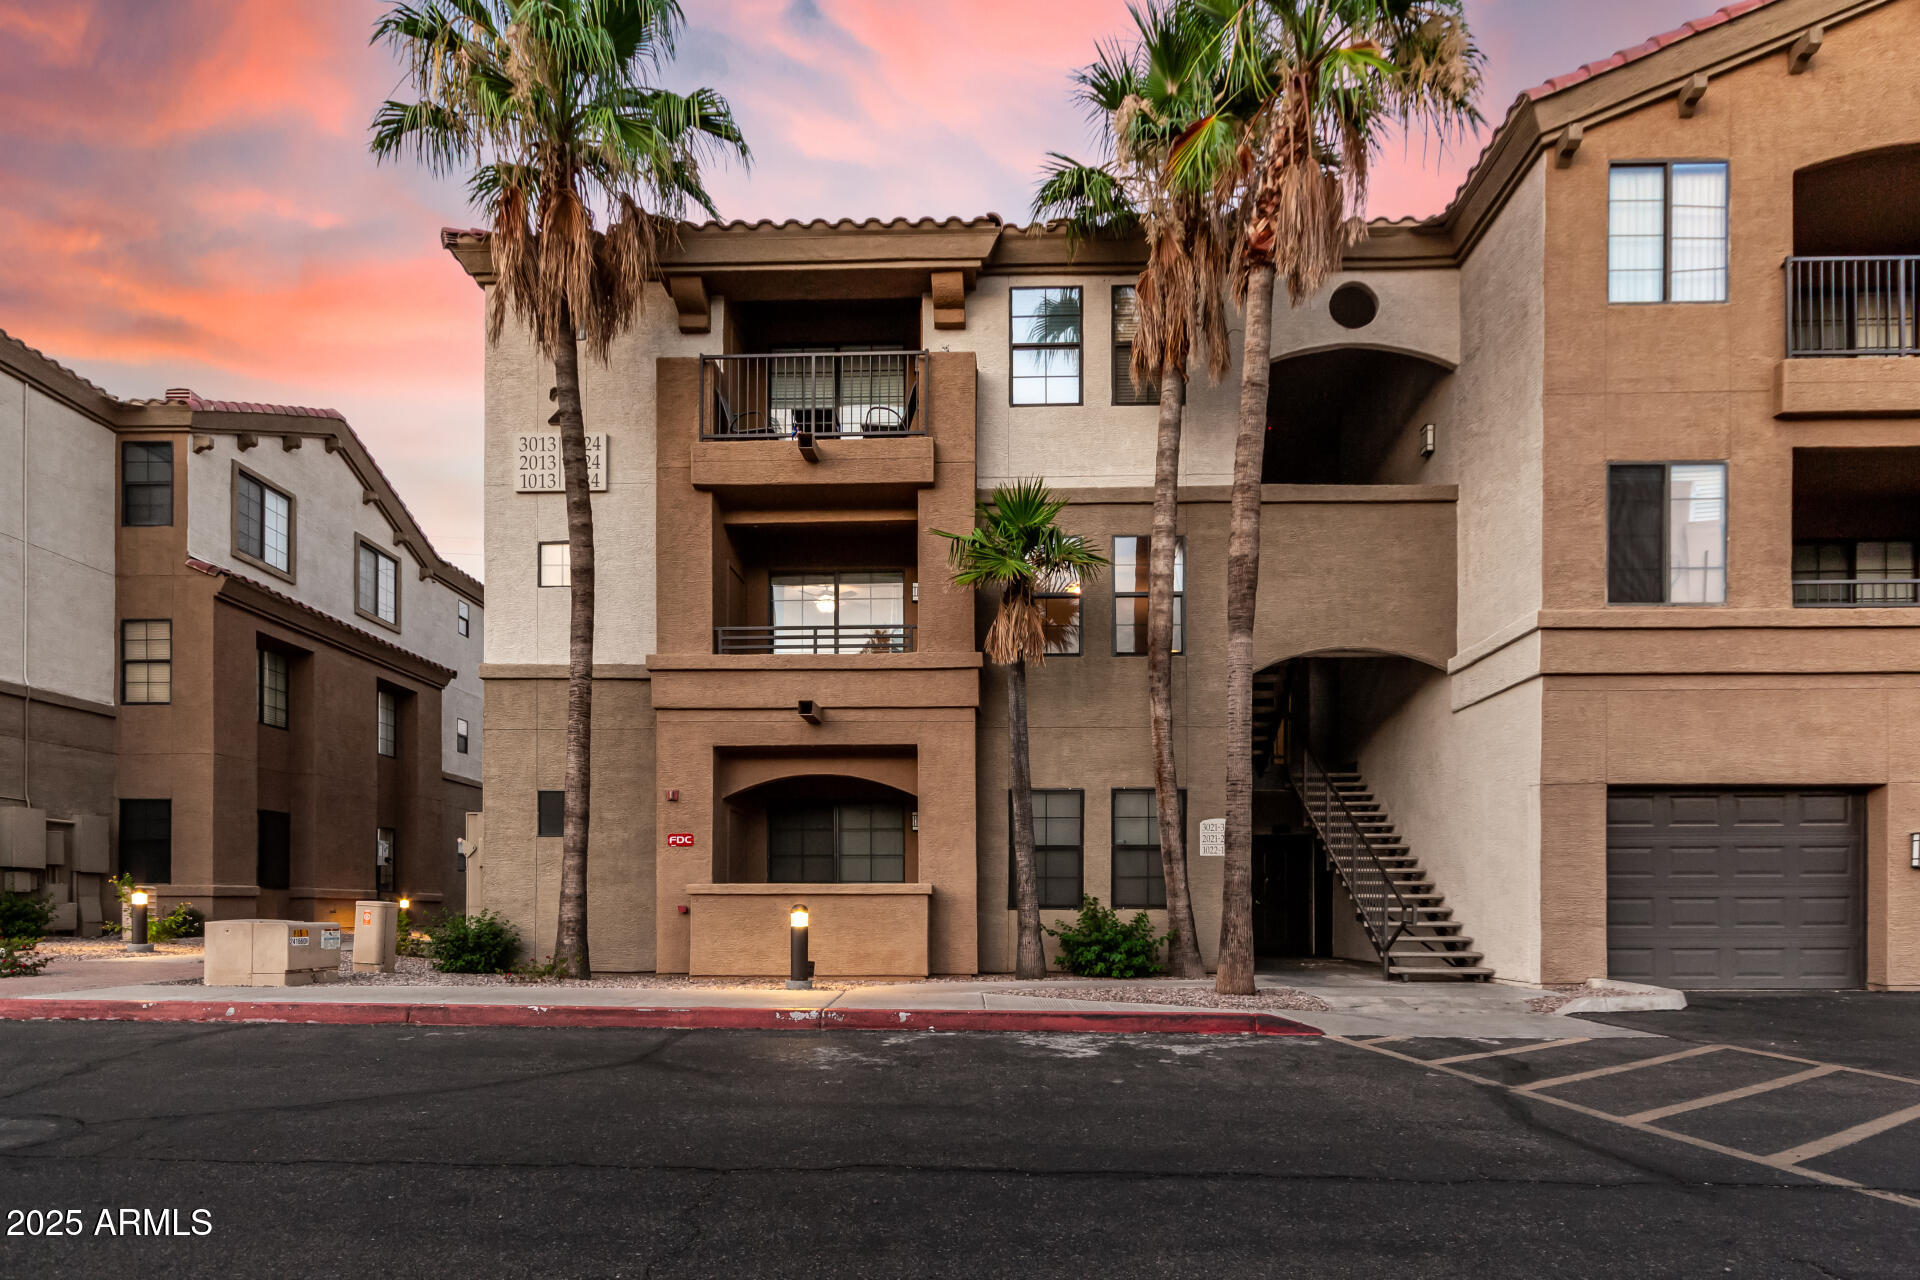
Active under contract
$409,900
3
bds
|
2
ba
|
1,324
sqft
|
built
1997
3011 W Salter Dr, Phoenix, AZ 85027
$-680
Cash flow
-8.7%
Cash-on-Cash Return
3.7%
Cap rate
0.5%
Rent to Value Ratio
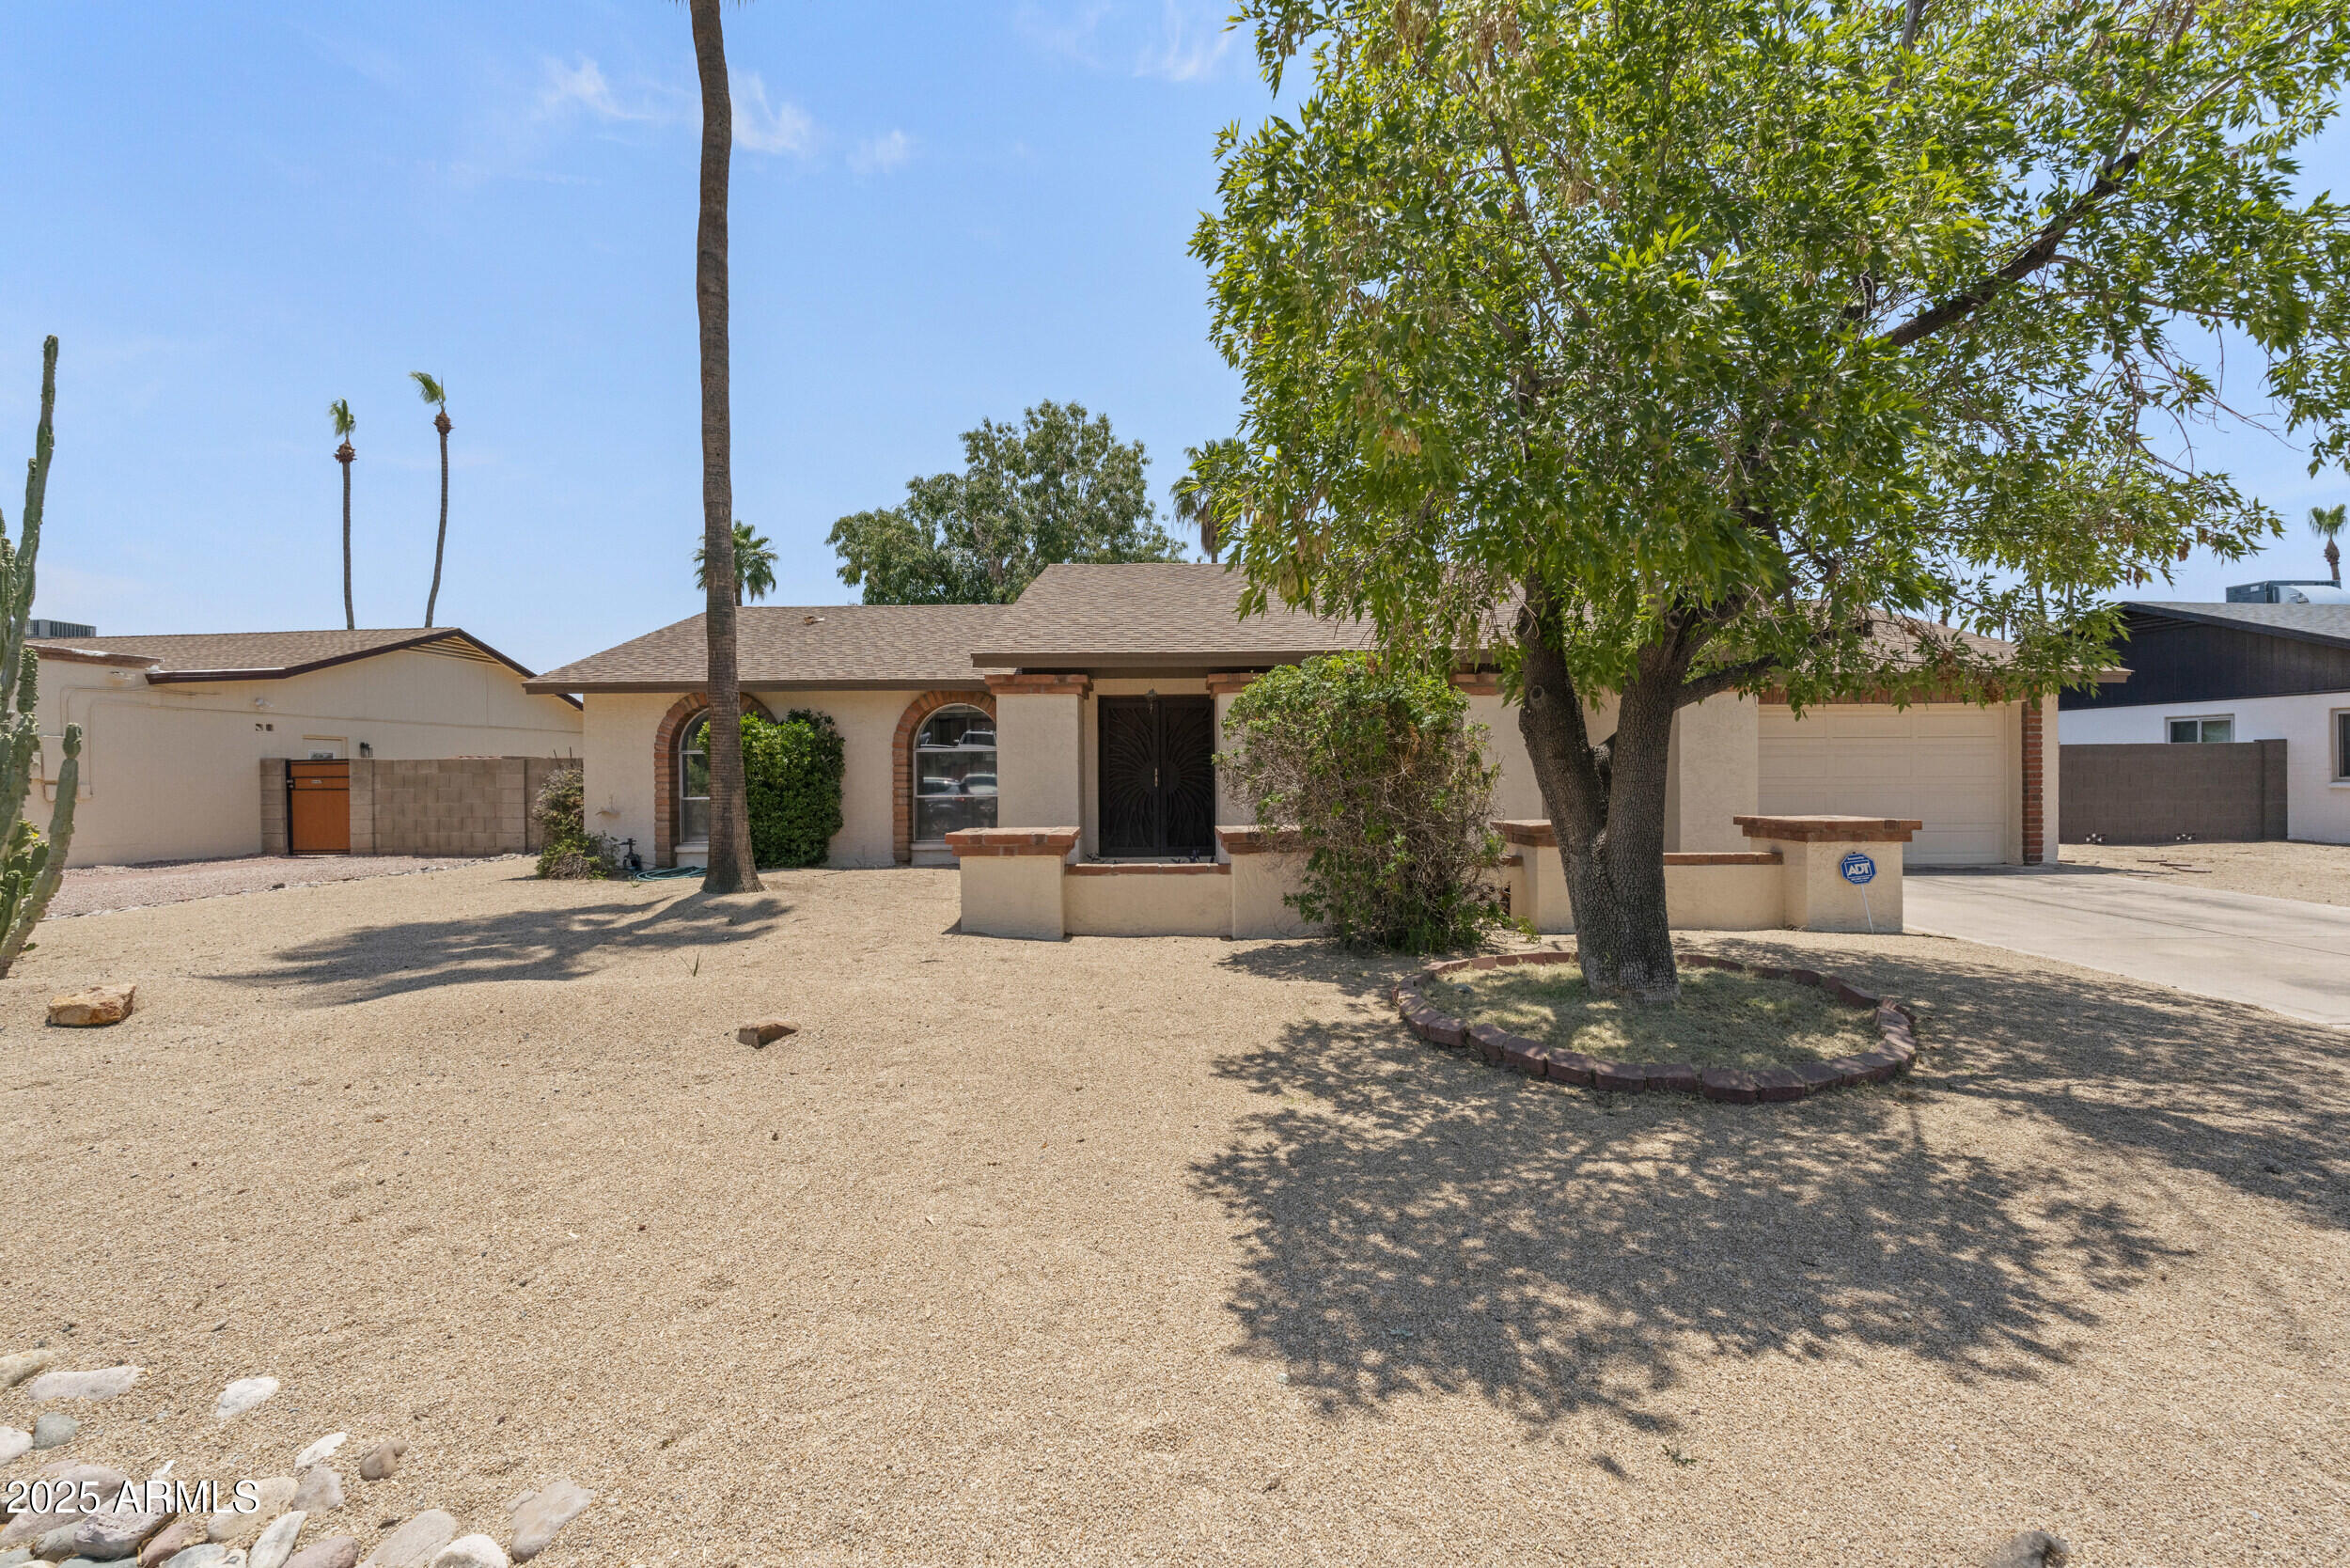
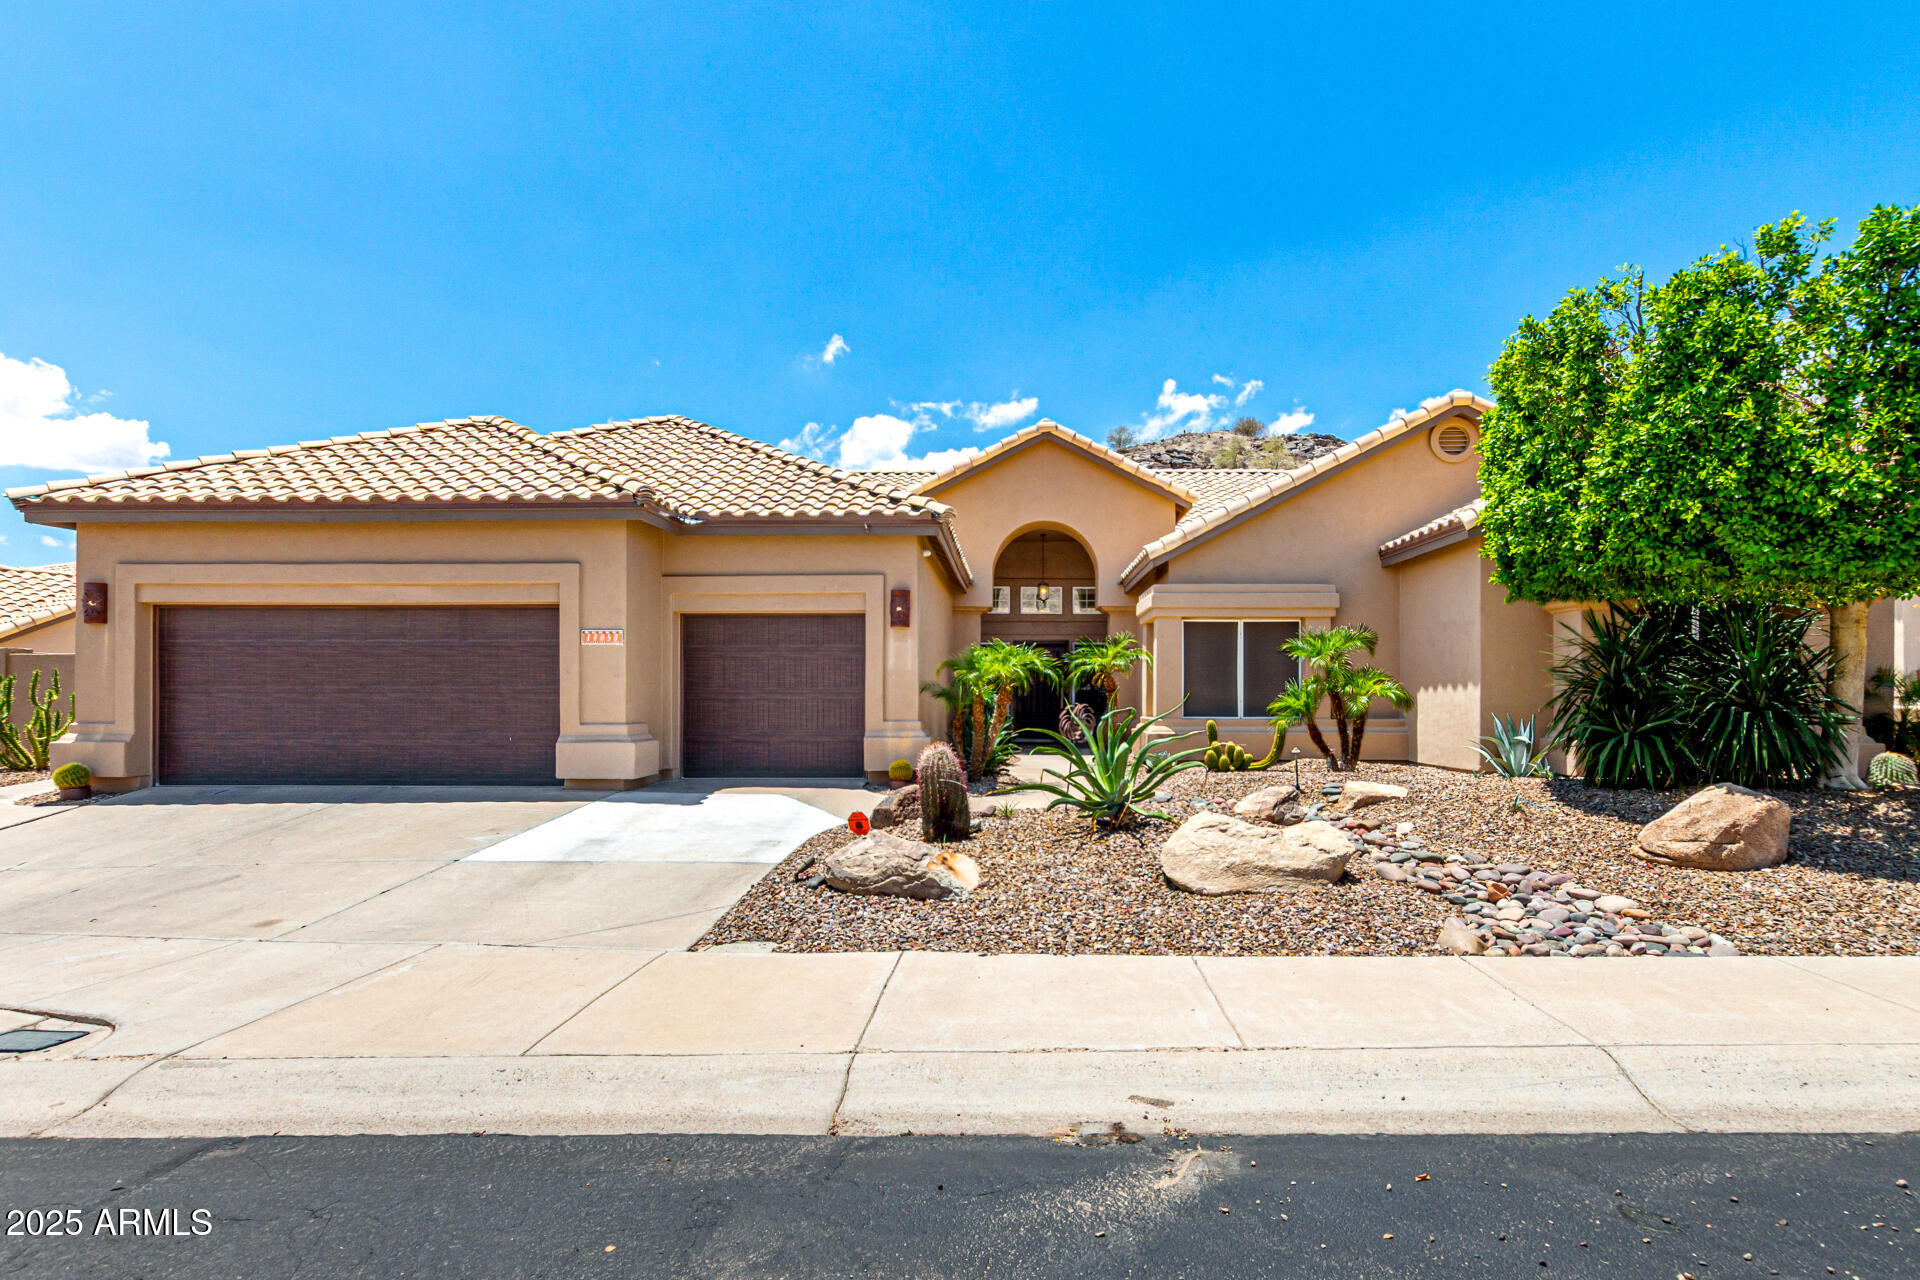
Pending
$550,000
3
bds
|
2
ba
|
1,865
sqft
|
built
1979
4535 E Redfield Rd, Phoenix, AZ 85032
$-829
Cash flow
-7.9%
Cash-on-Cash Return
3.9%
Cap rate
0.5%
Rent to Value Ratio
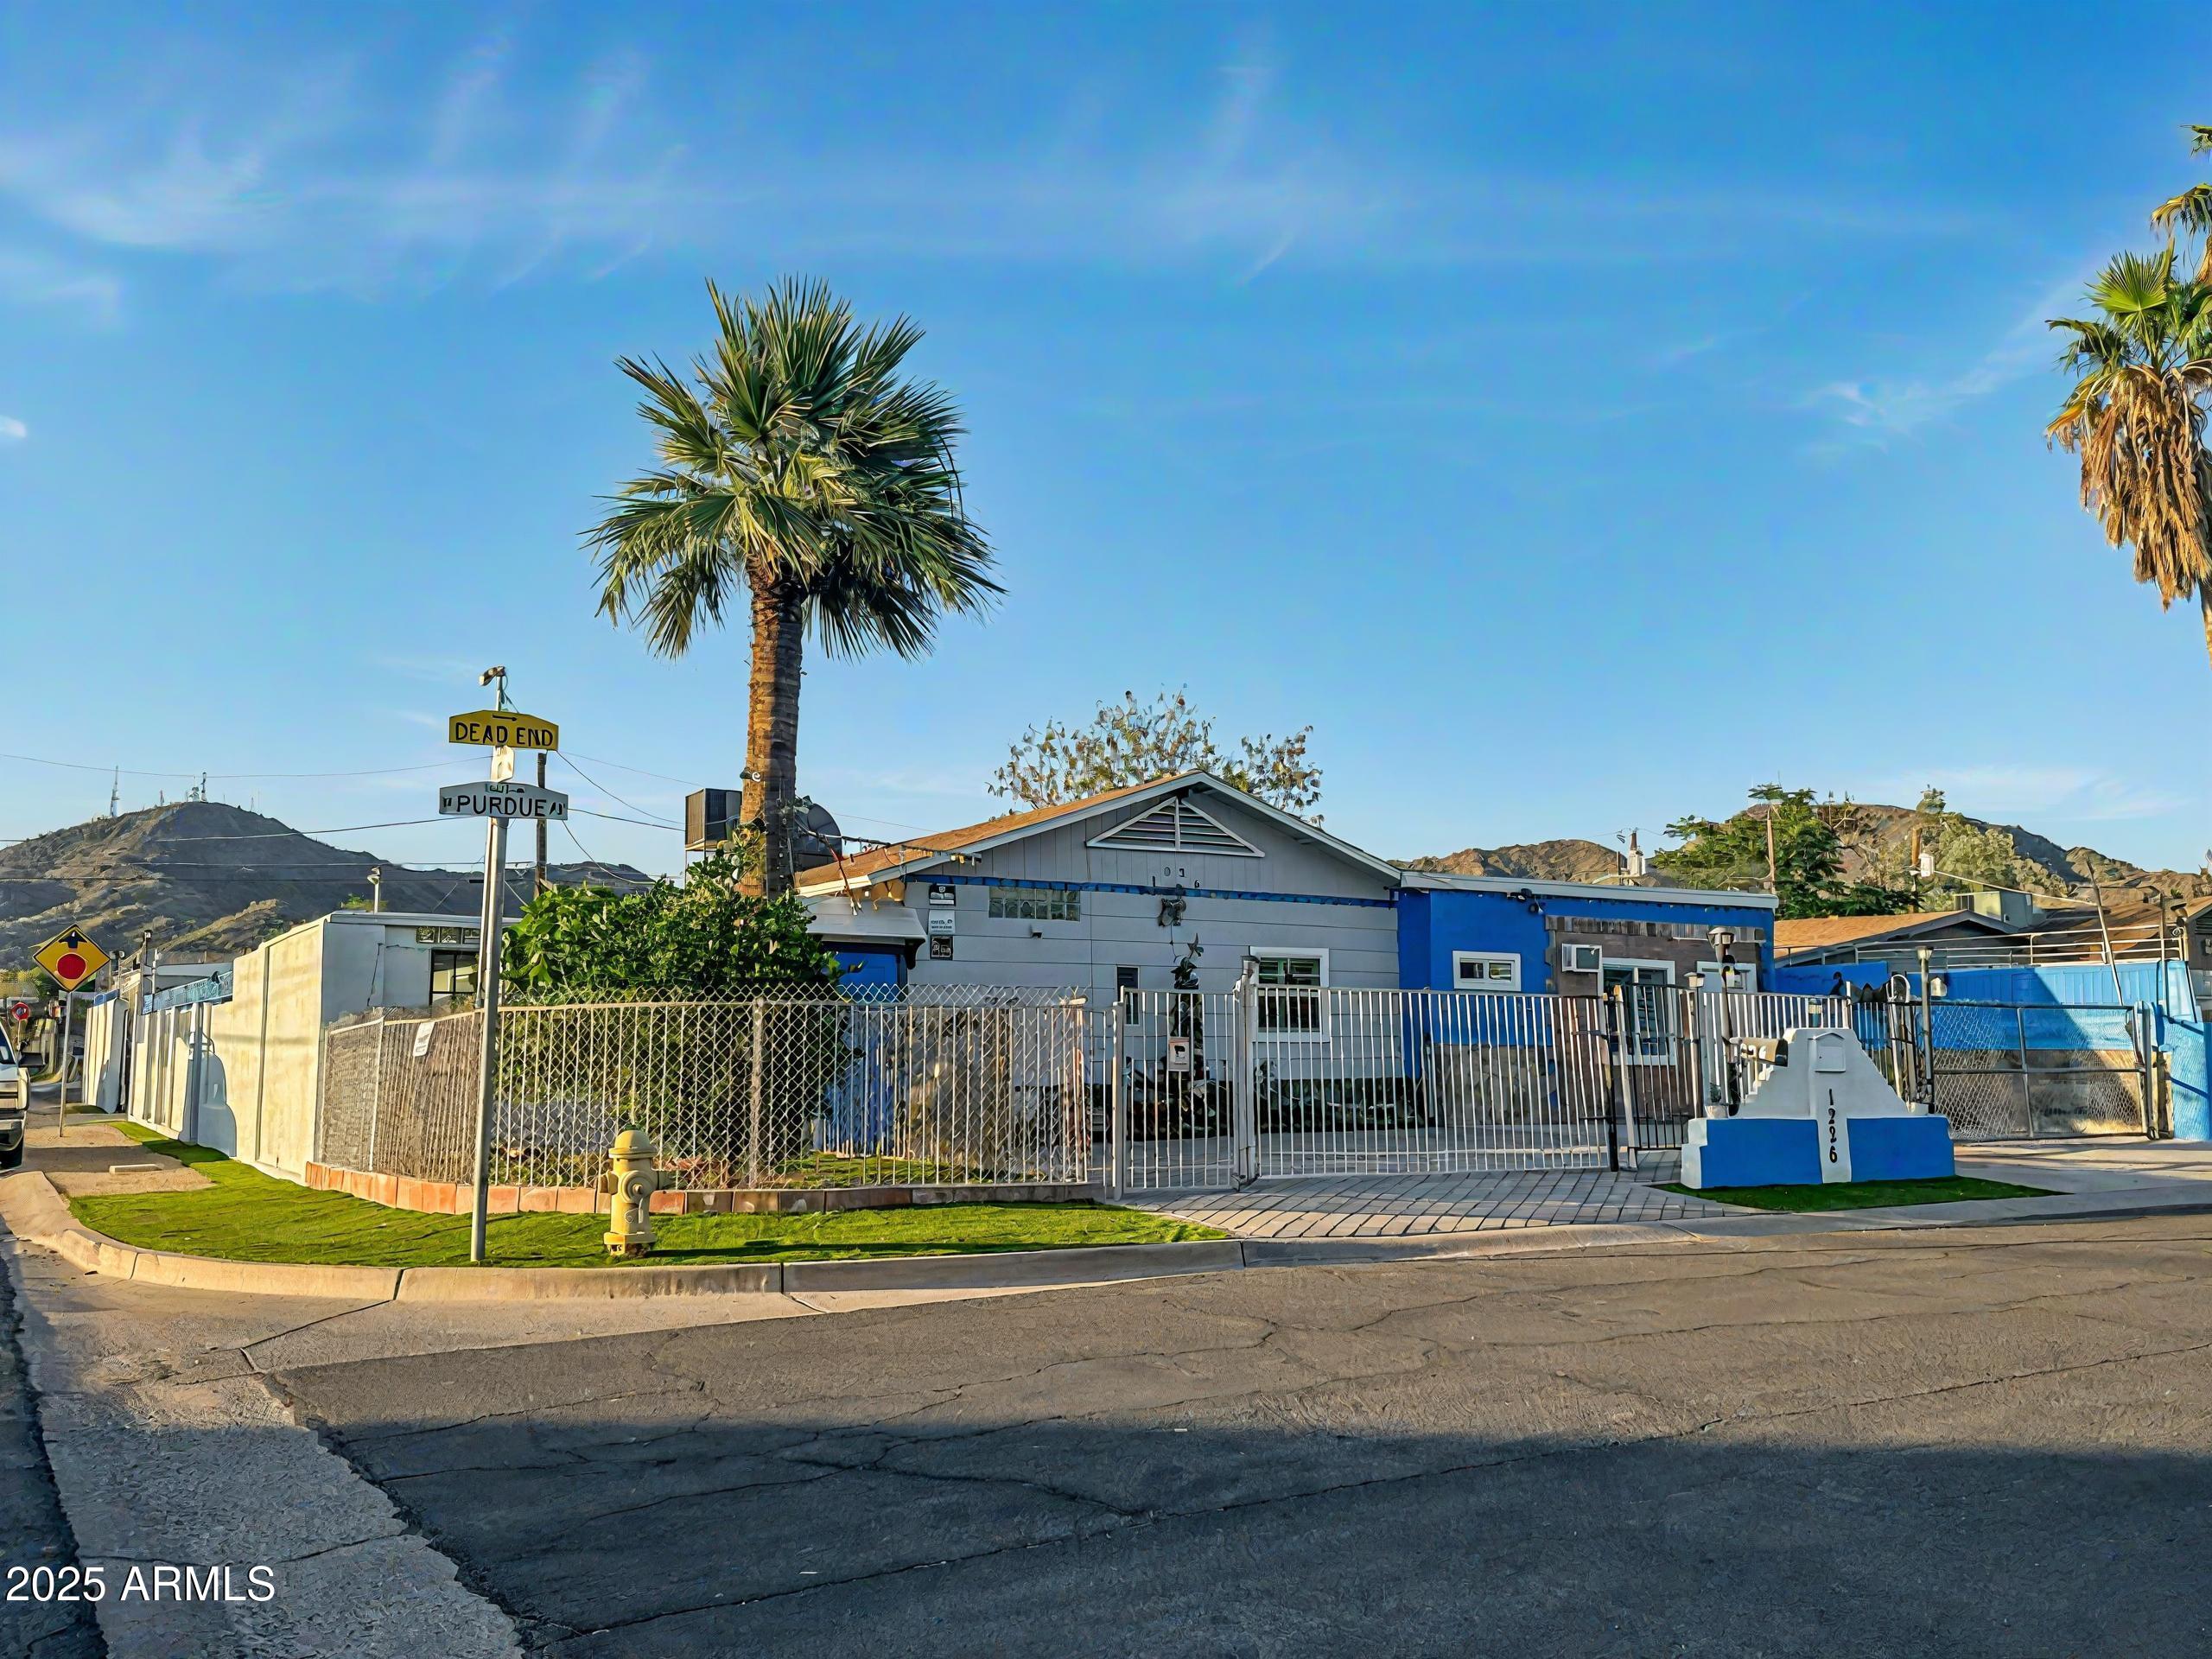
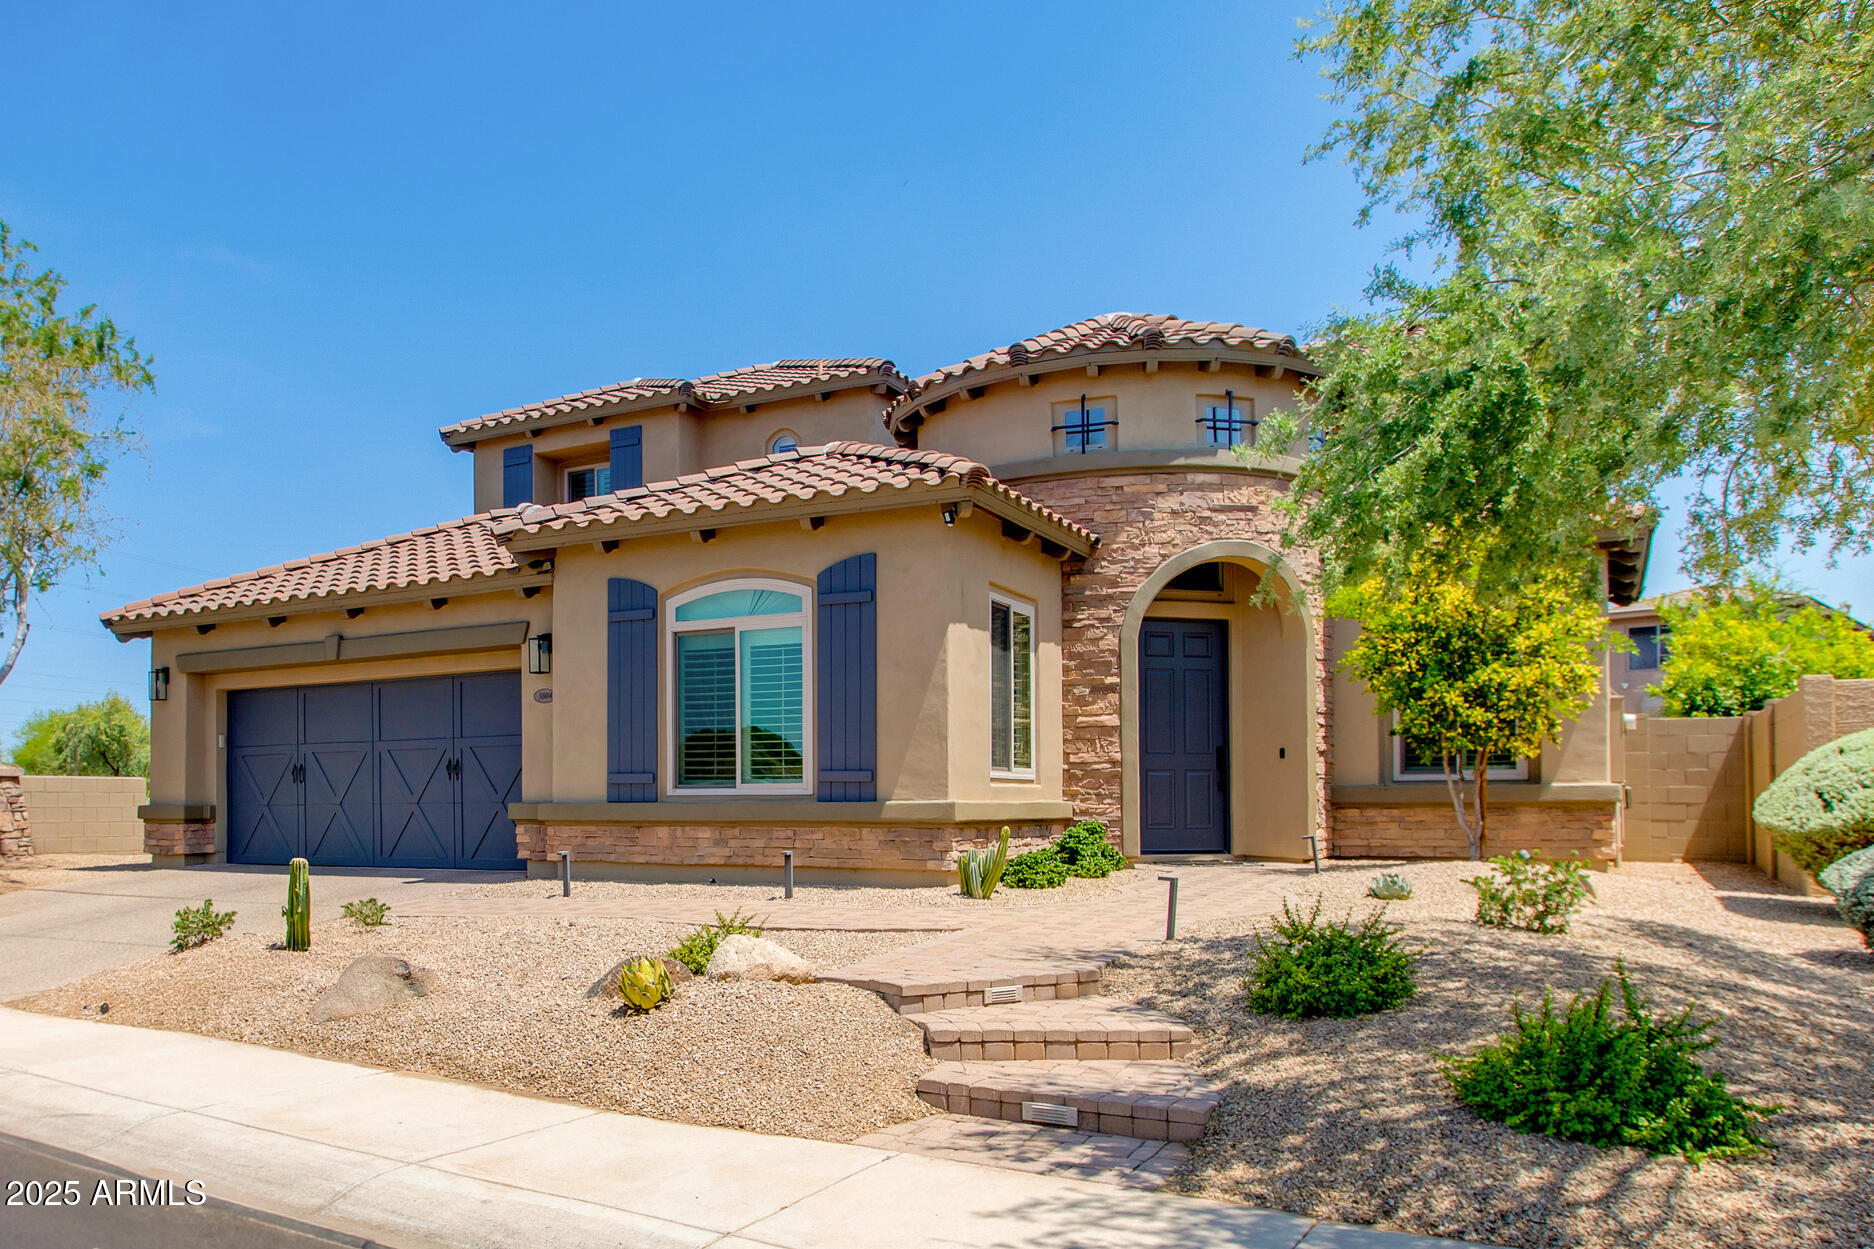
Active
$380,000
6
bds
|
6
ba
|
2,700
sqft
|
built
2003
1226 W Purdue Ave, Phoenix, AZ 85021
$-773
Cash flow
-10.6%
Cash-on-Cash Return
3.2%
Cap rate
0.4%
Rent to Value Ratio
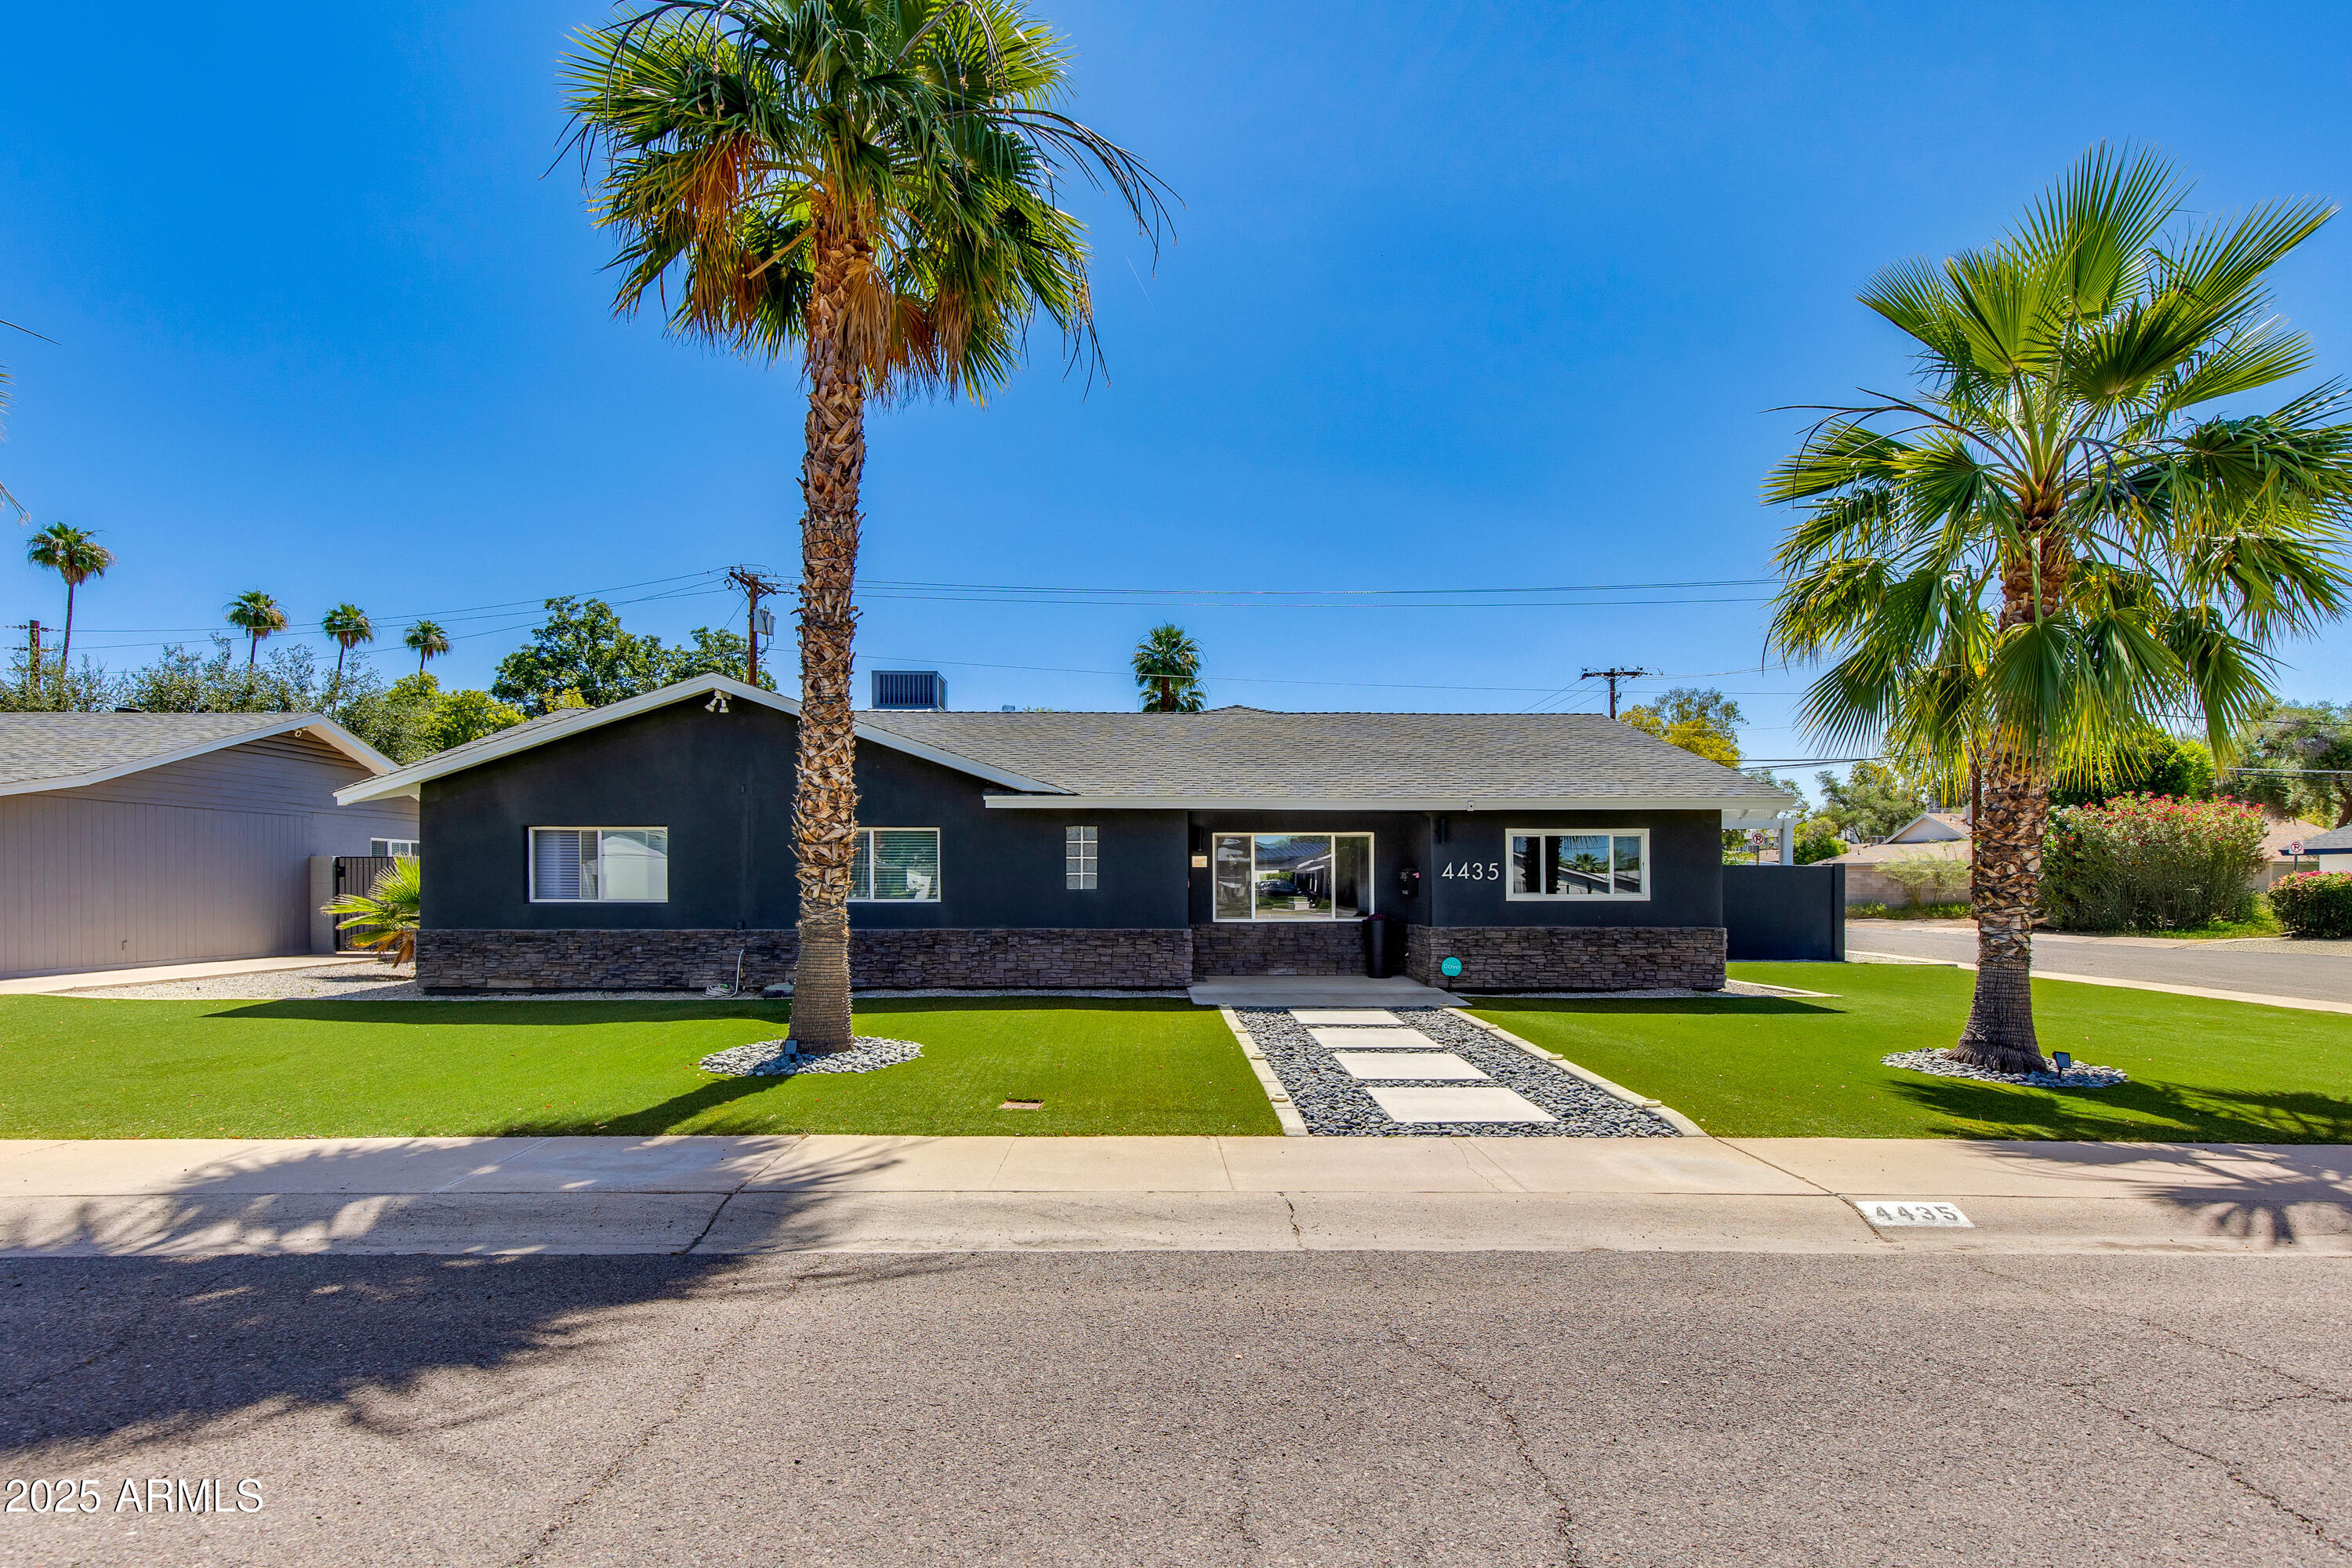
Active
$1,149,000
3
bds
|
3
ba
|
2,334
sqft
|
built
1958
4435 N 35th St, Phoenix, AZ 85018
$-3,435
Cash flow
-15.6%
Cash-on-Cash Return
2.1%
Cap rate
0.3%
Rent to Value Ratio

Active
$540,000
3
bds
|
2
ba
|
1,440
sqft
|
built
1955
7607 N 17th Ave, Phoenix, AZ 85021
$-1,351
Cash flow
-13.1%
Cash-on-Cash Return
2.7%
Cap rate
0.4%
Rent to Value Ratio

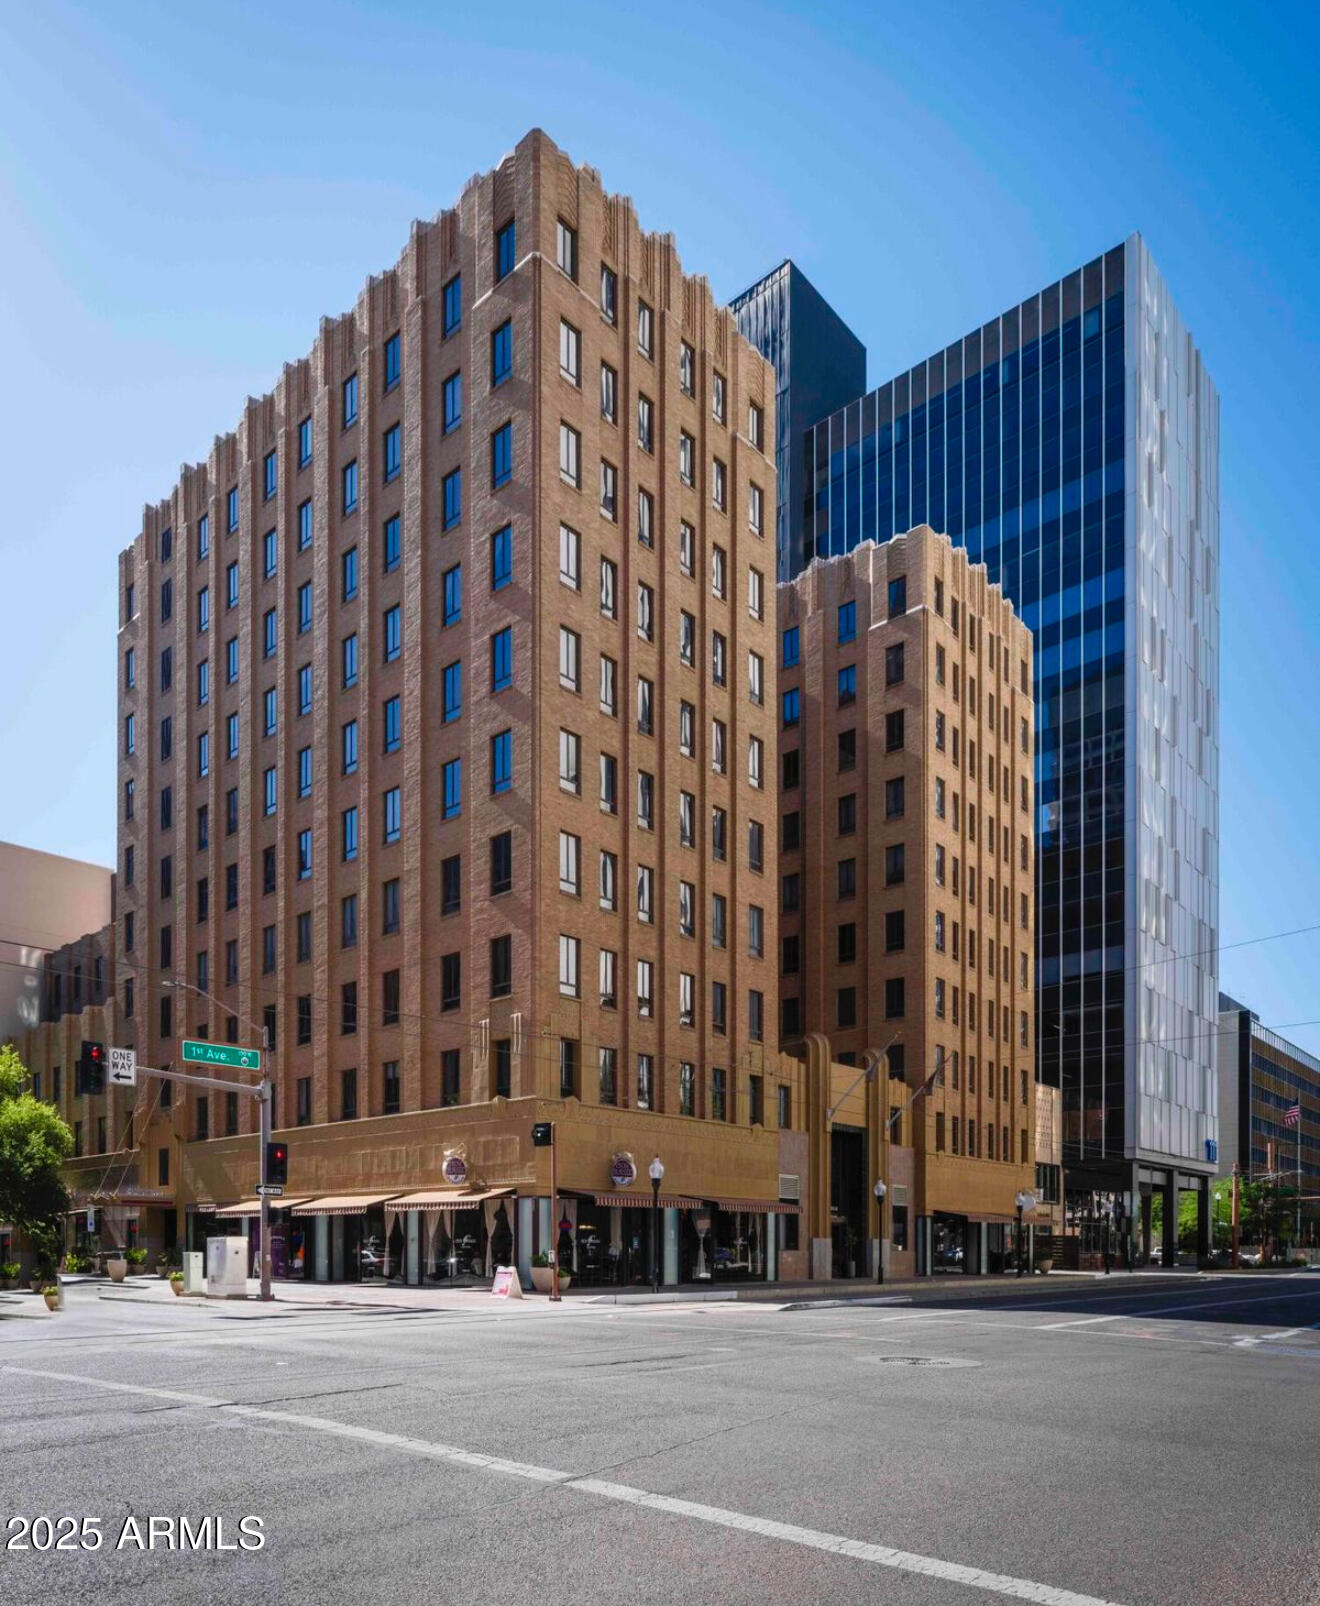
Active
$1,000,000
3
bds
|
2
ba
|
1,740
sqft
|
built
1926
530 W Willetta St, Phoenix, AZ 85003
$-2,800
Cash flow
-14.6%
Cash-on-Cash Return
2.3%
Cap rate
0.3%
Rent to Value Ratio

Active
$625,000
3
bds
|
2
ba
|
1,661
sqft
|
built
1997
4350 E Gatewood Dr, Phoenix, AZ 85050
$-1,340
Cash flow
-11.2%
Cash-on-Cash Return
3.1%
Cap rate
0.4%
Rent to Value Ratio

Active
$495,000
2
bds
|
1
ba
|
981
sqft
|
built
1949
1117 W Glenrosa Ave, Phoenix, AZ 85013
$-1,177
Cash flow
-12.4%
Cash-on-Cash Return
2.8%
Cap rate
0.4%
Rent to Value Ratio
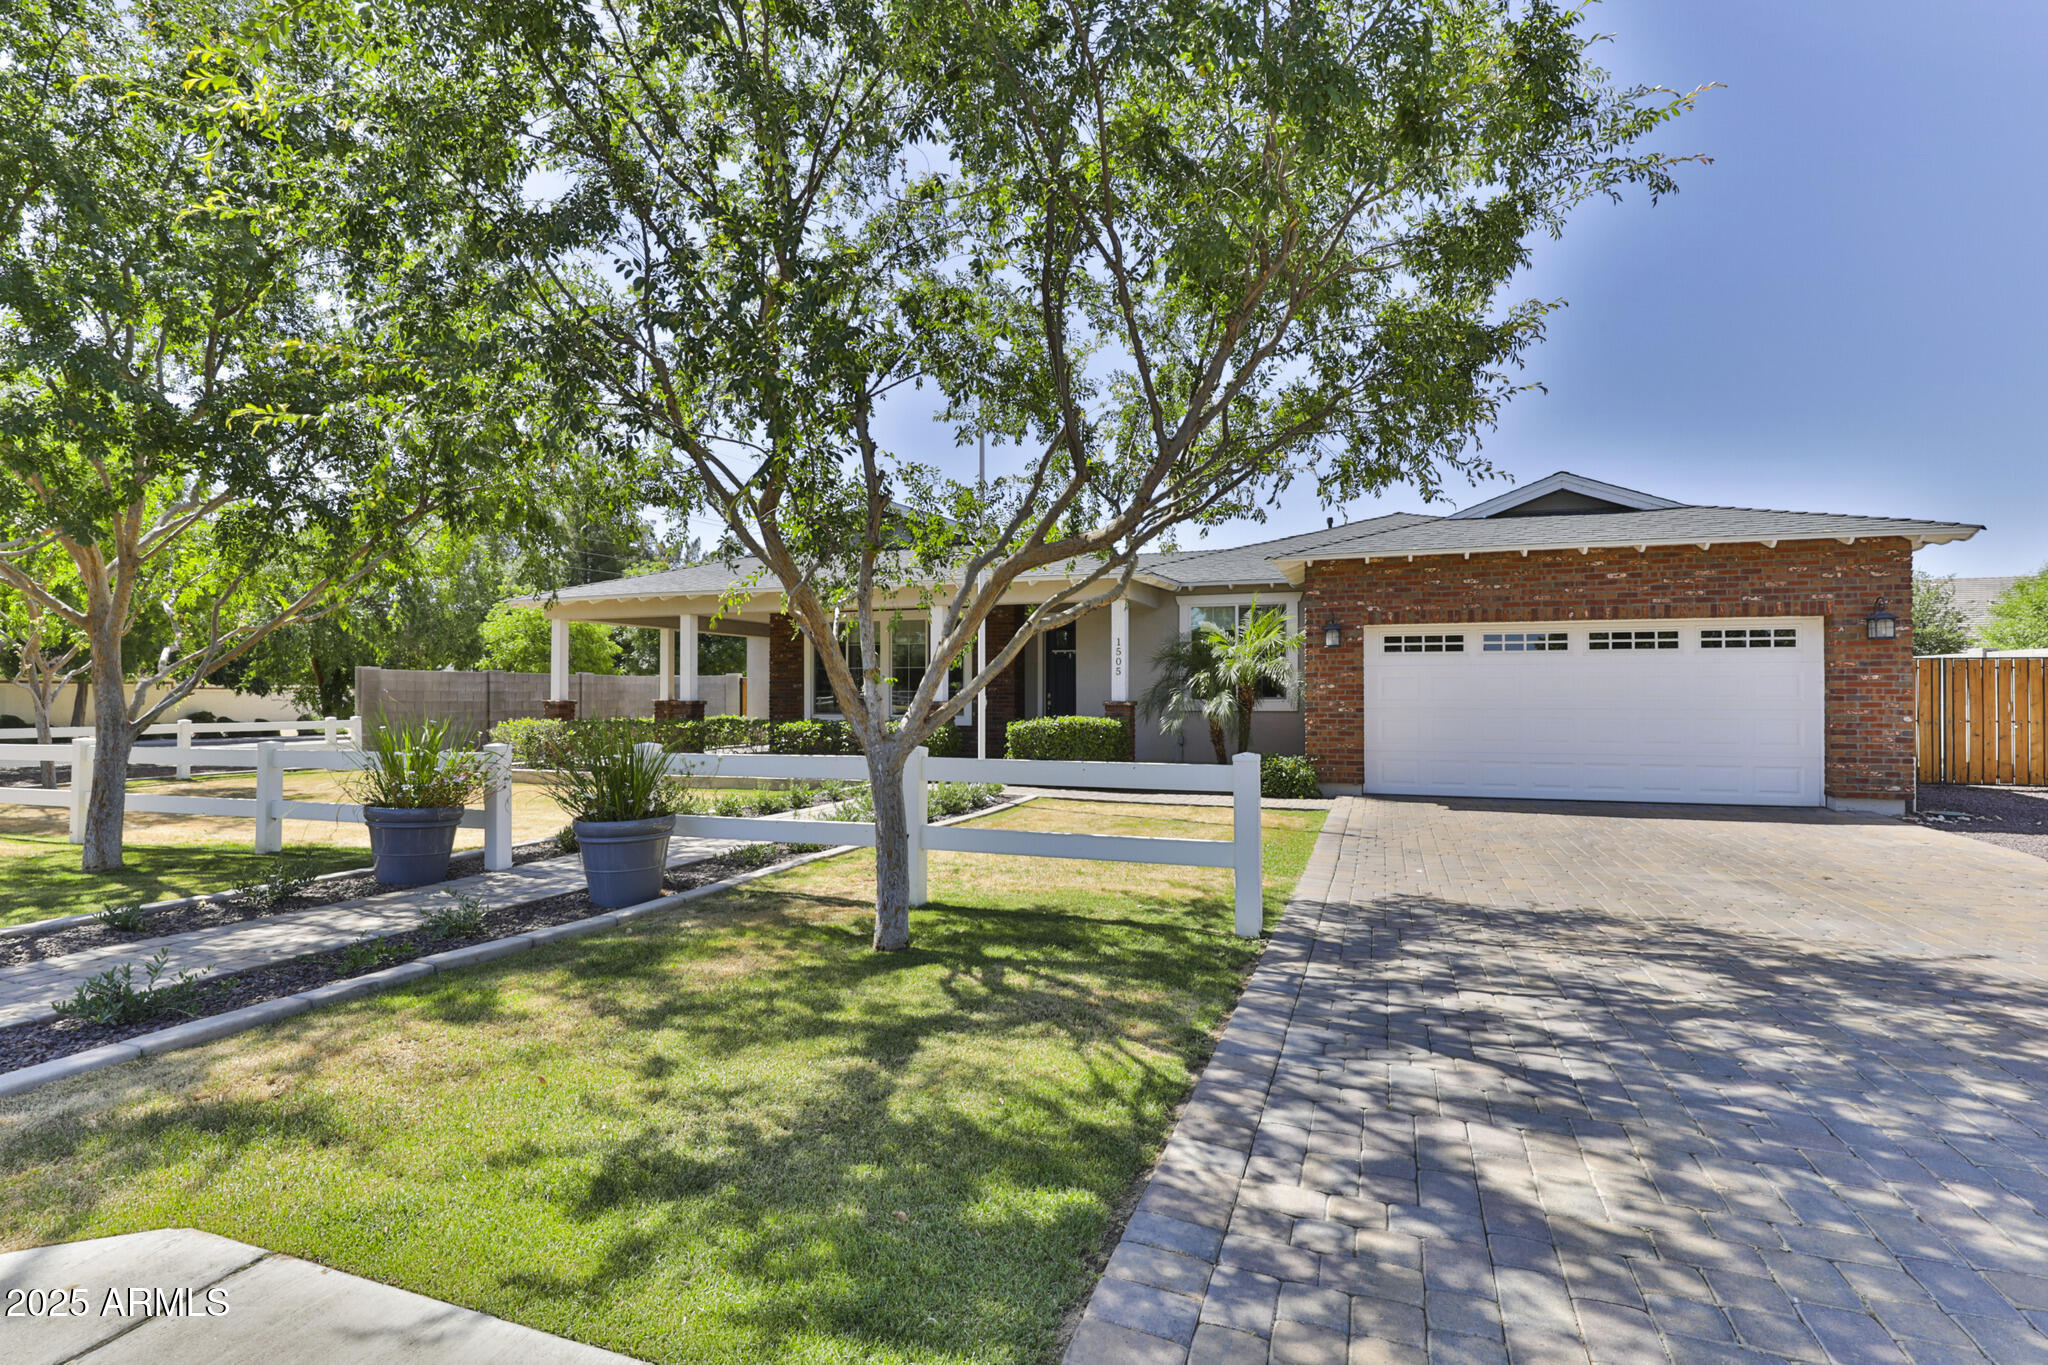
Active
$1,300,000
4
bds
|
4
ba
|
3,292
sqft
|
built
2016
1505 W Orangewood Ave, Phoenix, AZ 85021
$-4,011
Cash flow
-16.1%
Cash-on-Cash Return
2.0%
Cap rate
0.3%
Rent to Value Ratio
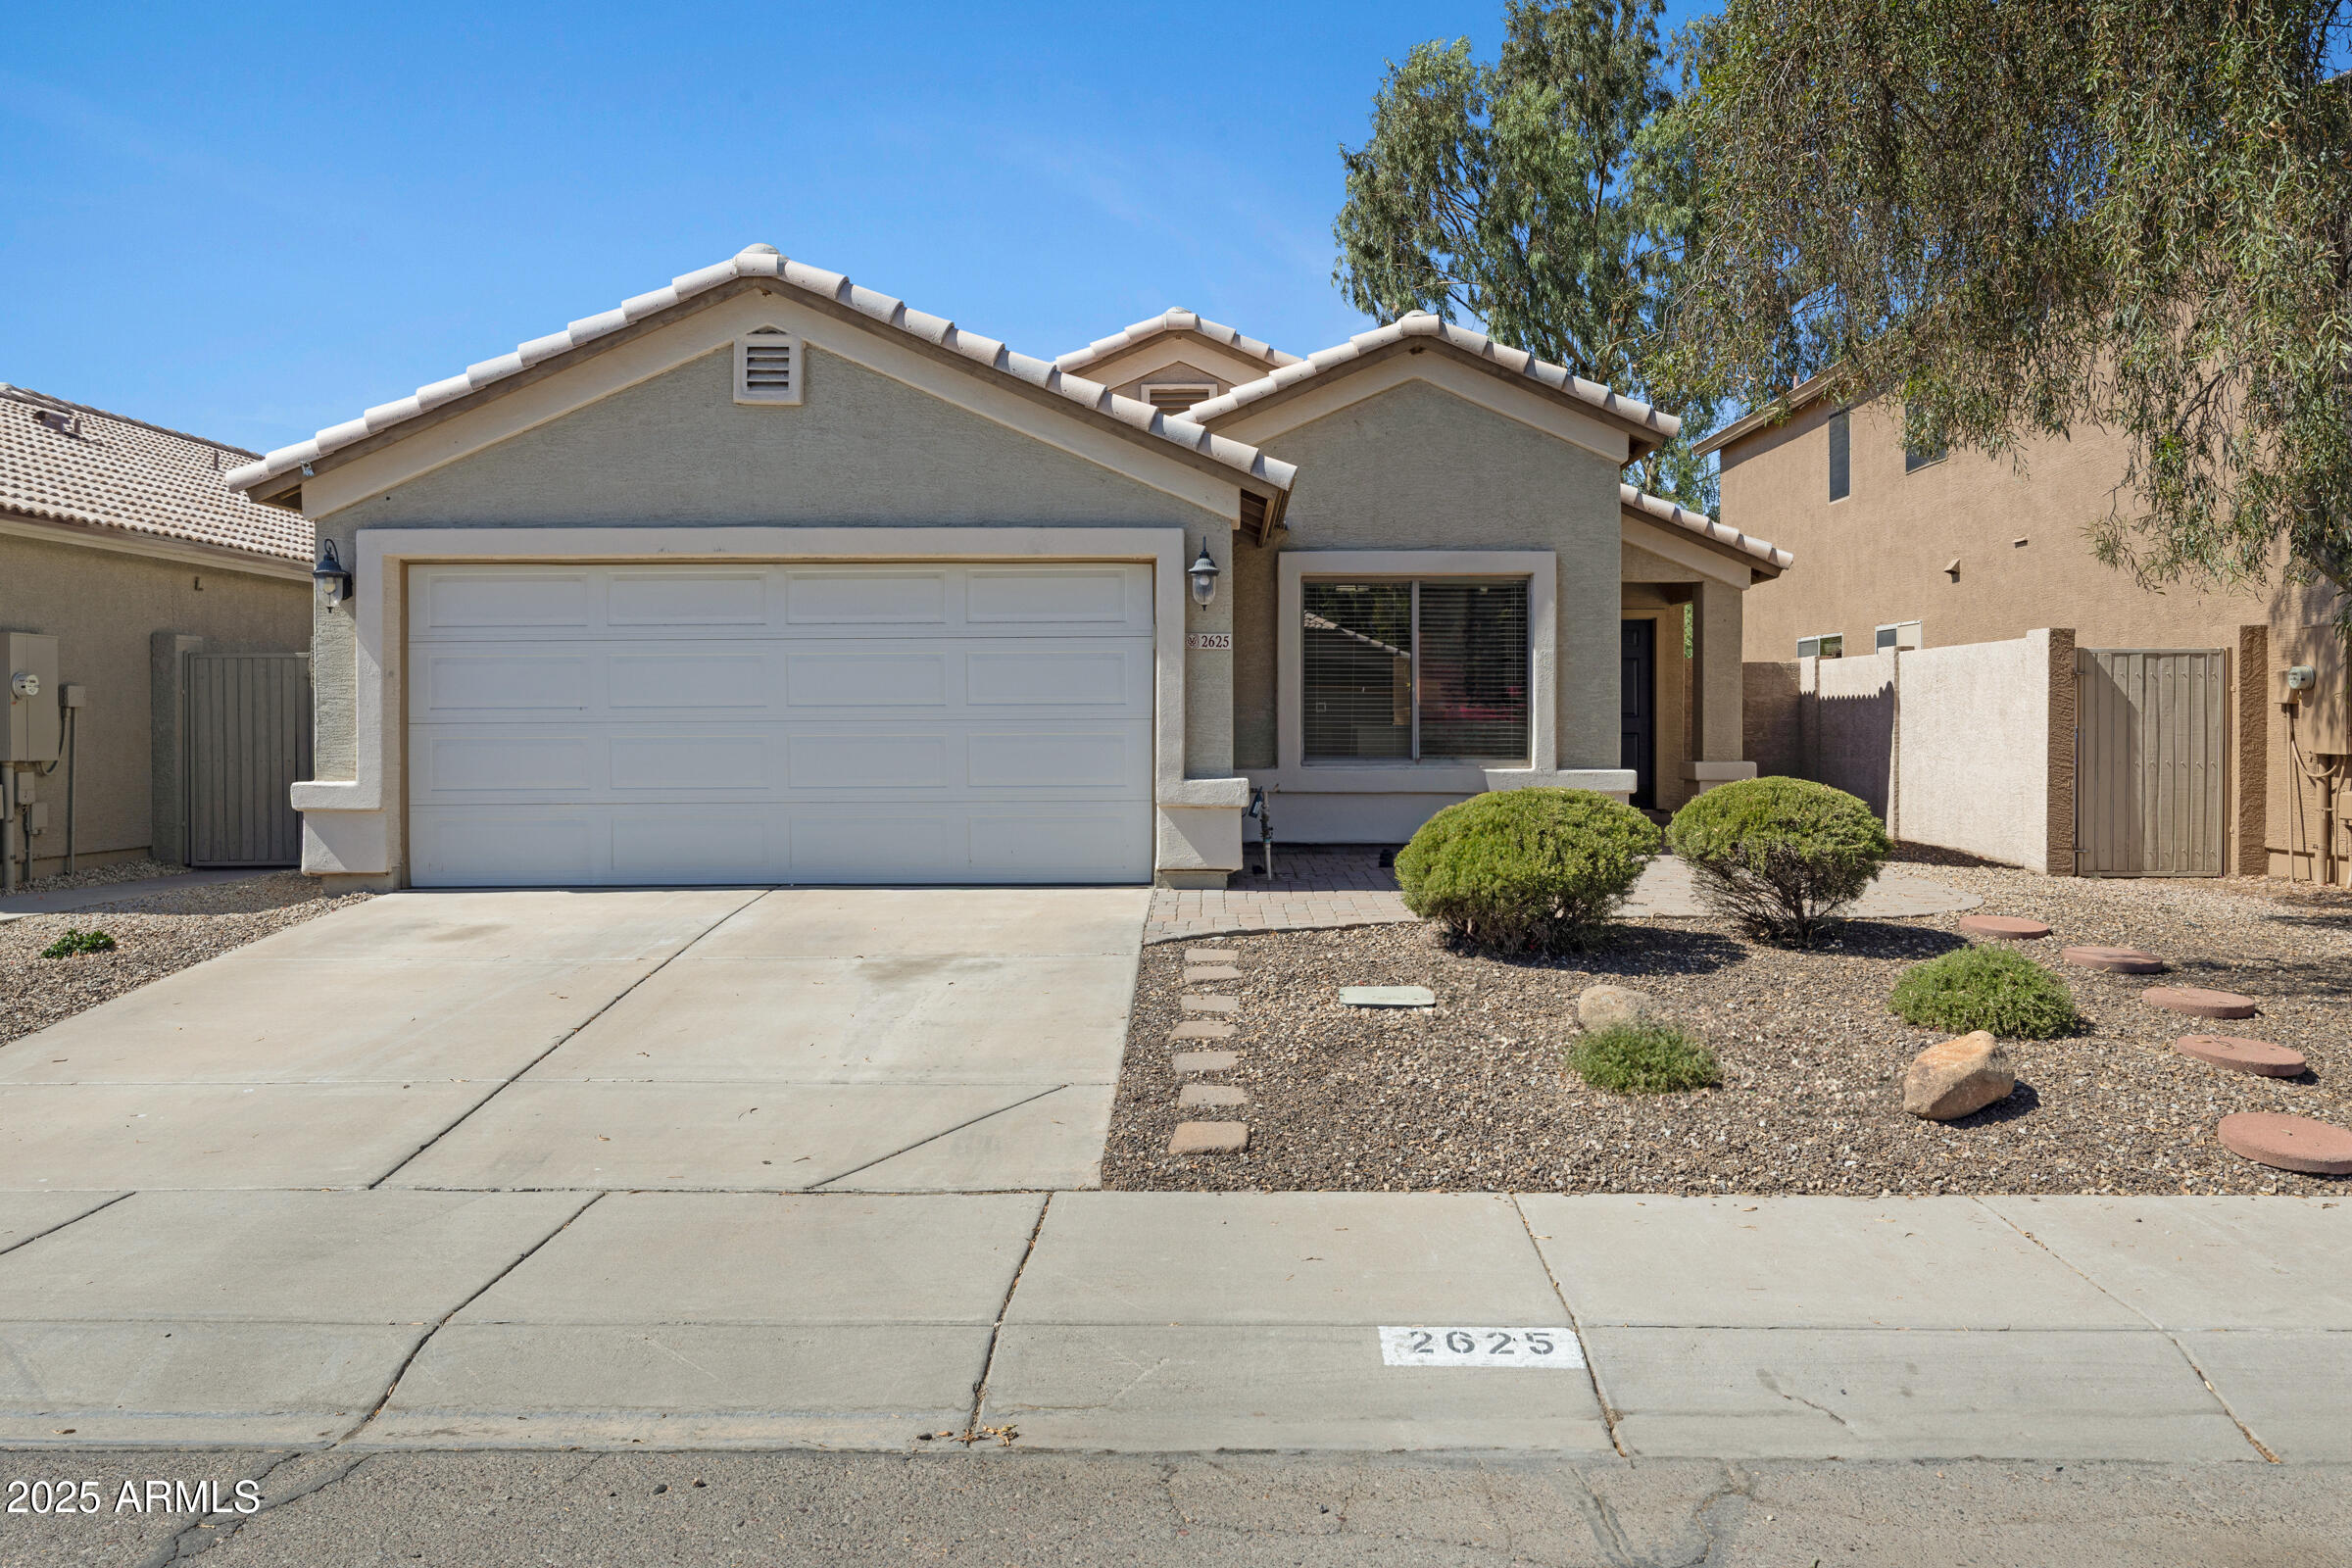
Active
$389,000
3
bds
|
2
ba
|
1,309
sqft
|
built
1999
2625 E Beverly Rd, Phoenix, AZ 85042
$-602
Cash flow
-8.1%
Cash-on-Cash Return
3.8%
Cap rate
0.6%
Rent to Value Ratio
Active
$279,900
2
bds
|
2
ba
|
847
sqft
|
built
2002
5302 E Van Buren St, Phoenix, AZ 85008
$-677
Cash flow
-12.6%
Cash-on-Cash Return
2.8%
Cap rate
0.5%
Rent to Value Ratio
Active under contract
$1,199,000
4
bds
|
3
ba
|
3,329
sqft
|
built
1990
14058 S 24th Way, Phoenix, AZ 85048
$-2,579
Cash flow
-11.2%
Cash-on-Cash Return
3.1%
Cap rate
0.5%
Rent to Value Ratio
Active
$1,350,000
4
bds
|
3
ba
|
3,211
sqft
|
built
2006
3804 E Daley Ln, Phoenix, AZ 85050
$-4,474
Cash flow
-17.3%
Cash-on-Cash Return
1.7%
Cap rate
0.3%
Rent to Value Ratio
Active
$315,000
1
bds
|
1
ba
|
710
sqft
|
built
2005
114 W Adams St, Phoenix, AZ 85003
$-1,123
Cash flow
-18.6%
Cash-on-Cash Return
1.4%
Cap rate
0.5%
Rent to Value Ratio
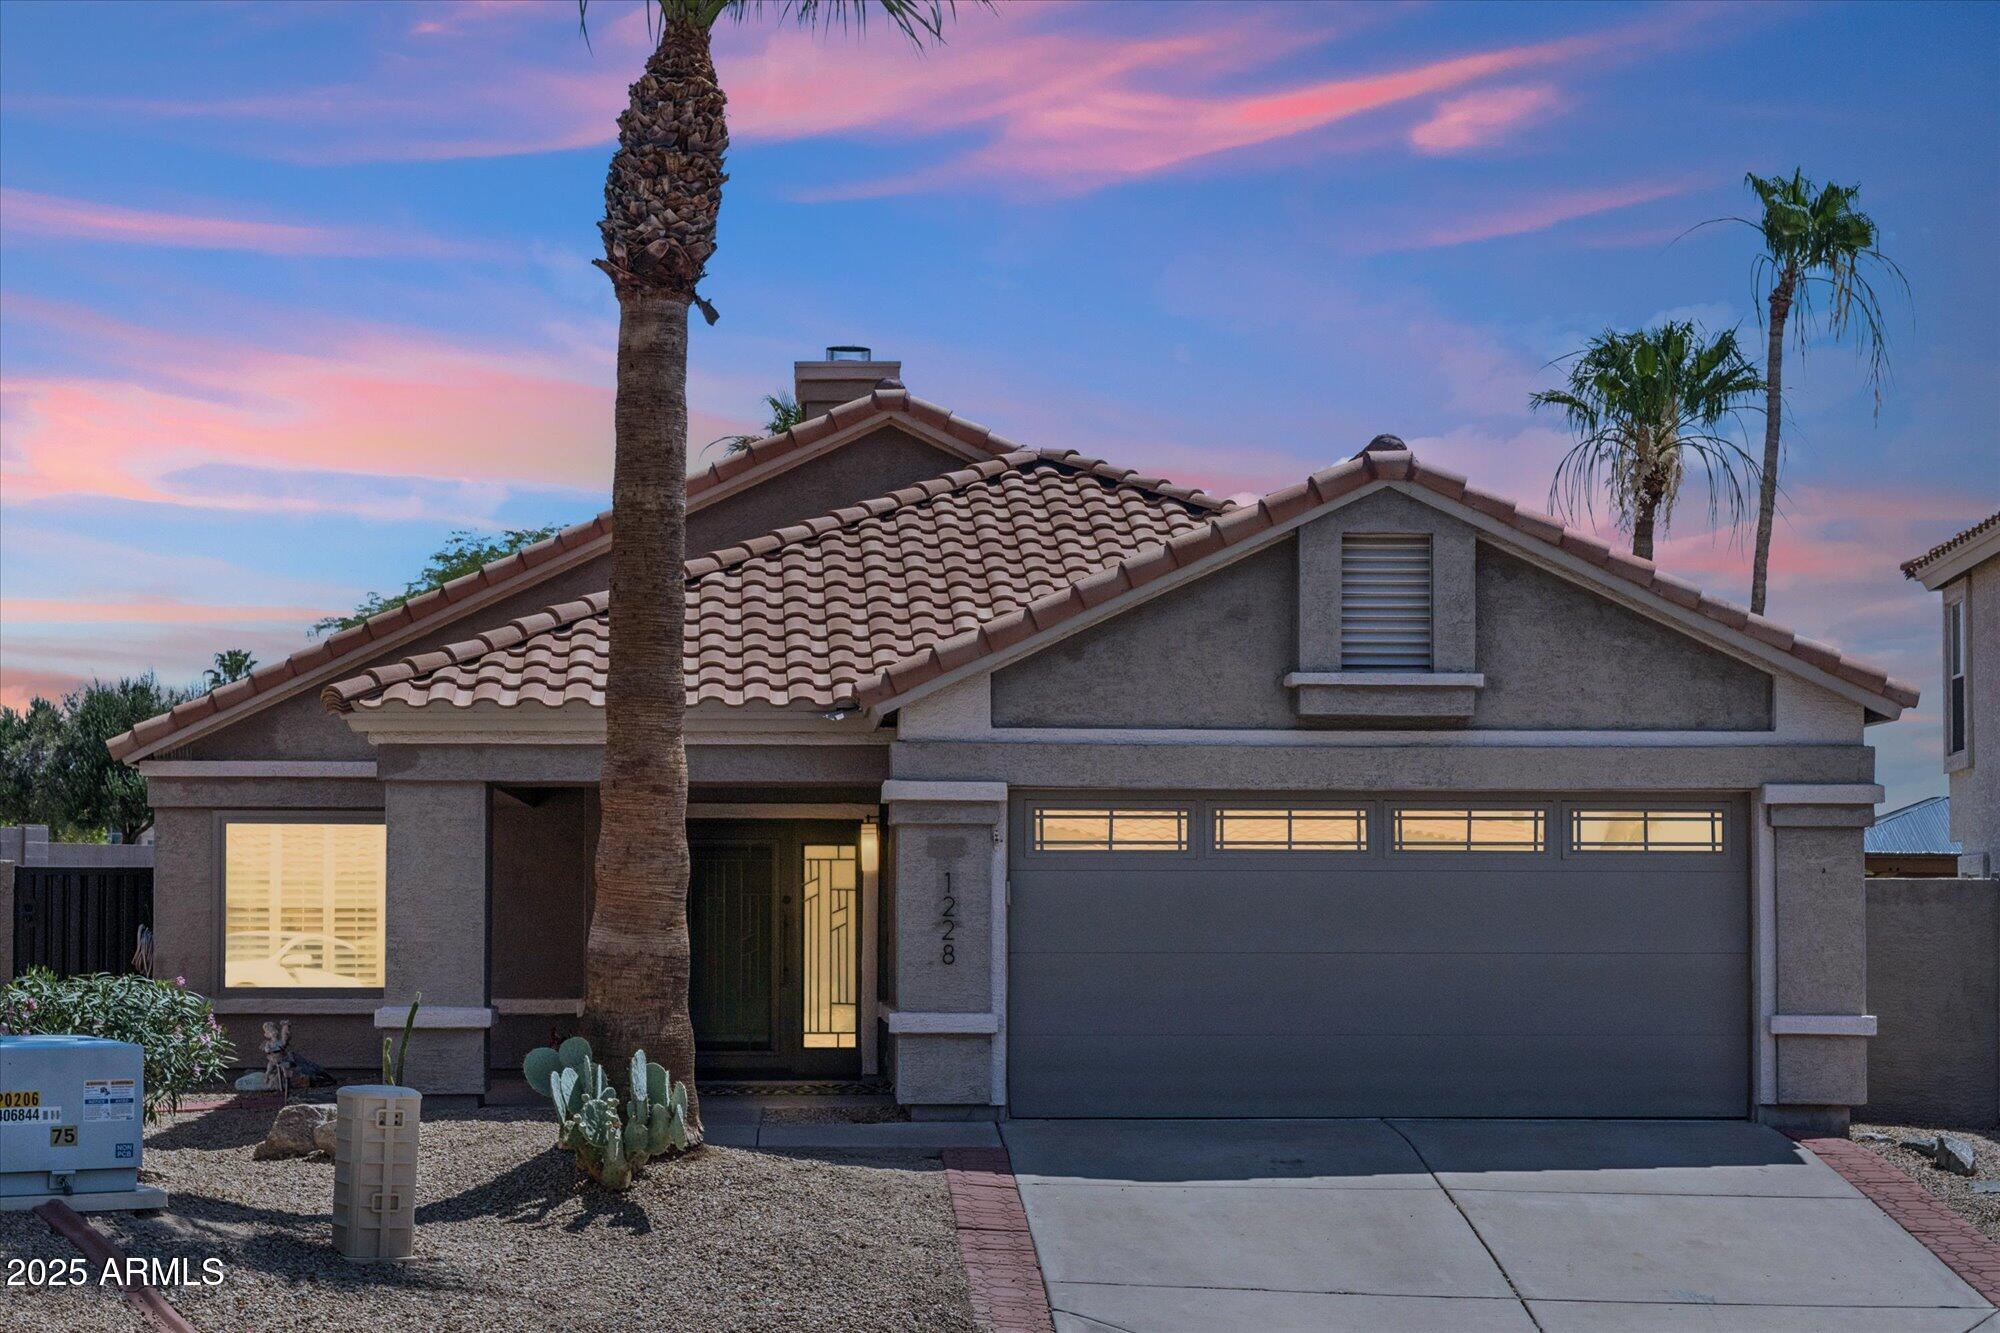
Active
$624,500
3
bds
|
2
ba
|
1,683
sqft
|
built
1989
1228 E Mountain Vista Dr, Phoenix, AZ 85048
$-1,400
Cash flow
-11.7%
Cash-on-Cash Return
3.0%
Cap rate
0.4%
Rent to Value Ratio

Active
$519,900
3
bds
|
2
ba
|
1,651
sqft
|
built
1974
5127 E Tamblo Dr, Phoenix, AZ 85044
$-1,098
Cash flow
-11.0%
Cash-on-Cash Return
3.1%
Cap rate
0.4%
Rent to Value Ratio
Active
$610,000
4
bds
|
2
ba
|
2,029
sqft
|
built
1974
2826 E Cactus Rd, Phoenix, AZ 85032
$-1,265
Cash flow
-10.8%
Cash-on-Cash Return
3.2%
Cap rate
0.4%
Rent to Value Ratio
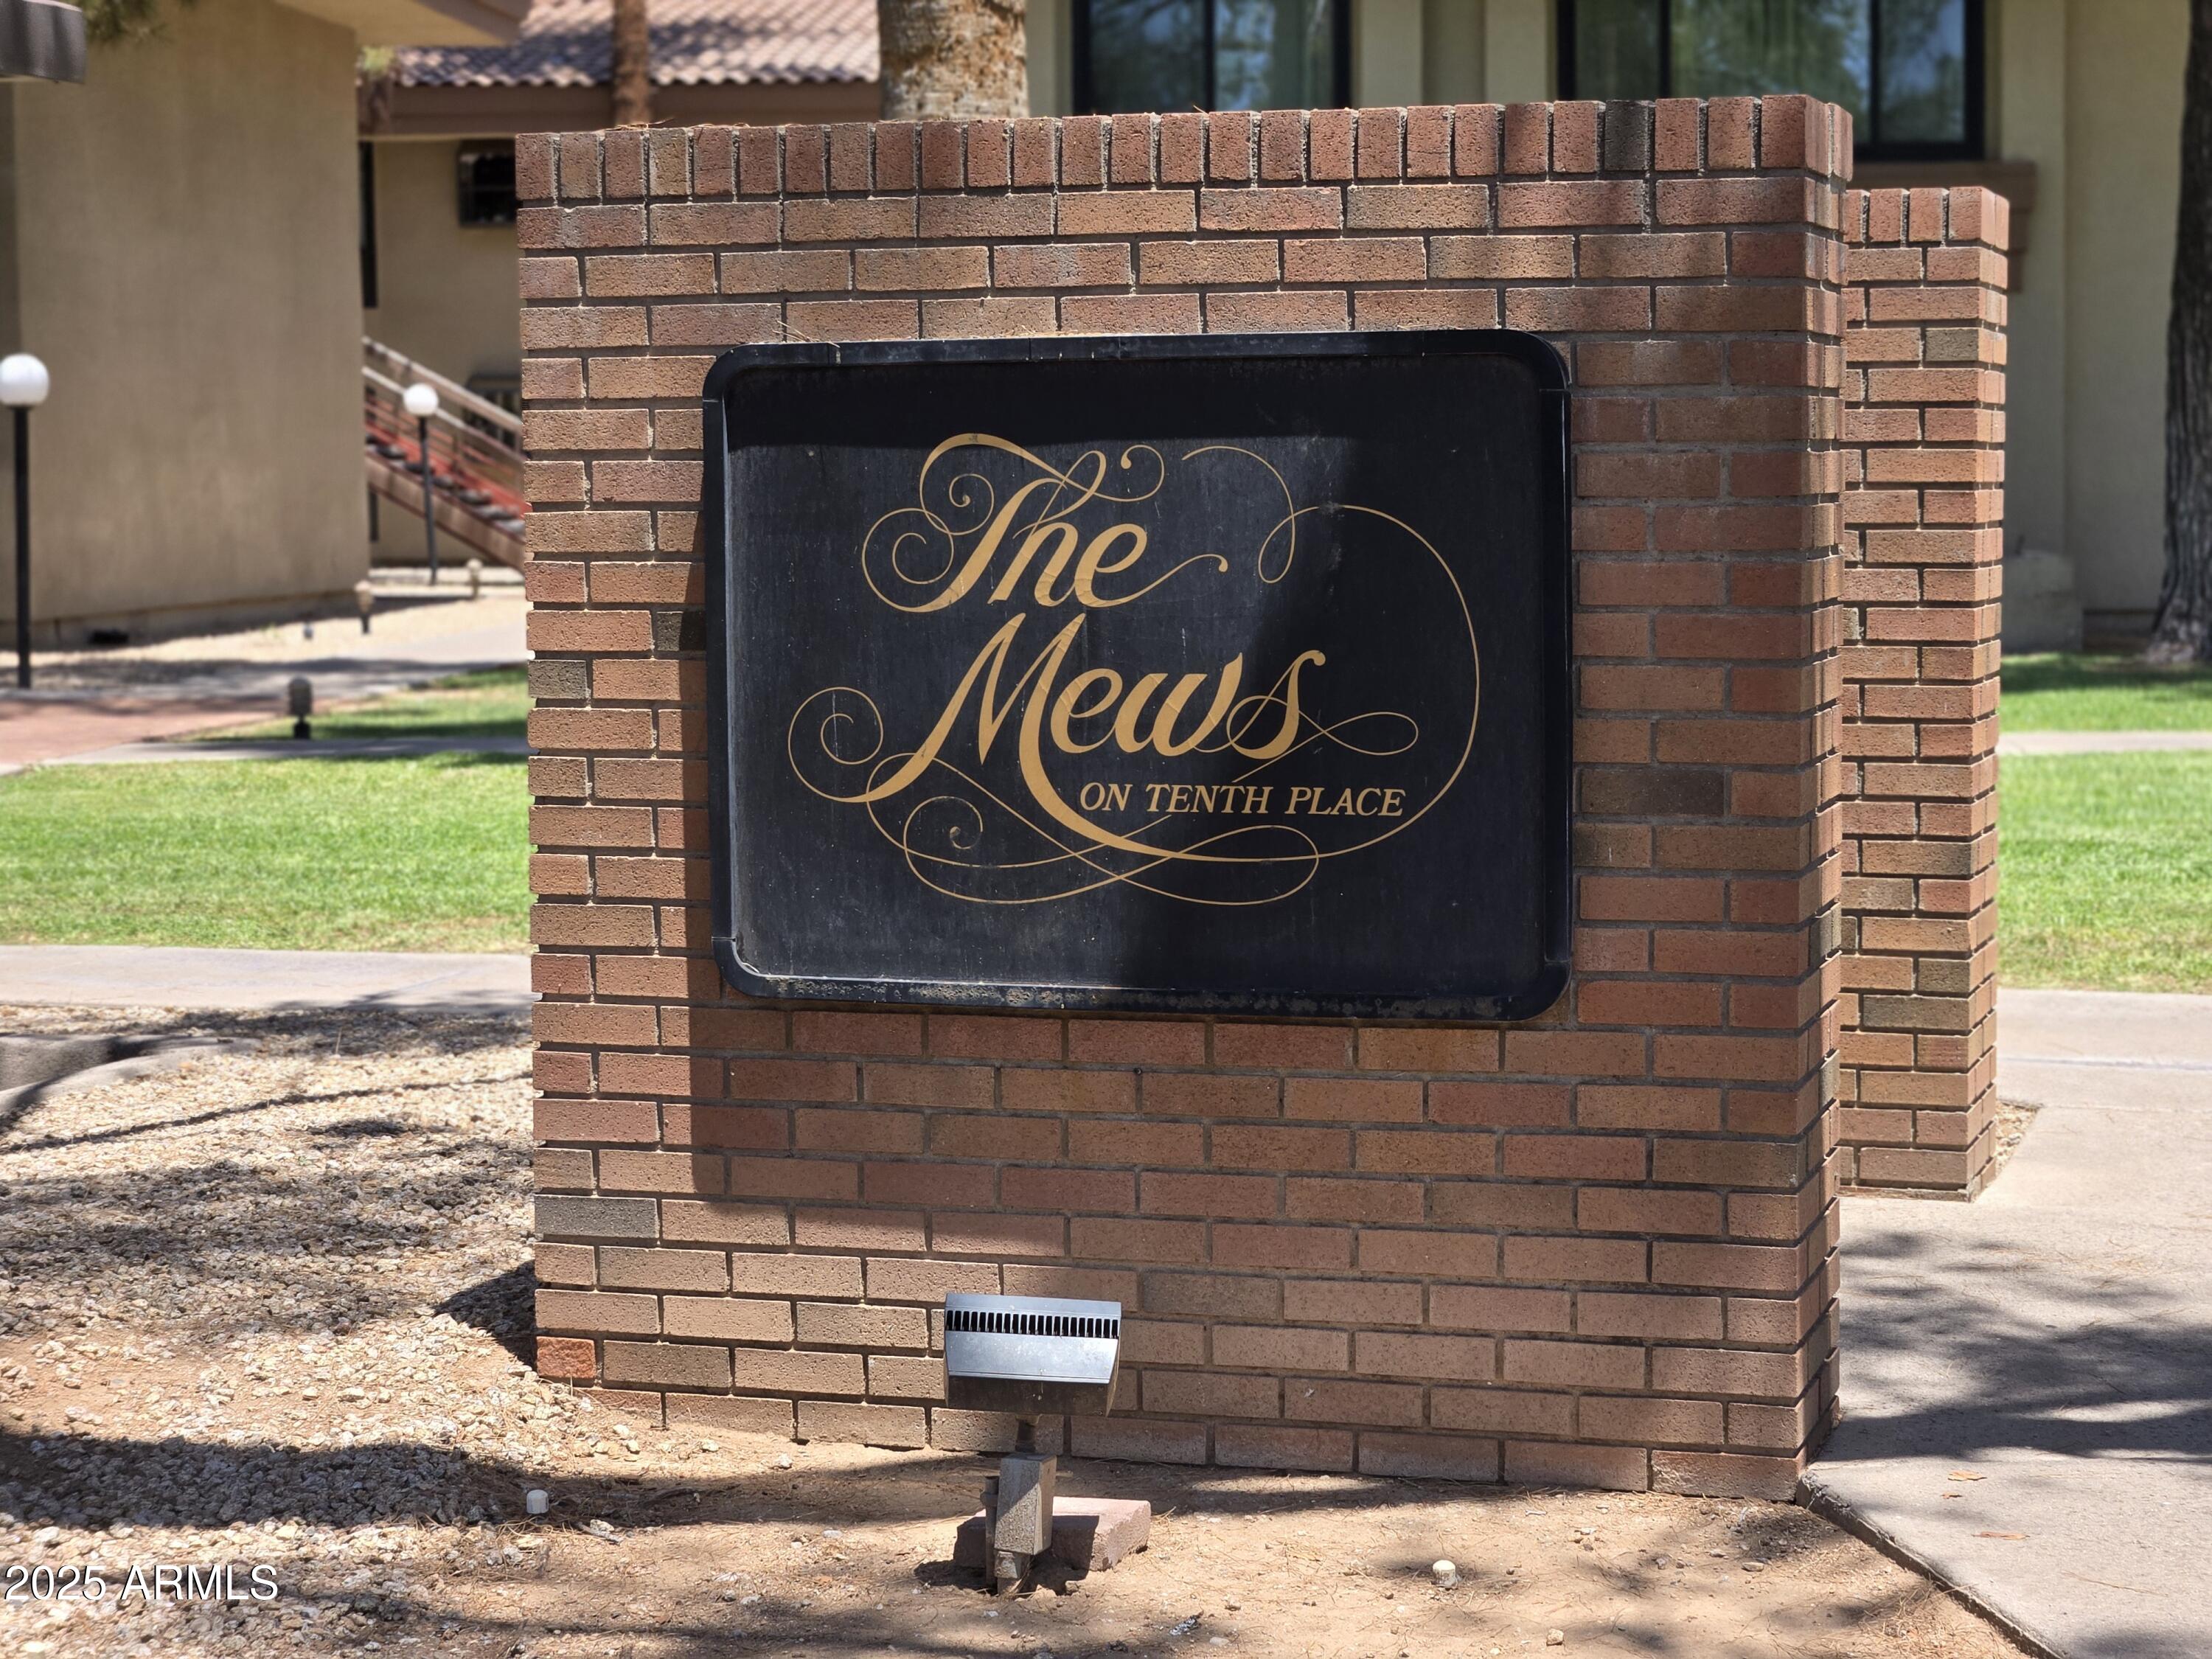
Active
$265,000
2
bds
|
2
ba
|
953
sqft
|
built
1984
5035 N 10th Pl, Phoenix, AZ 85014
$-581
Cash flow
-11.4%
Cash-on-Cash Return
3.0%
Cap rate
0.6%
Rent to Value Ratio

Active
$505,000
3
bds
|
2
ba
|
1,628
sqft
|
built
2002
3026 W Silver Fox Way, Phoenix, AZ 85045
$-1,049
Cash flow
-10.8%
Cash-on-Cash Return
3.2%
Cap rate
0.5%
Rent to Value Ratio
Active
$2,600,000
5
bds
|
5
ba
|
4,800
sqft
|
built
2023
733 W El Camino Dr, Phoenix, AZ 85021
$-5,597
Cash flow
-11.2%
Cash-on-Cash Return
3.1%
Cap rate
0.4%
Rent to Value Ratio
Active
$419,999
4
bds
|
2
ba
|
1,777
sqft
|
built
1970
9615 N 34th Ave, Phoenix, AZ 85051
$-296
Cash flow
-3.7%
Cash-on-Cash Return
4.8%
Cap rate
0.6%
Rent to Value Ratio
Active under contract
$560,000
4
bds
|
3
ba
|
2,568
sqft
|
built
1996
1203 W Escuda Rd, Phoenix, AZ 85027
$-1,043
Cash flow
-9.7%
Cash-on-Cash Return
3.4%
Cap rate
0.5%
Rent to Value Ratio

Active
$1,075,000
4
bds
|
4
ba
|
4,004
sqft
|
built
2004
16401 S 29th Ave, Phoenix, AZ 85045
$-2,157
Cash flow
-10.5%
Cash-on-Cash Return
3.3%
Cap rate
0.5%
Rent to Value Ratio
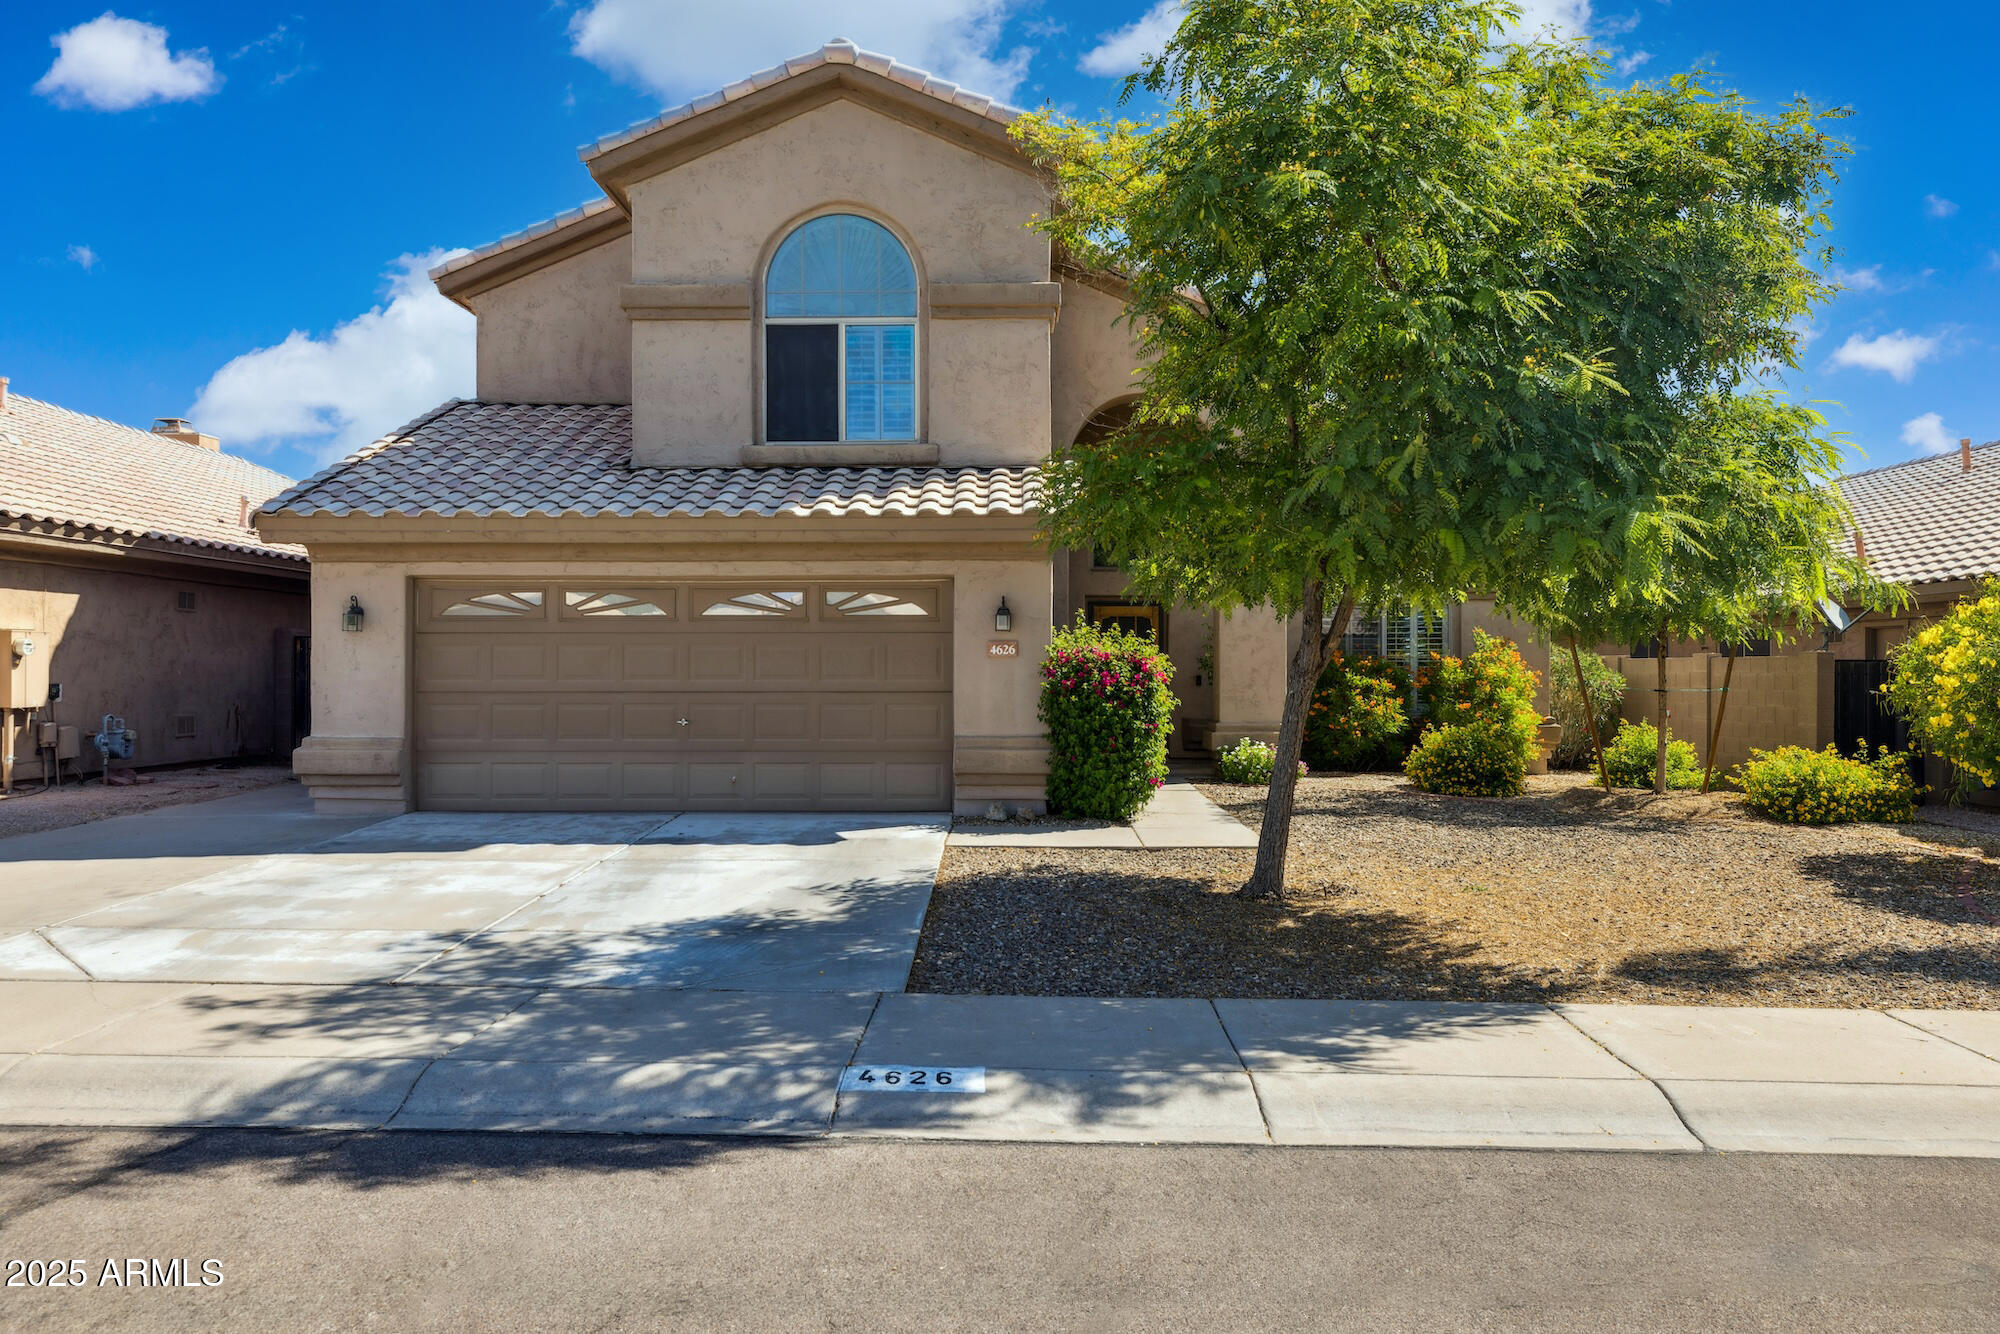
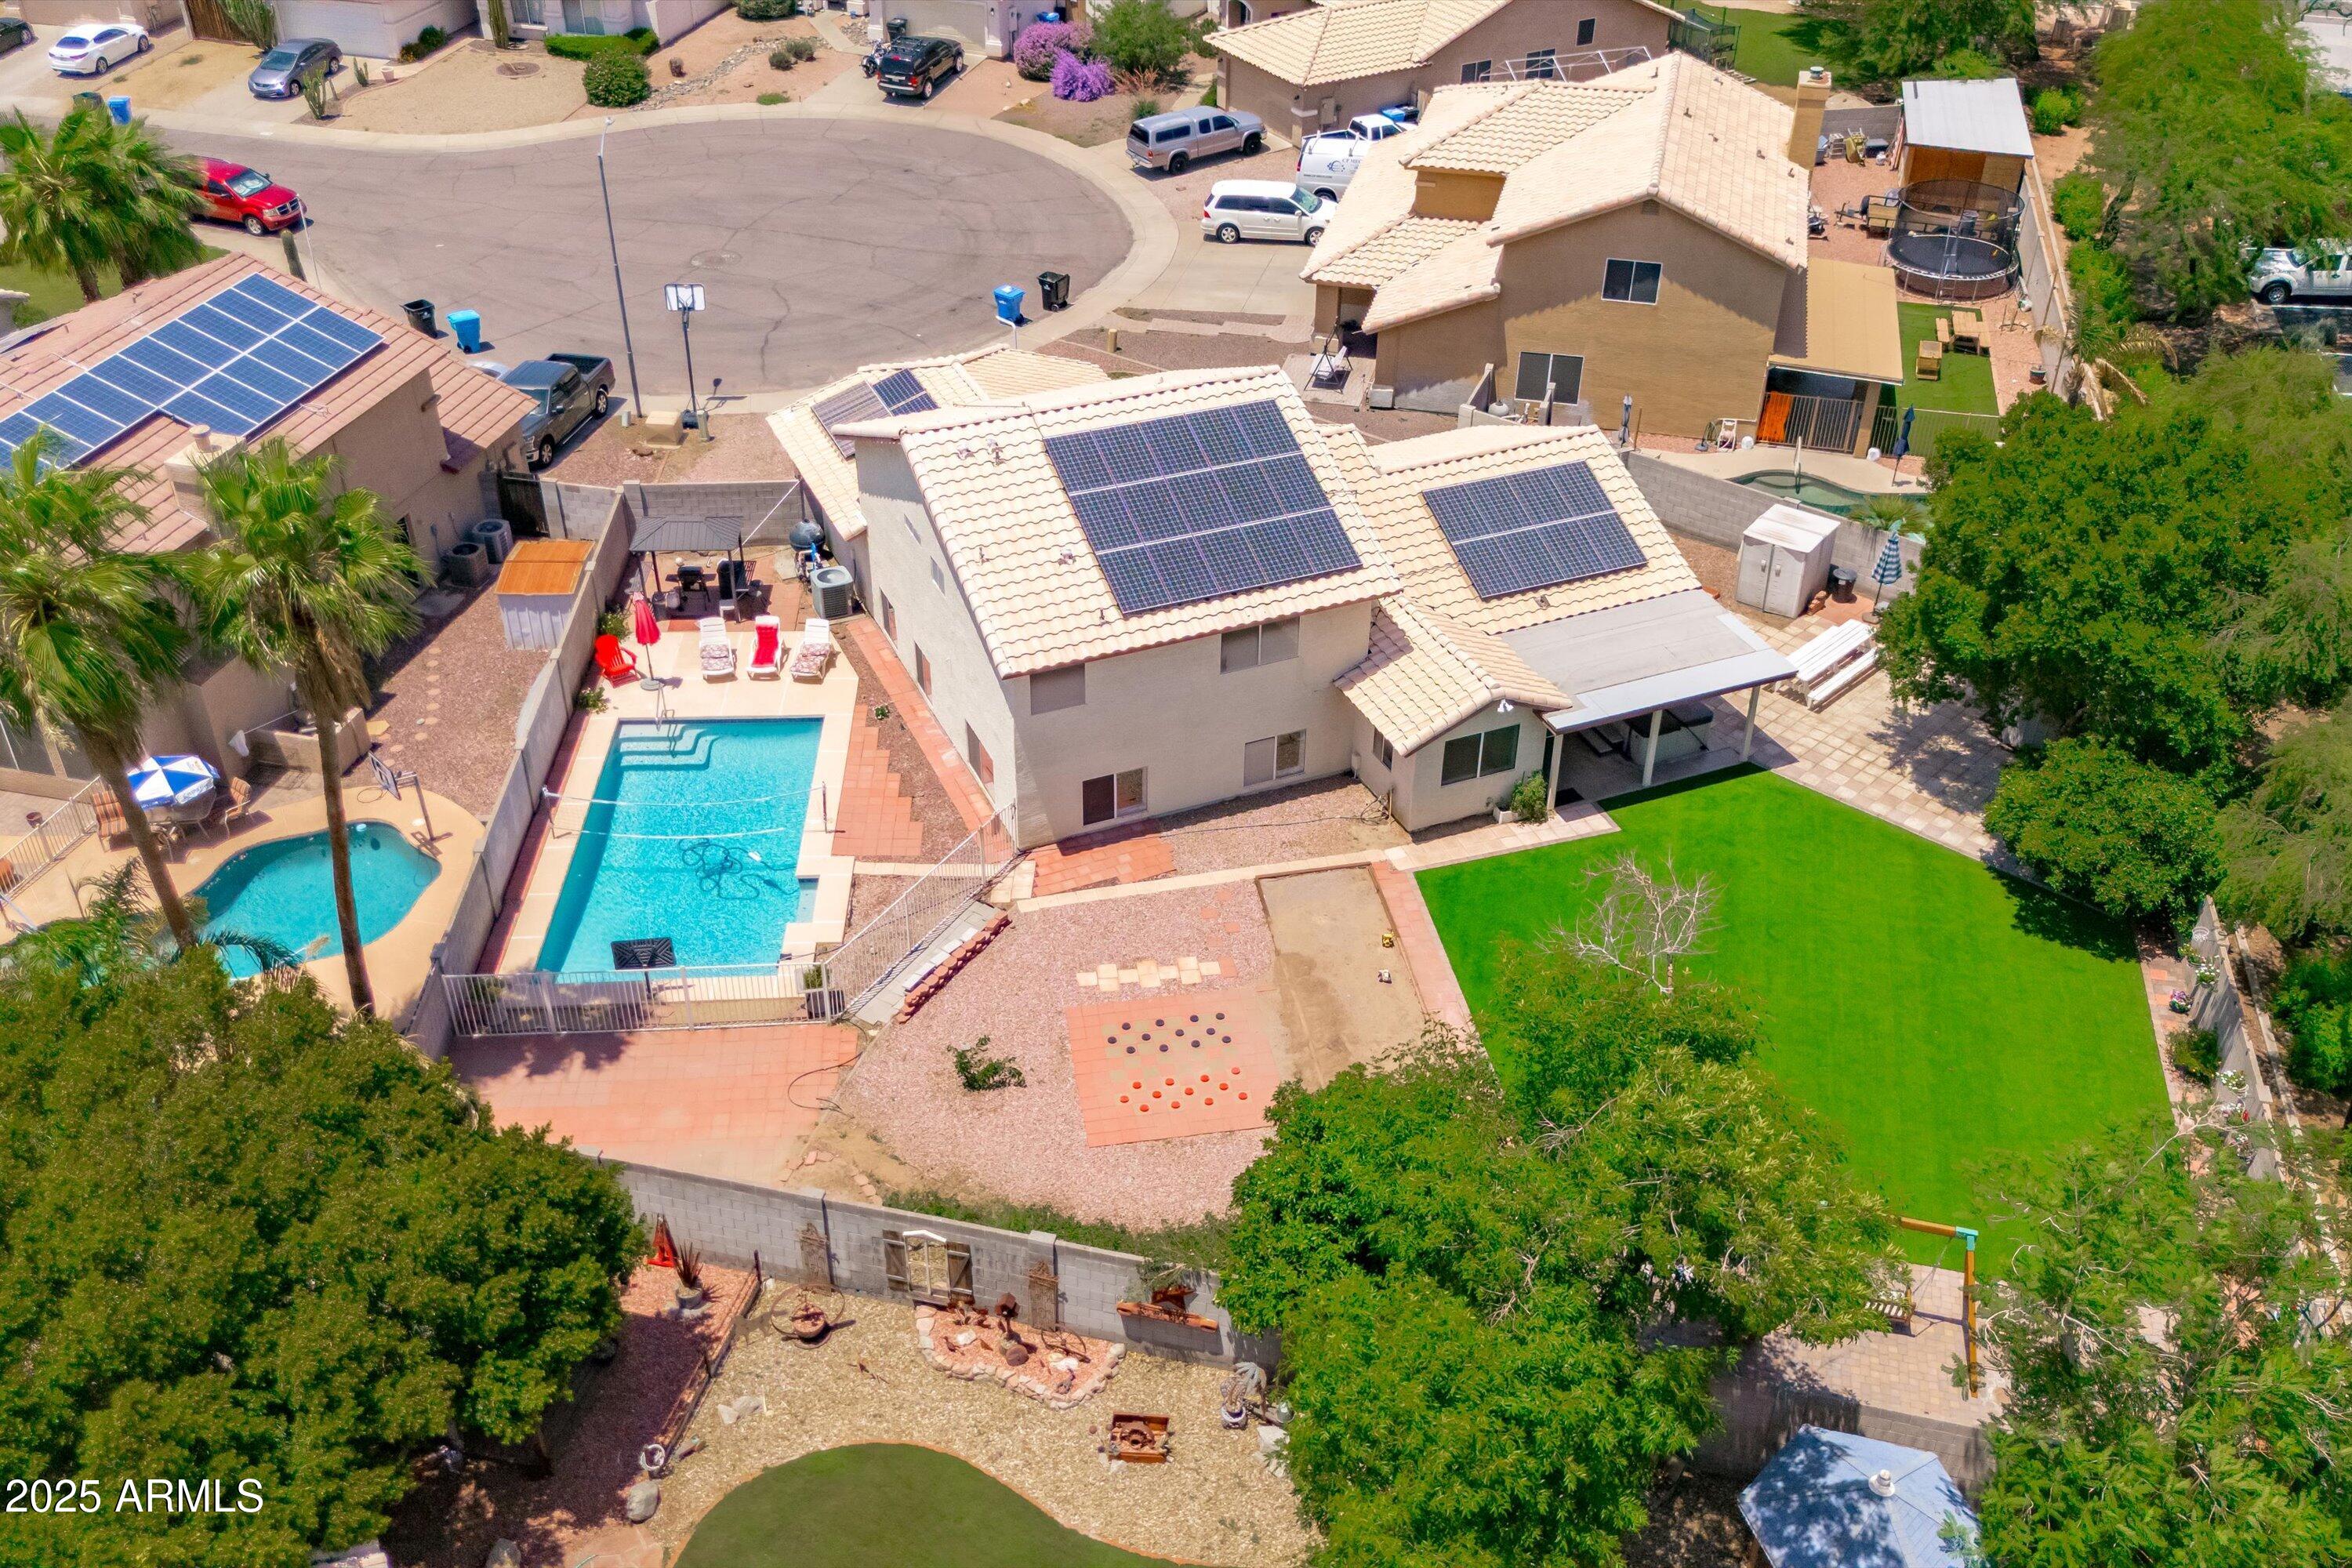
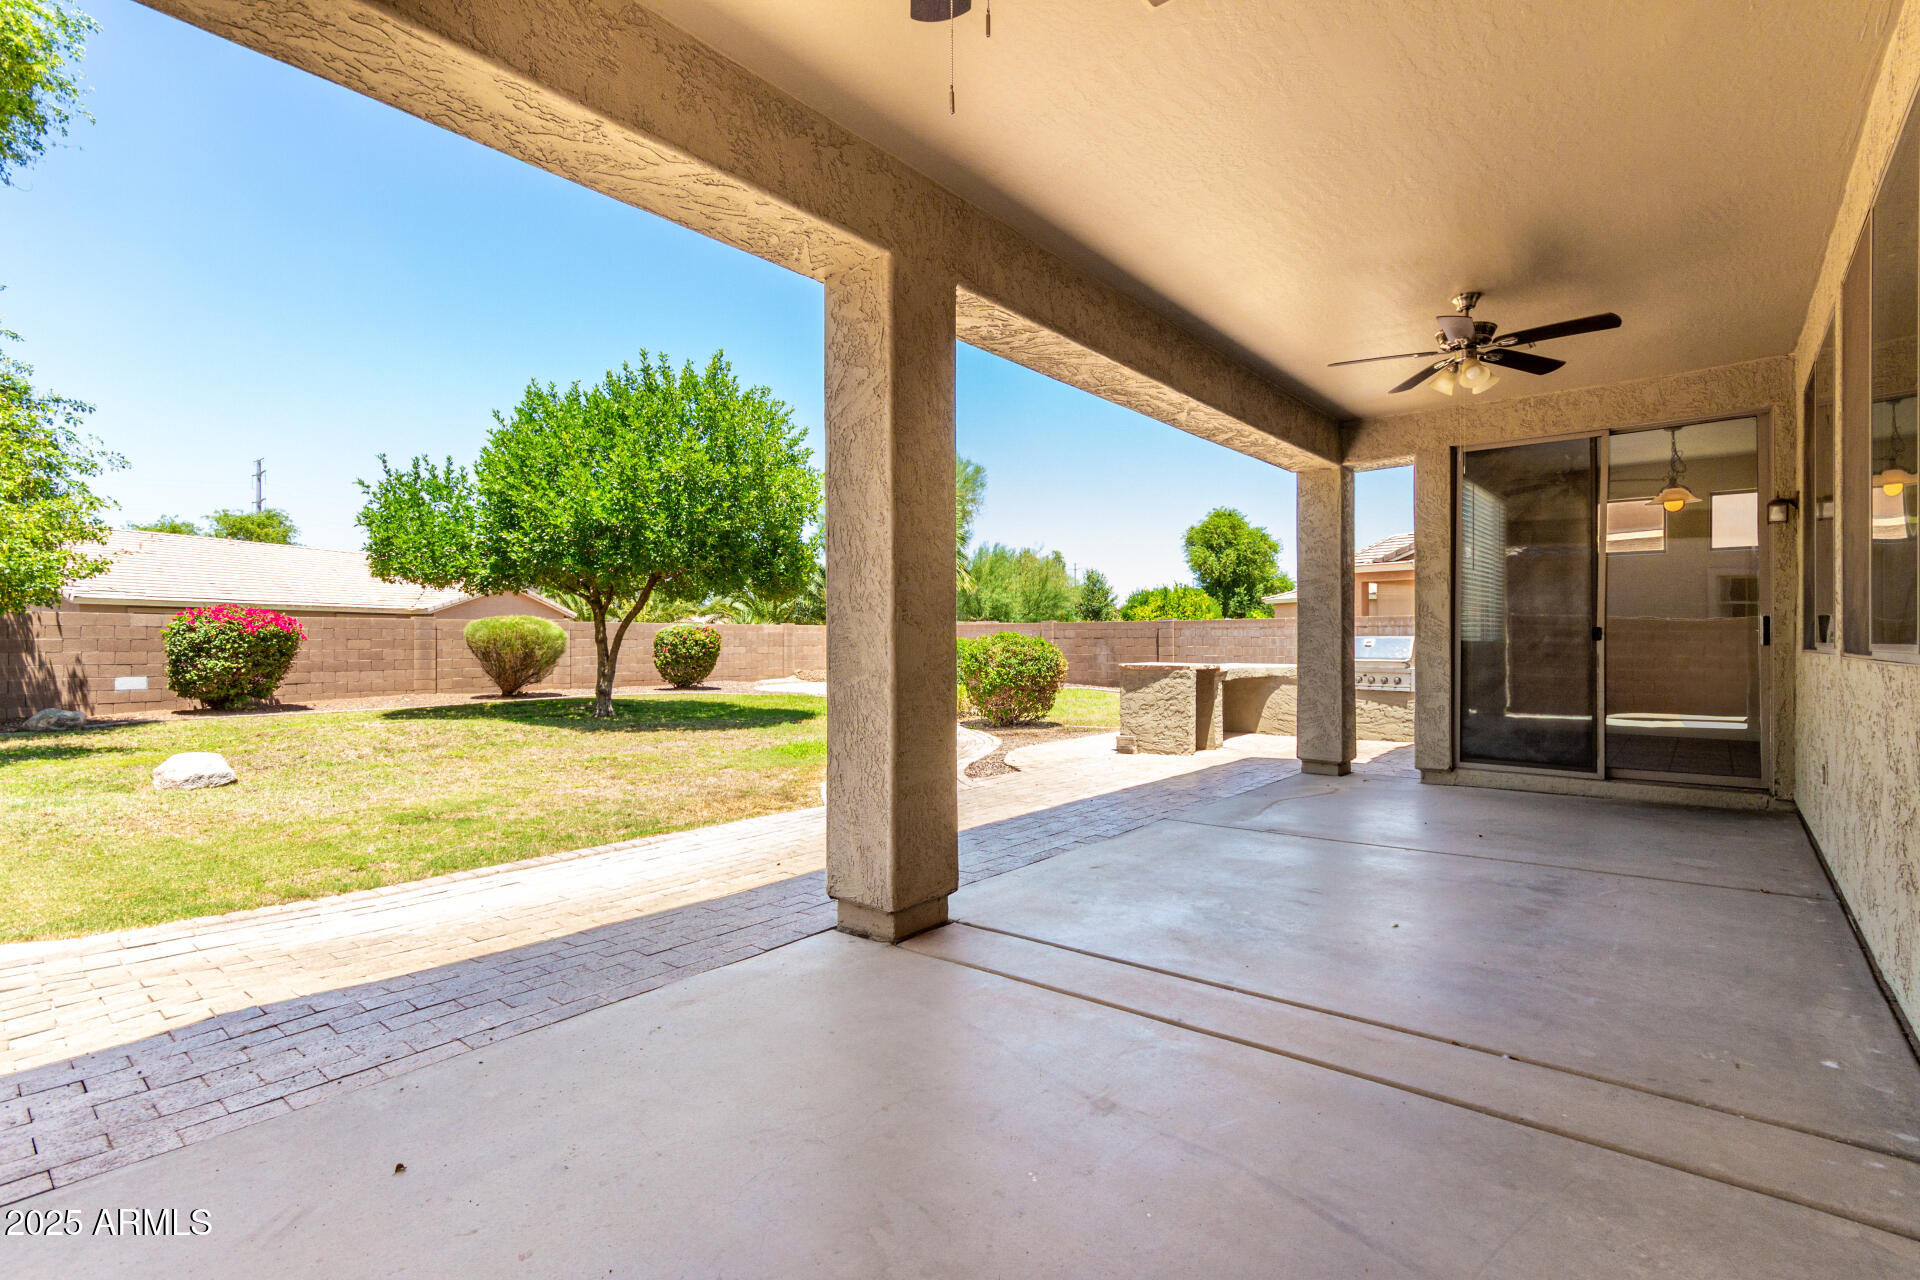
Active
$635,000
5
bds
|
3
ba
|
2,337
sqft
|
built
1995
4626 E Summerhaven Dr, Phoenix, AZ 85044
$-1,315
Cash flow
-10.8%
Cash-on-Cash Return
3.2%
Cap rate
0.4%
Rent to Value Ratio
Active
$467,500
4
bds
|
3
ba
|
2,433
sqft
|
built
2004
2116 W Fawn Dr, Phoenix, AZ 85041
$-973
Cash flow
-10.9%
Cash-on-Cash Return
3.2%
Cap rate
0.5%
Rent to Value Ratio
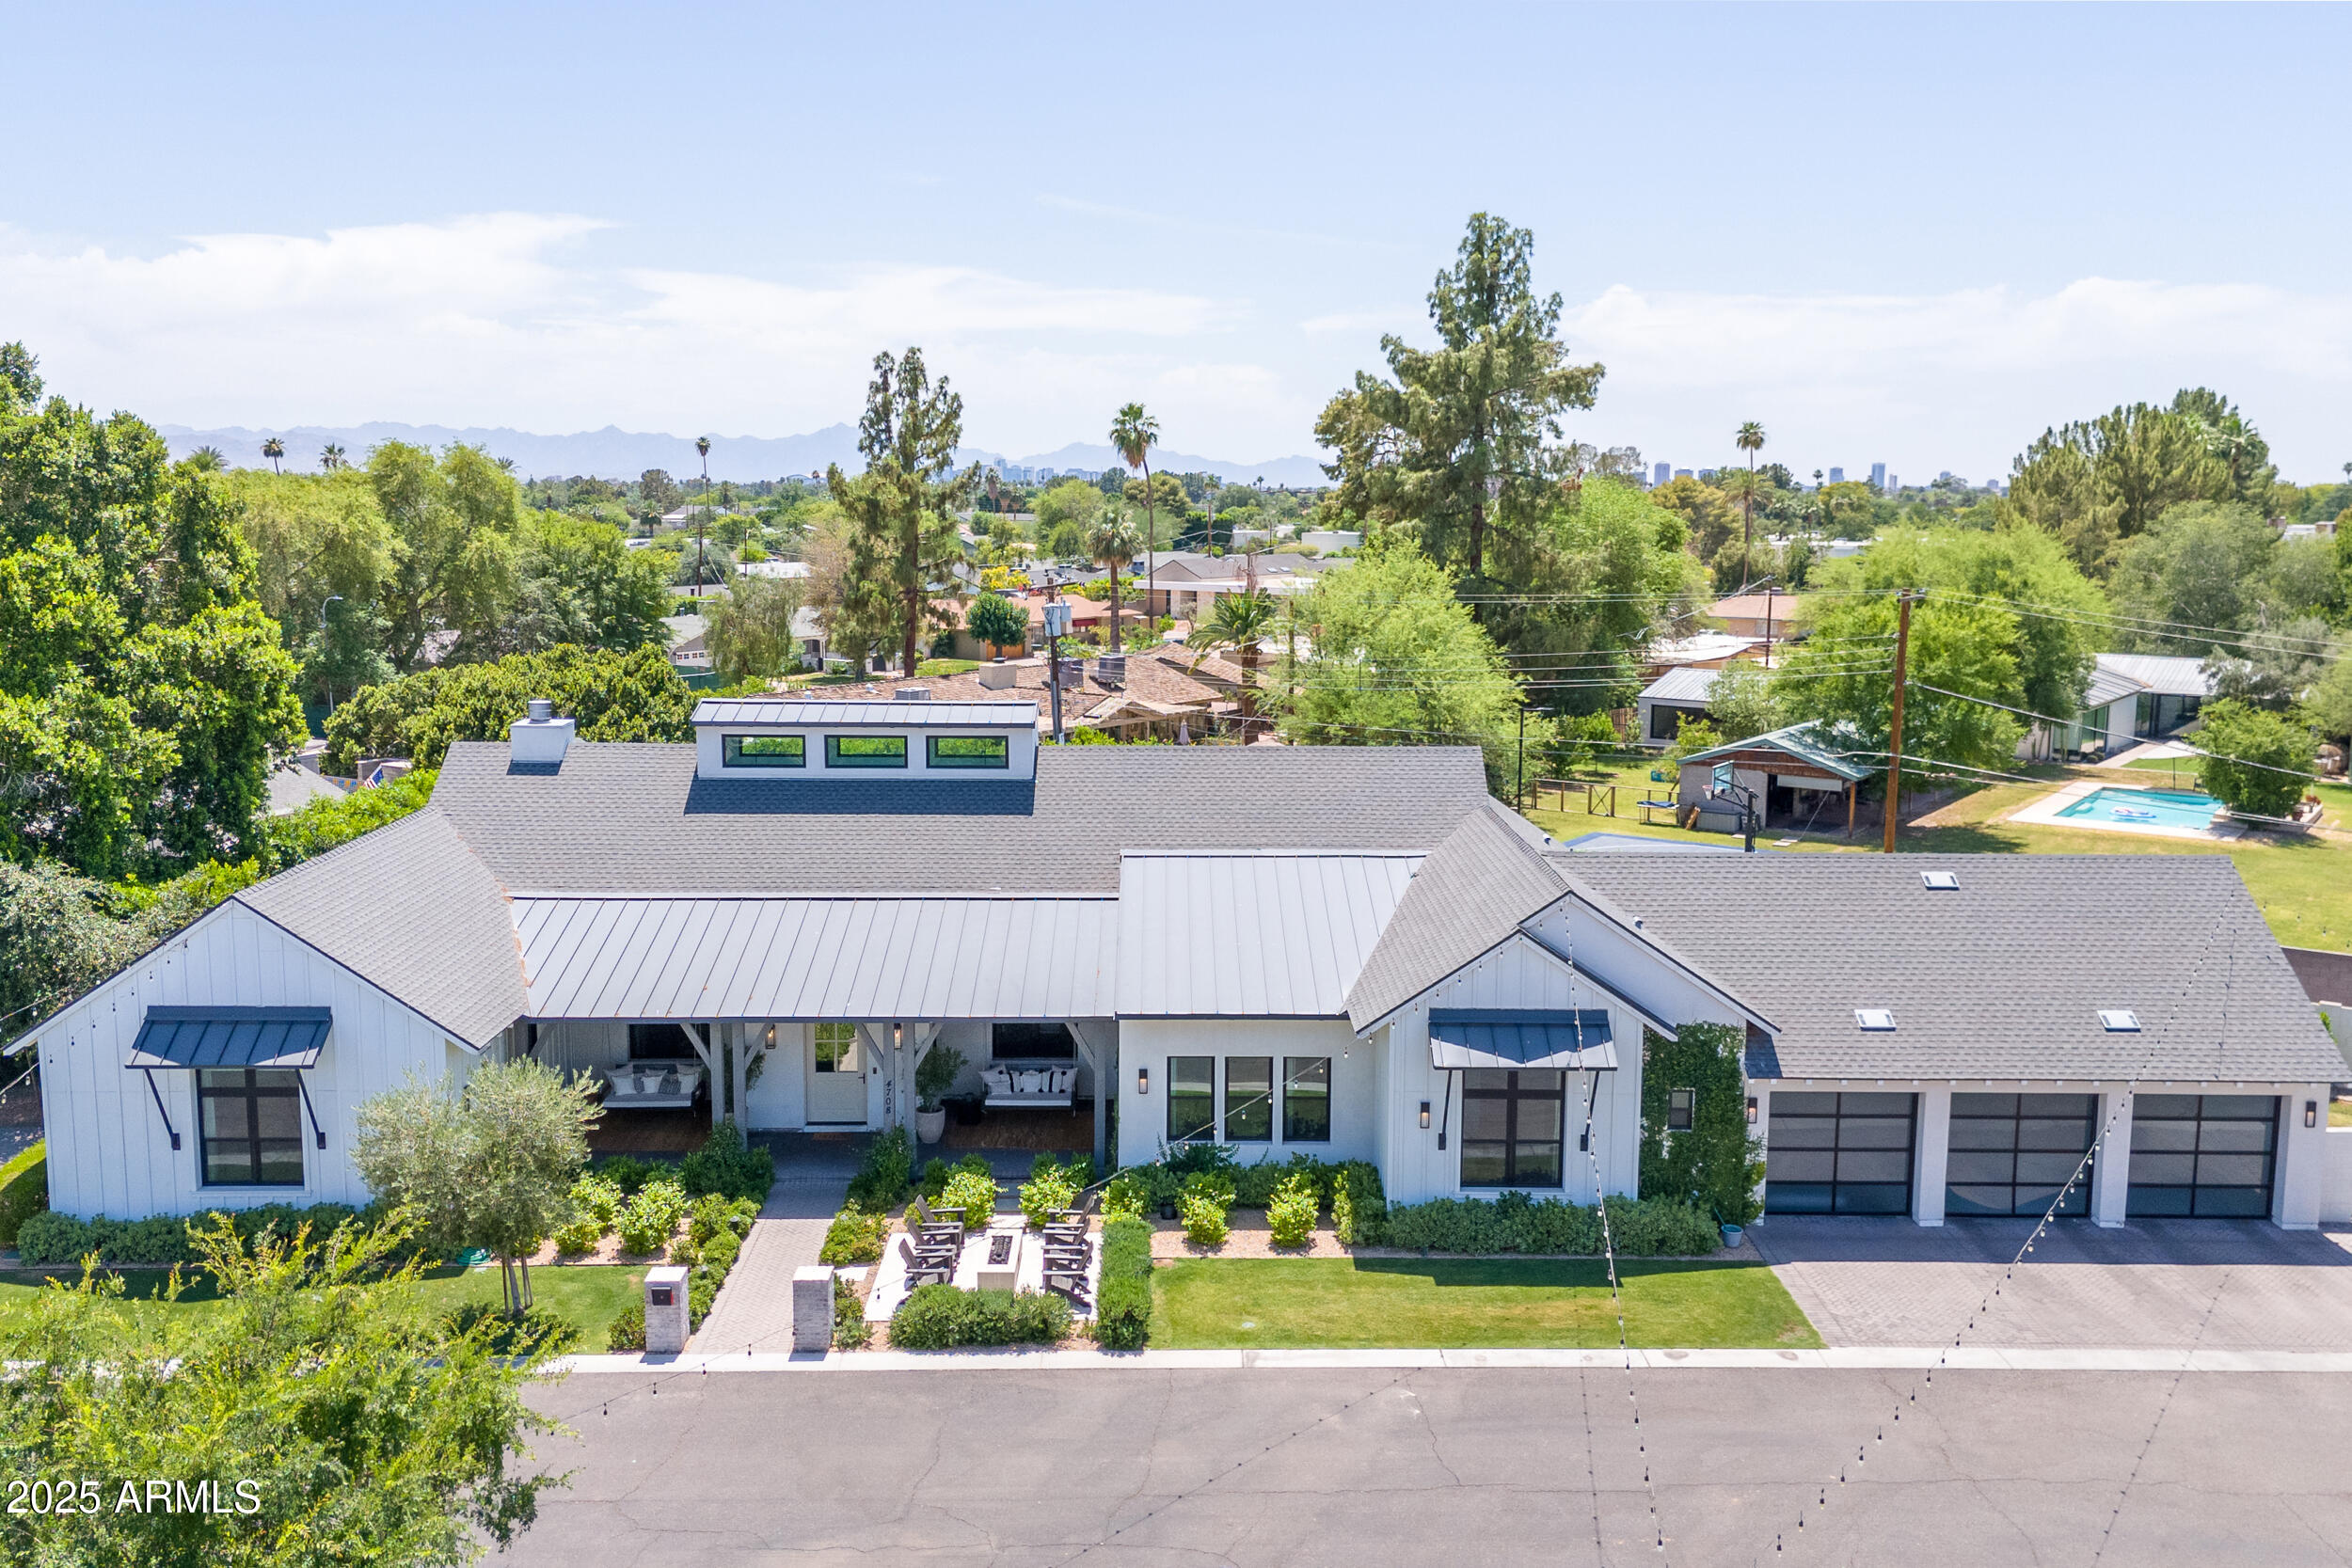
Active
$4,095,000
5
bds
|
6
ba
|
4,553
sqft
|
built
2019
4708 N 41st Pl, Phoenix, AZ 85018
$-13,953
Cash flow
-17.8%
Cash-on-Cash Return
1.6%
Cap rate
0.2%
Rent to Value Ratio
Active
$3,598,000
5
bds
|
5
ba
|
5,120
sqft
|
built
1959
4710 N 41st Pl, Phoenix, AZ 85018
$-13,548
Cash flow
-19.6%
Cash-on-Cash Return
1.2%
Cap rate
0.2%
Rent to Value Ratio

Active
$565,000
3
bds
|
2
ba
|
1,460
sqft
|
built
1977
4136 E Eugie Ave, Phoenix, AZ 85032
$-760
Cash flow
-7.0%
Cash-on-Cash Return
4.1%
Cap rate
0.5%
Rent to Value Ratio
Pending
$260,000
2
bds
|
2
ba
|
1,037
sqft
|
built
1999
10030 W Indian School Rd, Phoenix, AZ 85037
$-395
Cash flow
-7.9%
Cash-on-Cash Return
3.9%
Cap rate
0.7%
Rent to Value Ratio
Active
$395,000
3
bds
|
2
ba
|
1,590
sqft
|
built
1967
3251 W Mercer Ln, Phoenix, AZ 85029
$-444
Cash flow
-5.9%
Cash-on-Cash Return
4.3%
Cap rate
0.6%
Rent to Value Ratio
Active
$4,895,000
7
bds
|
8
ba
|
6,916
sqft
|
built
1992
5051 E Lafayette Blvd, Phoenix, AZ 85018
$-18,841
Cash flow
-20.1%
Cash-on-Cash Return
1.1%
Cap rate
0.2%
Rent to Value Ratio
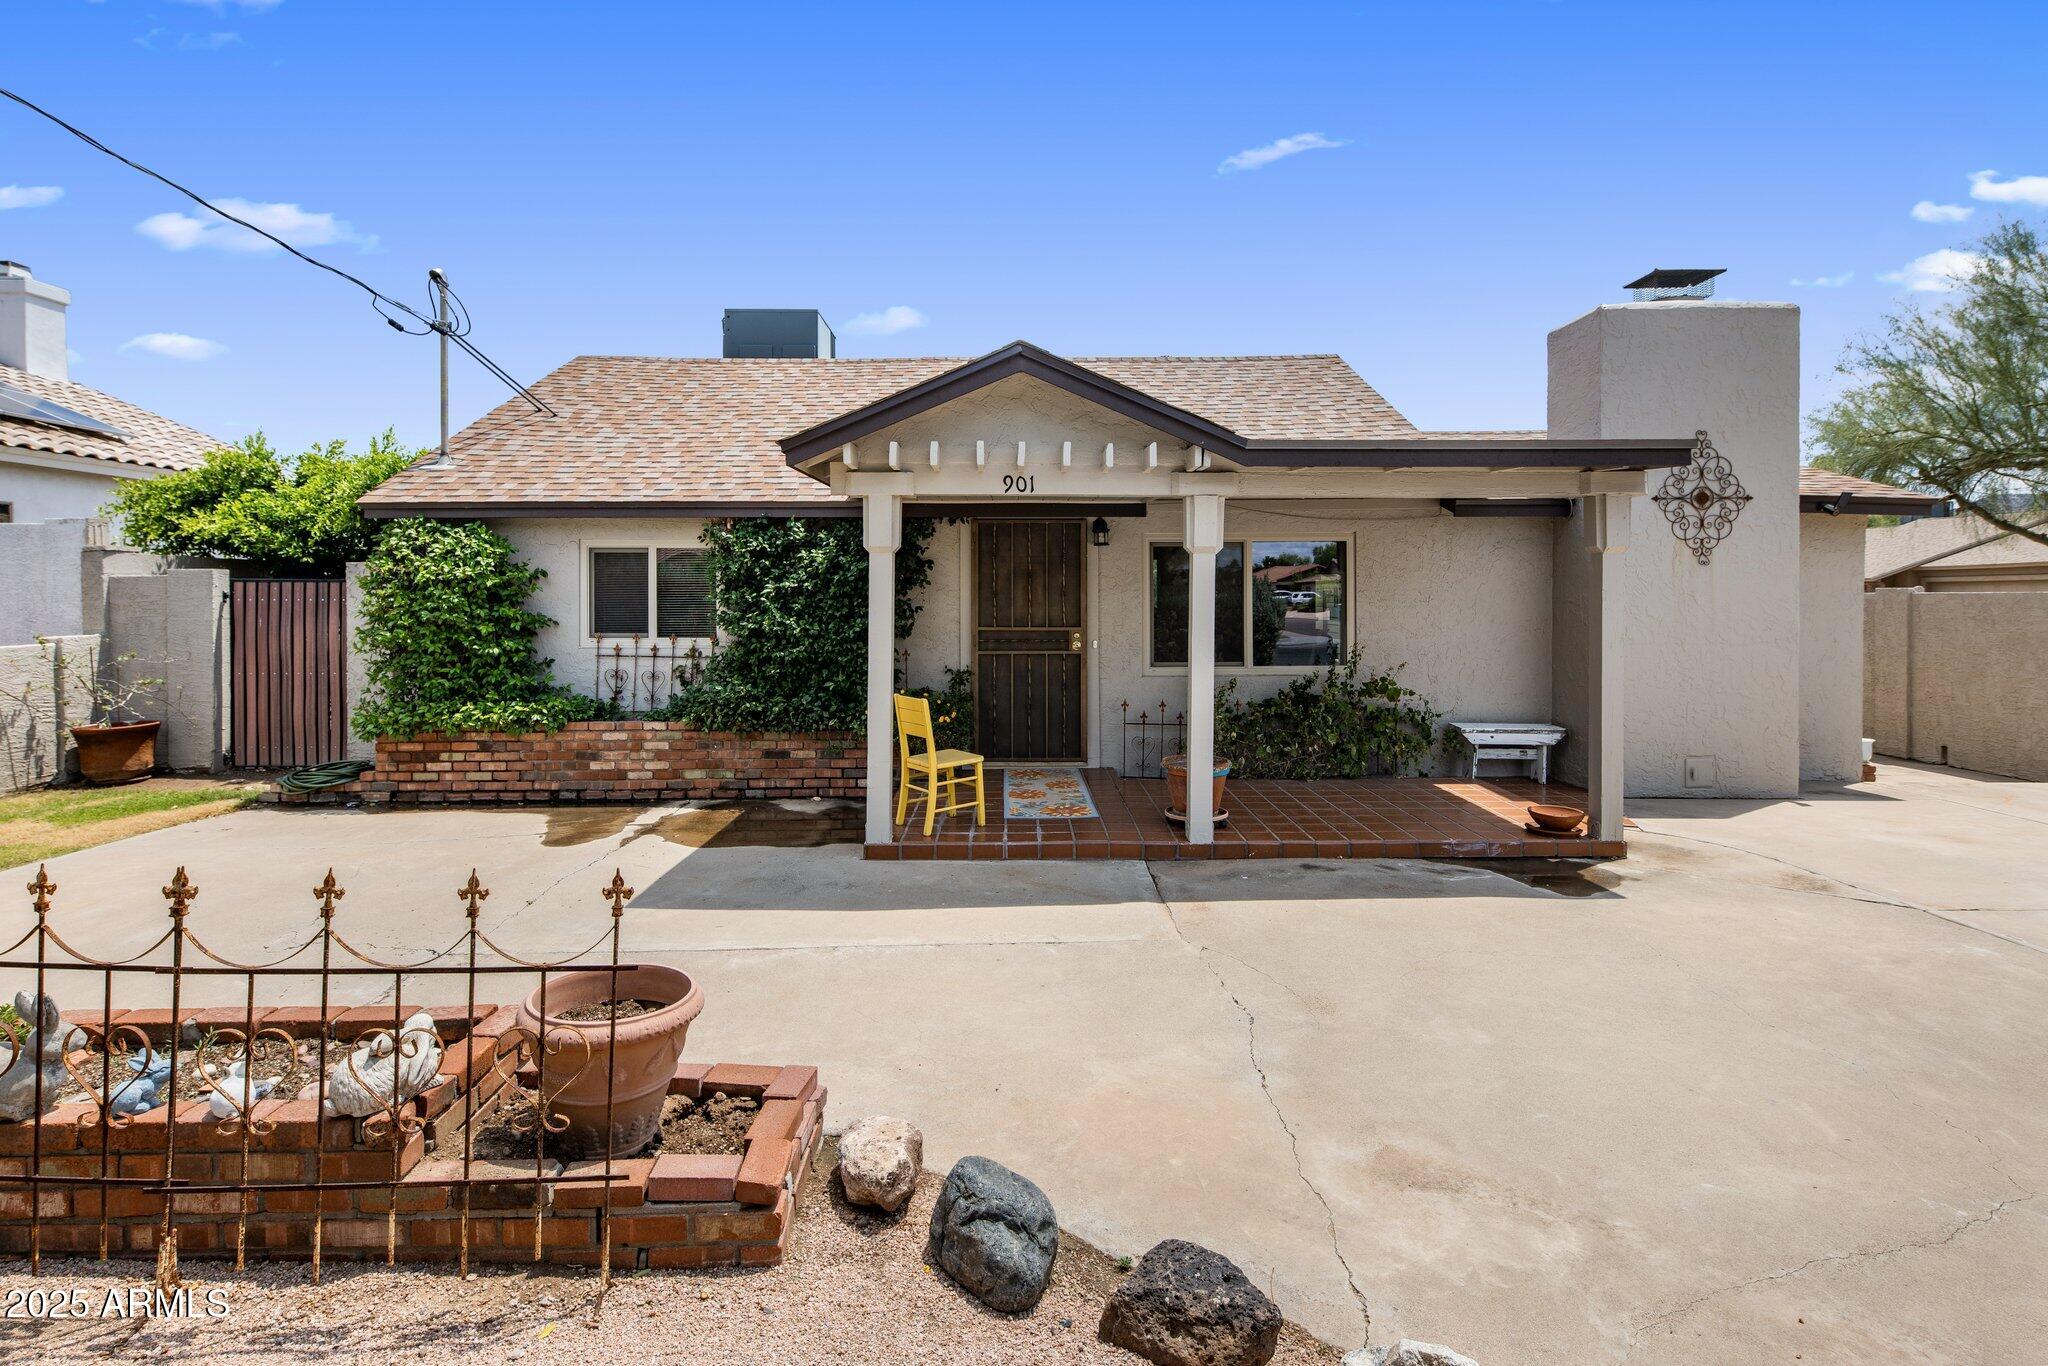
Active
$515,000
3
bds
|
2
ba
|
1,520
sqft
|
built
1957
901 E Hearn Rd, Phoenix, AZ 85022
$-1,053
Cash flow
-10.7%
Cash-on-Cash Return
3.2%
Cap rate
0.4%
Rent to Value Ratio

Active under contract
$1,650,000
4
bds
|
4
ba
|
2,798
sqft
|
built
2020
3808 E Fairmount Ave, Phoenix, AZ 85018
$-1,482
Cash flow
-4.7%
Cash-on-Cash Return
4.6%
Cap rate
0.6%
Rent to Value Ratio

Active
$895,000
4
bds
|
2
ba
|
2,172
sqft
|
built
2004
37918 N 21st Ave, Phoenix, AZ 85086
$-2,055
Cash flow
-12.0%
Cash-on-Cash Return
2.9%
Cap rate
0.4%
Rent to Value Ratio
Active
$549,000
3
bds
|
2
ba
|
1,851
sqft
|
built
1970
3444 E Paradise Dr, Phoenix, AZ 85028
$-1,155
Cash flow
-11.0%
Cash-on-Cash Return
3.2%
Cap rate
0.4%
Rent to Value Ratio
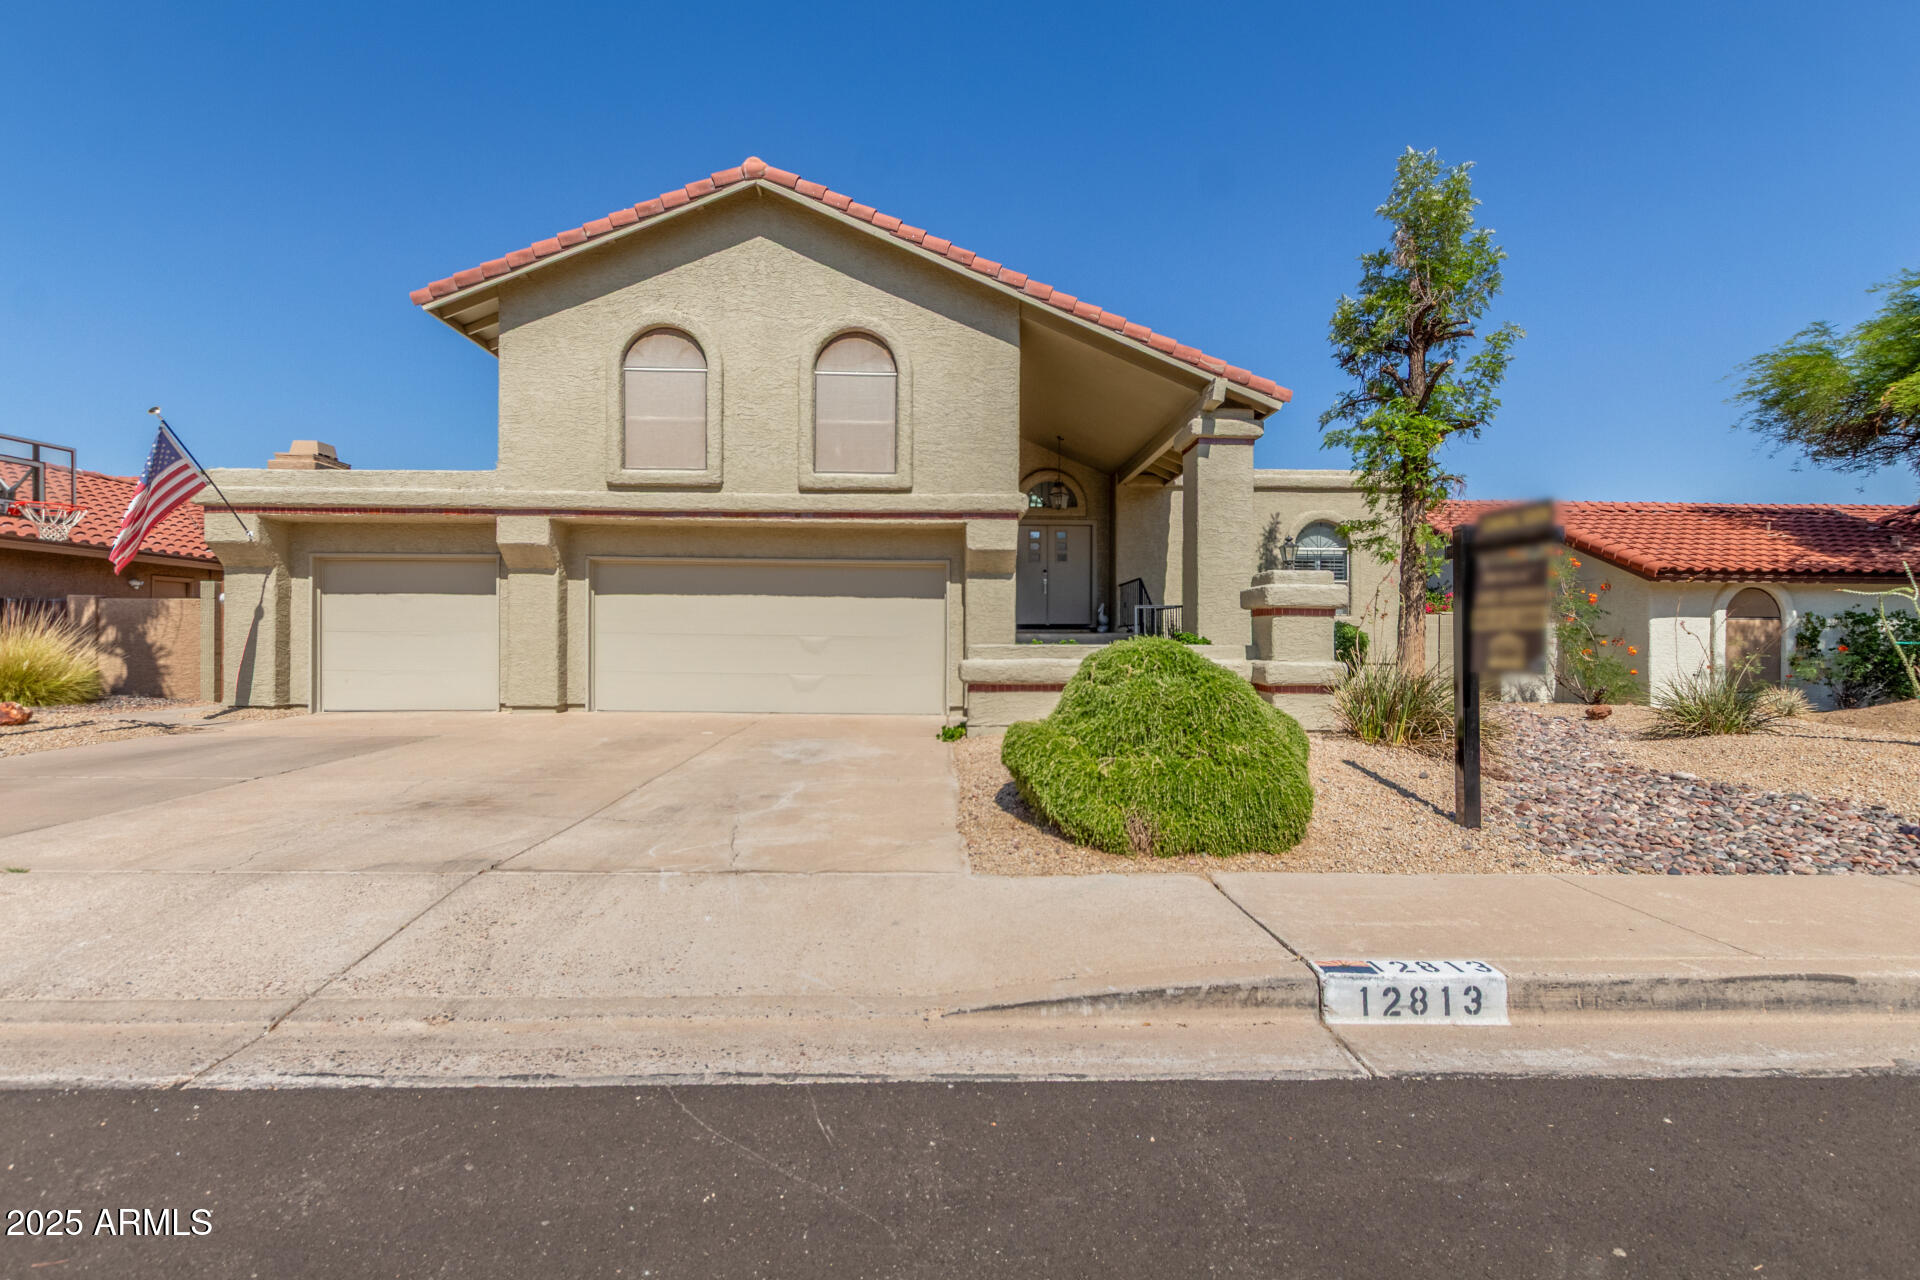
Active
$620,000
4
bds
|
3
ba
|
2,264
sqft
|
built
1986
12813 S 38th St, Phoenix, AZ 85044
$-1,059
Cash flow
-8.9%
Cash-on-Cash Return
3.6%
Cap rate
0.5%
Rent to Value Ratio
Active under contract
$685,000
3
bds
|
2
ba
|
1,603
sqft
|
built
1957
125 E Loma Ln, Phoenix, AZ 85020
$-1,561
Cash flow
-11.9%
Cash-on-Cash Return
2.9%
Cap rate
0.4%
Rent to Value Ratio

Active
$697,000
4
bds
|
2
ba
|
2,204
sqft
|
built
1978
14830 N 28th Pl, Phoenix, AZ 85032
$-1,604
Cash flow
-12.0%
Cash-on-Cash Return
2.9%
Cap rate
0.4%
Rent to Value Ratio
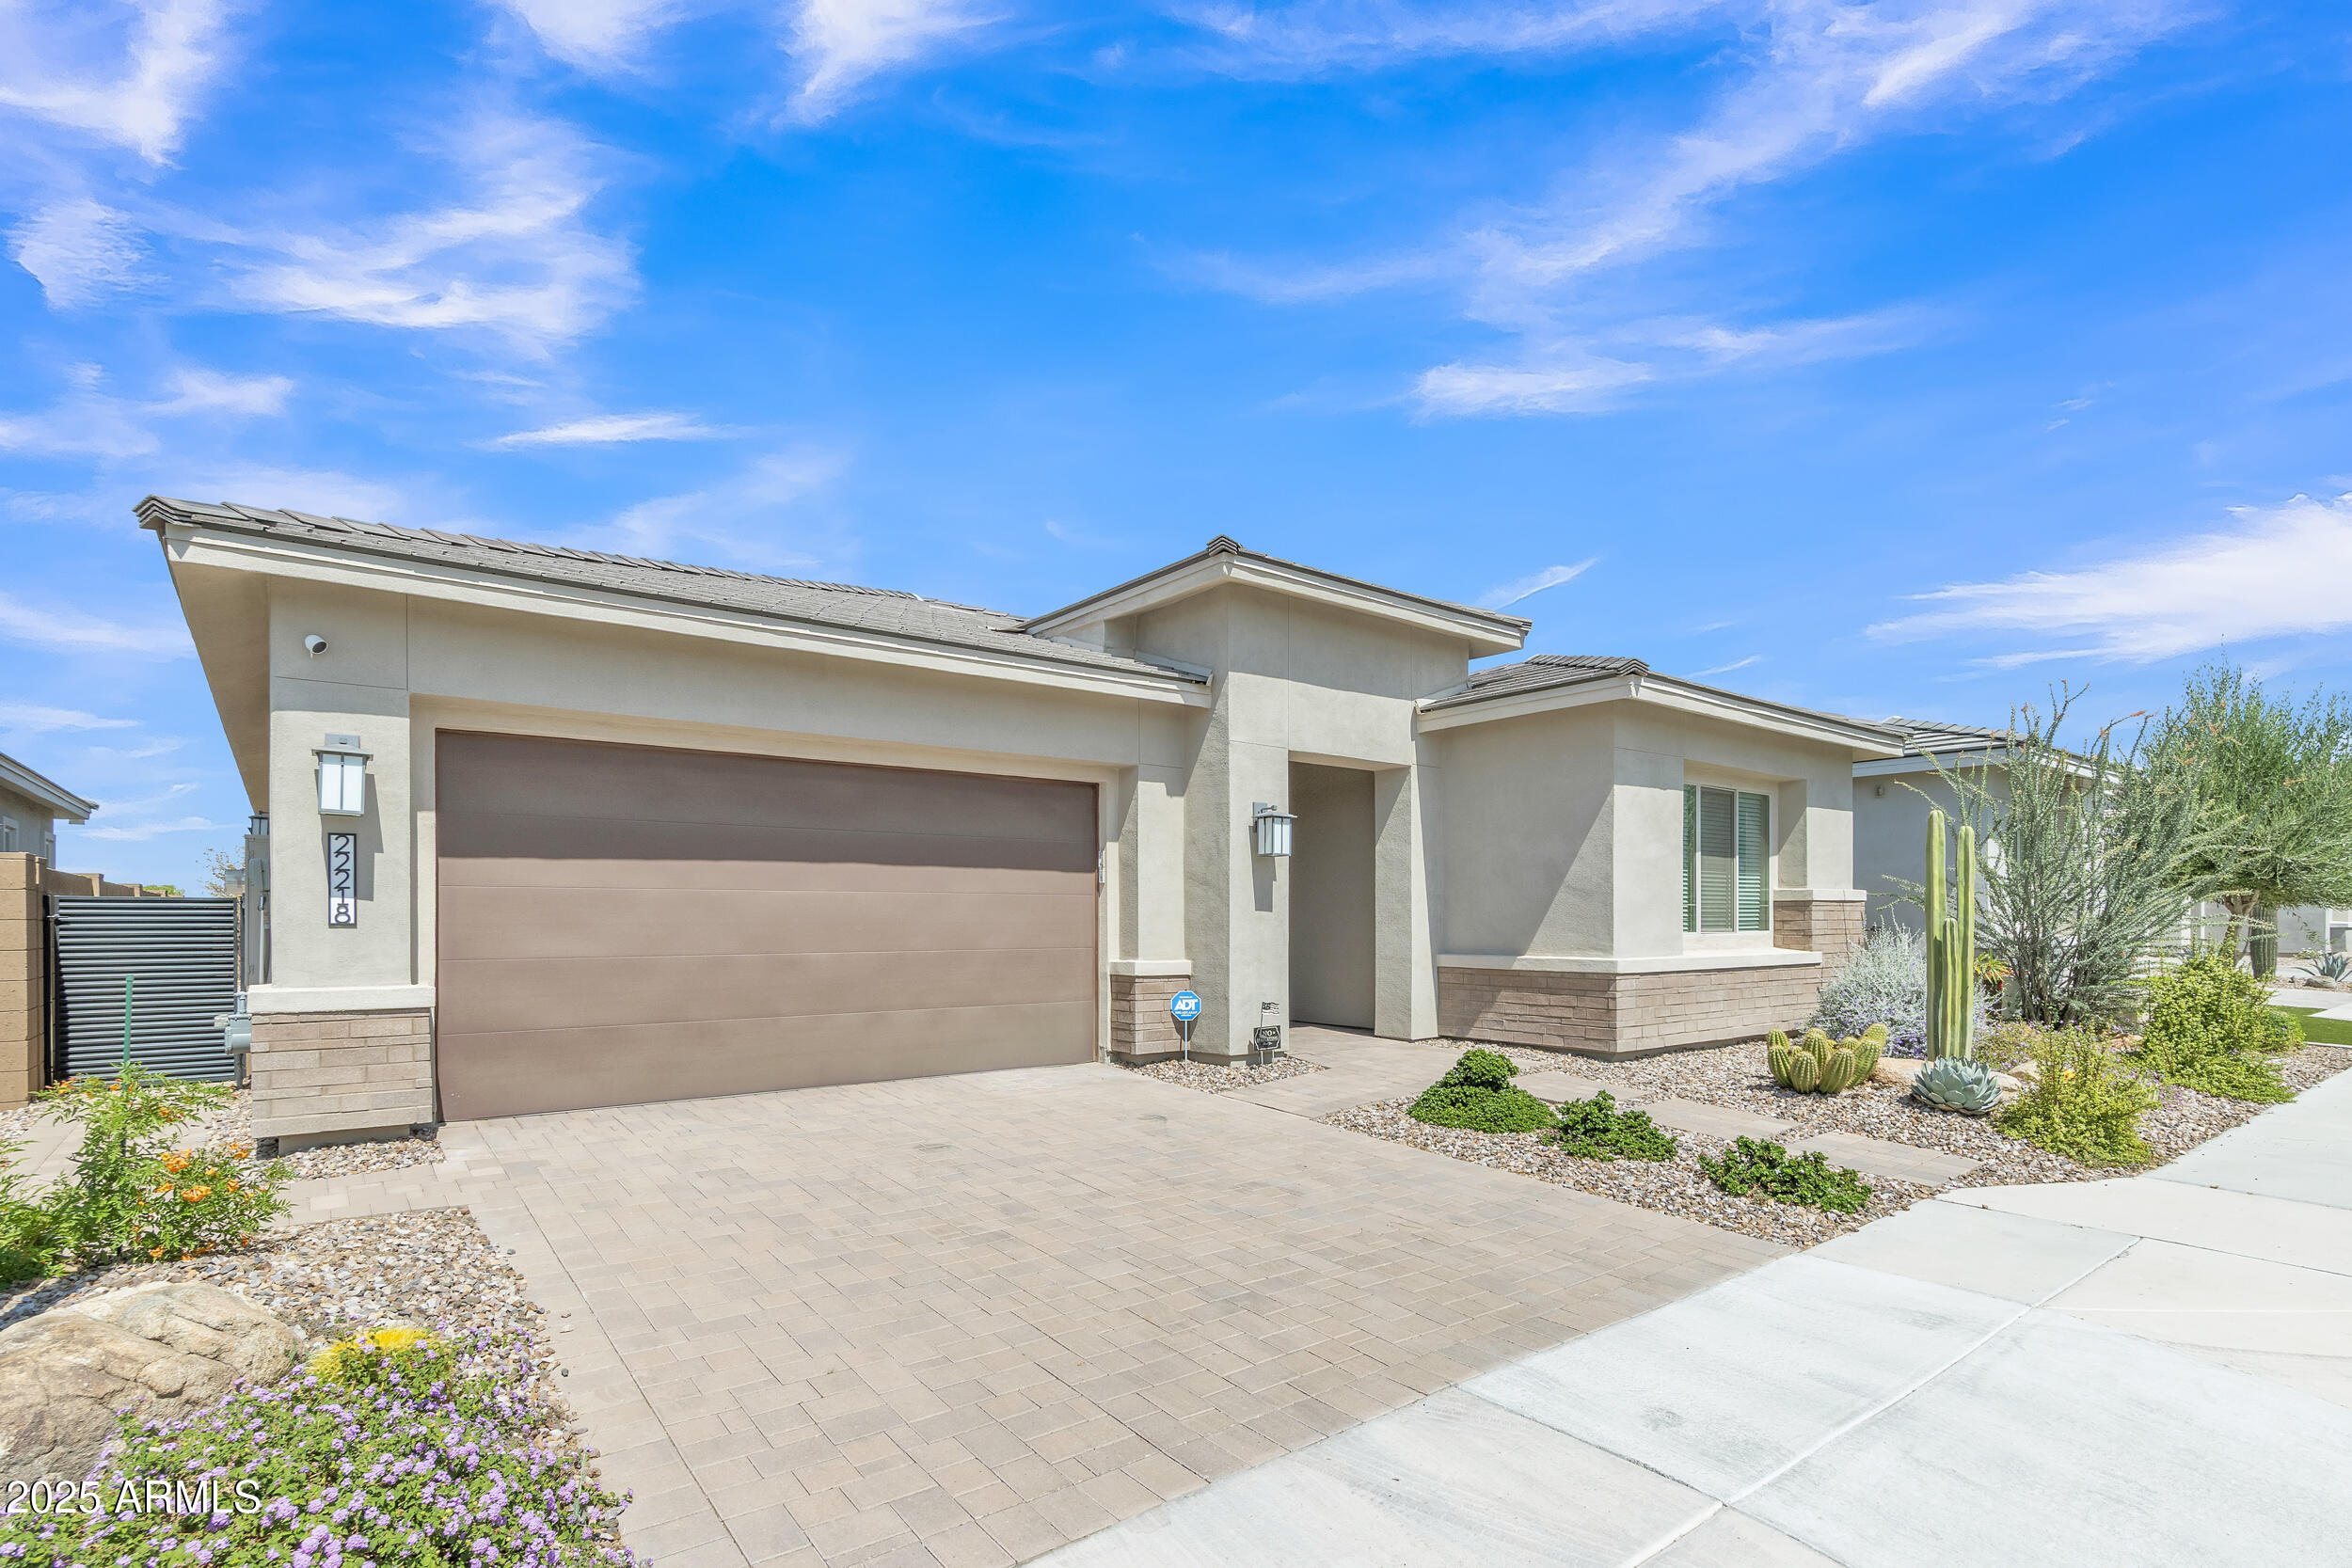
Active
$974,999
3
bds
|
3
ba
|
2,380
sqft
|
built
2020
22218 N 28th St, Phoenix, AZ 85050
$-2,768
Cash flow
-14.8%
Cash-on-Cash Return
2.3%
Cap rate
0.4%
Rent to Value Ratio
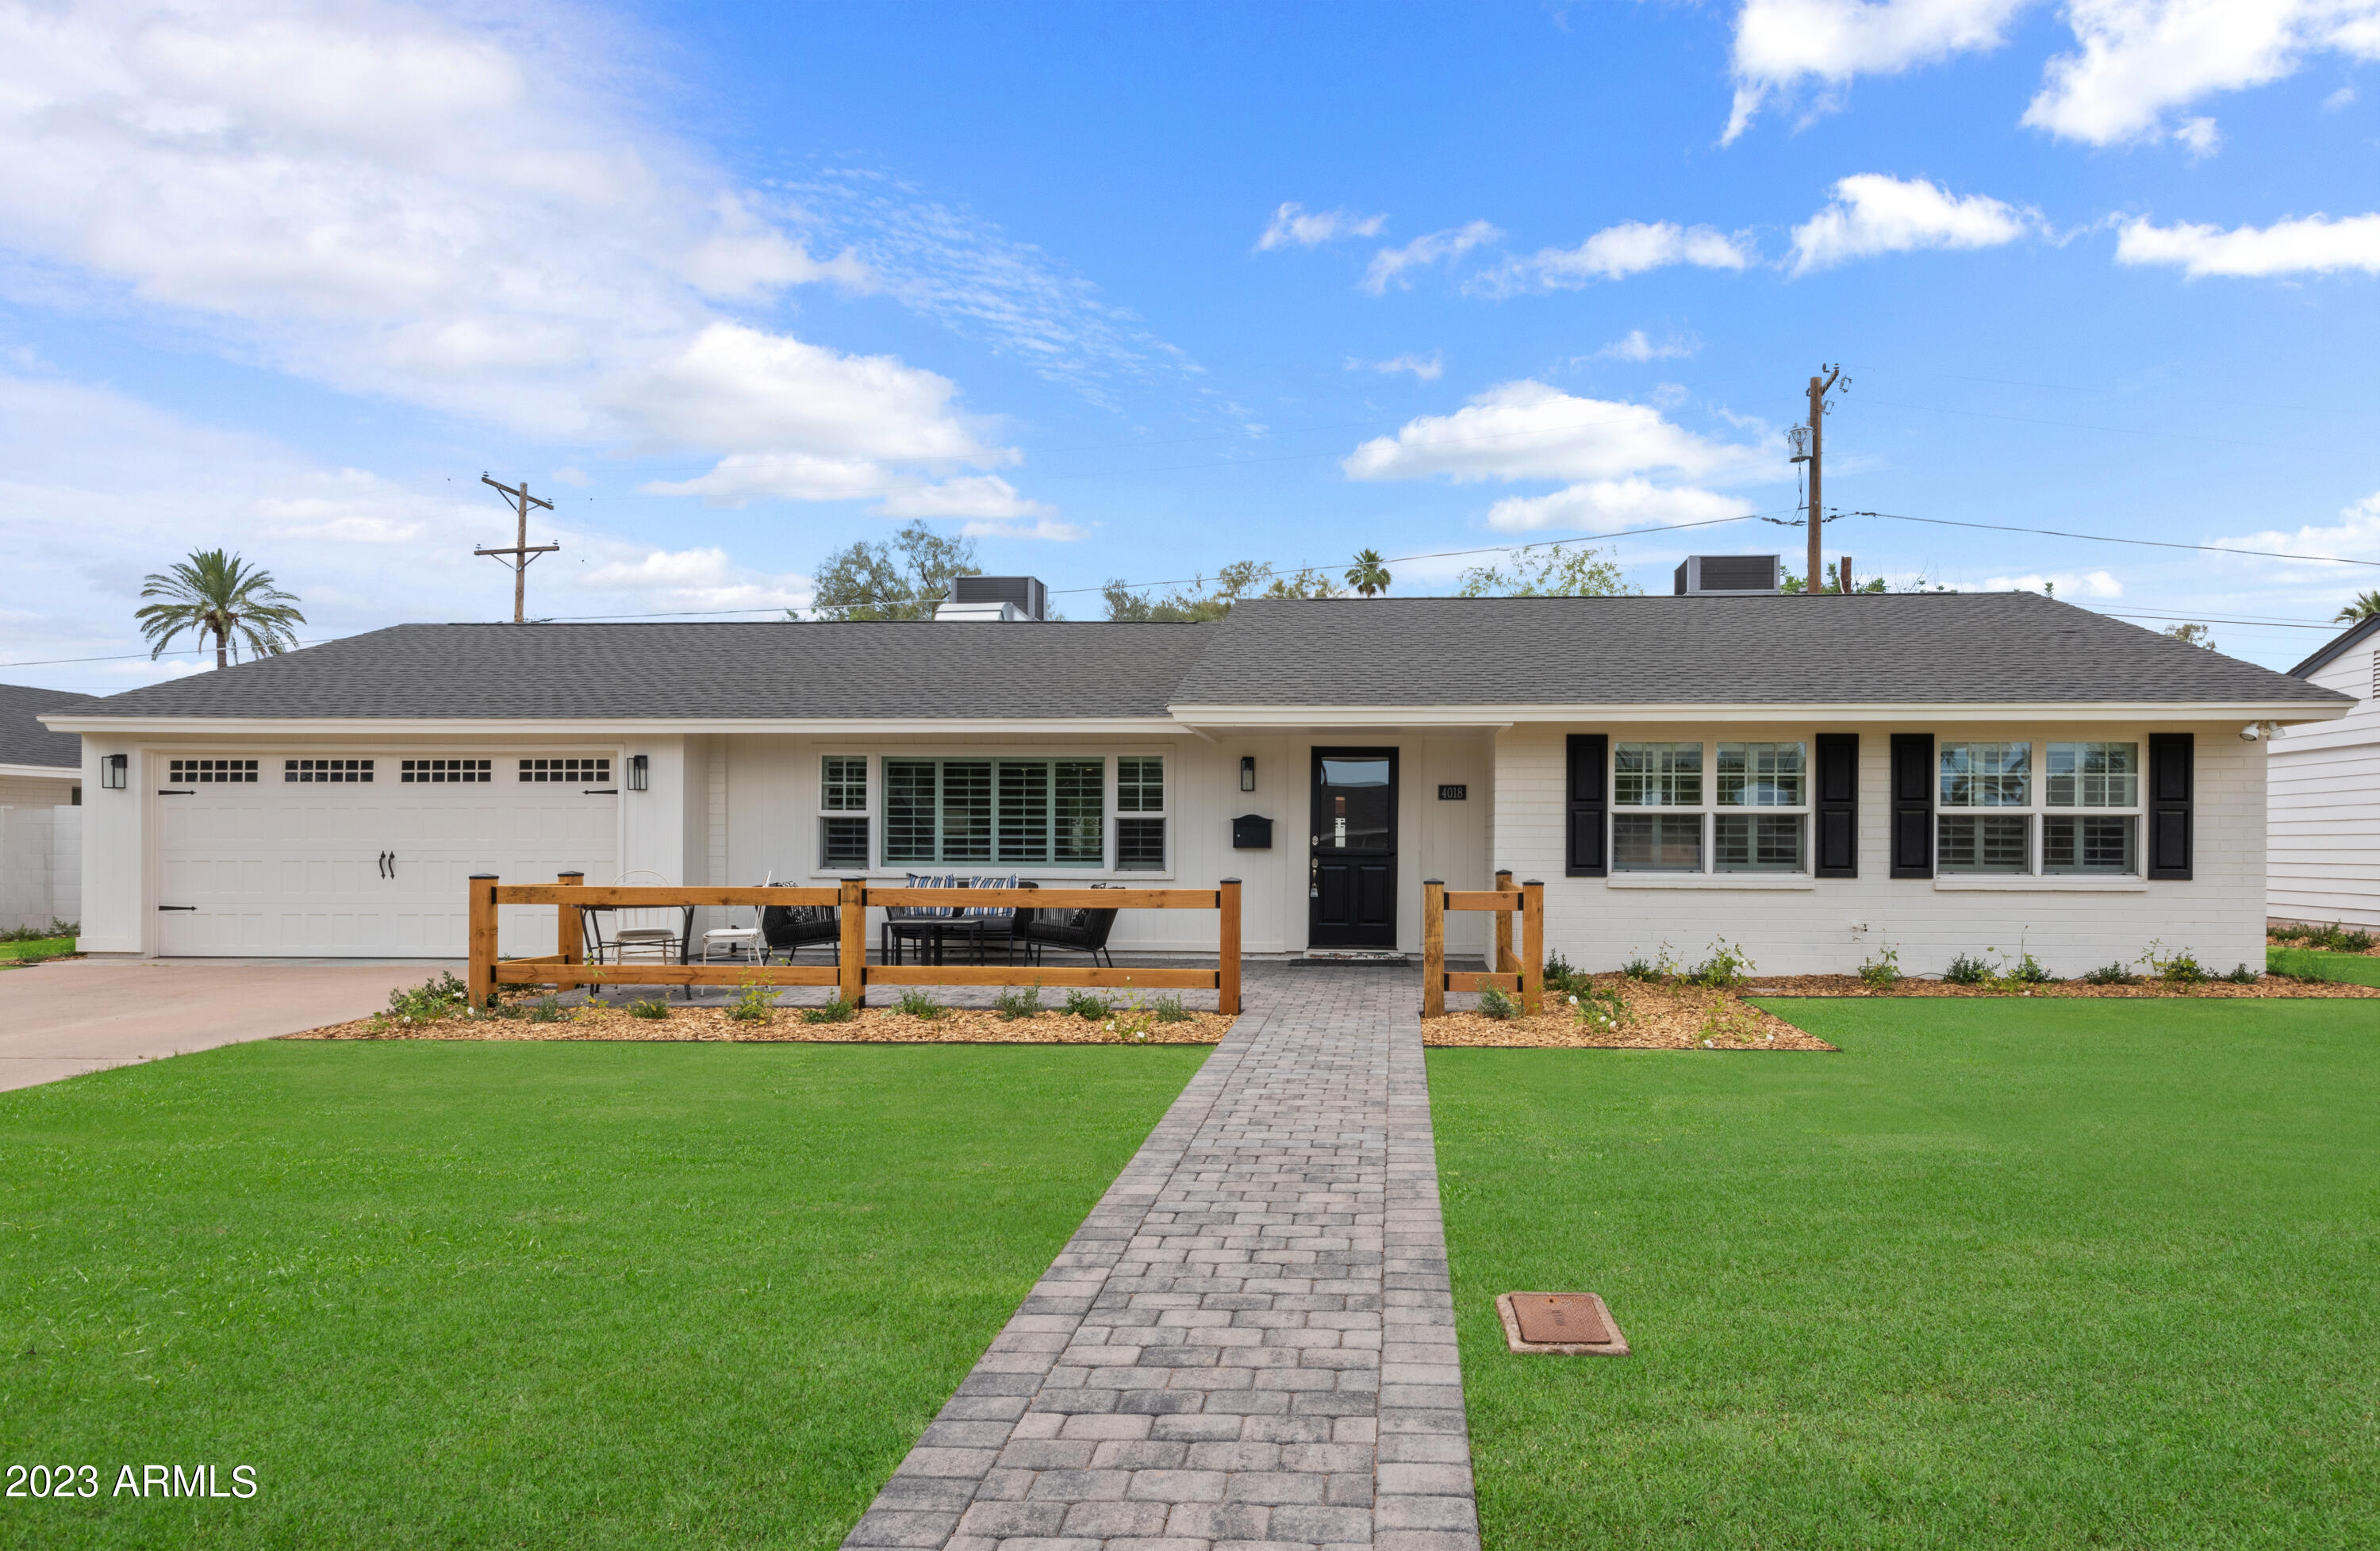
Active
$1,685,000
4
bds
|
2
ba
|
2,548
sqft
|
built
1958
4018 E Coolidge St, Phoenix, AZ 85018
$-4,352
Cash flow
-13.5%
Cash-on-Cash Return
2.6%
Cap rate
0.3%
Rent to Value Ratio