Phoenix, AZ Investment Properties for Sale
Browse homes for sale and investment properties in Phoenix, AZ. Refine your search by price, property type, or more.
Best cash flowing properties in Phoenix, AZ

Active
$290,000
3
bds
|
2
ba
|
1,176
sqft
|
built
1955
8724 N 28th Ave, Phoenix, AZ 85051
$-184
Cash flow
-3.3%
Cash-on-Cash Return
4.9%
Cap rate
0.6%
Rent to Value Ratio
Active
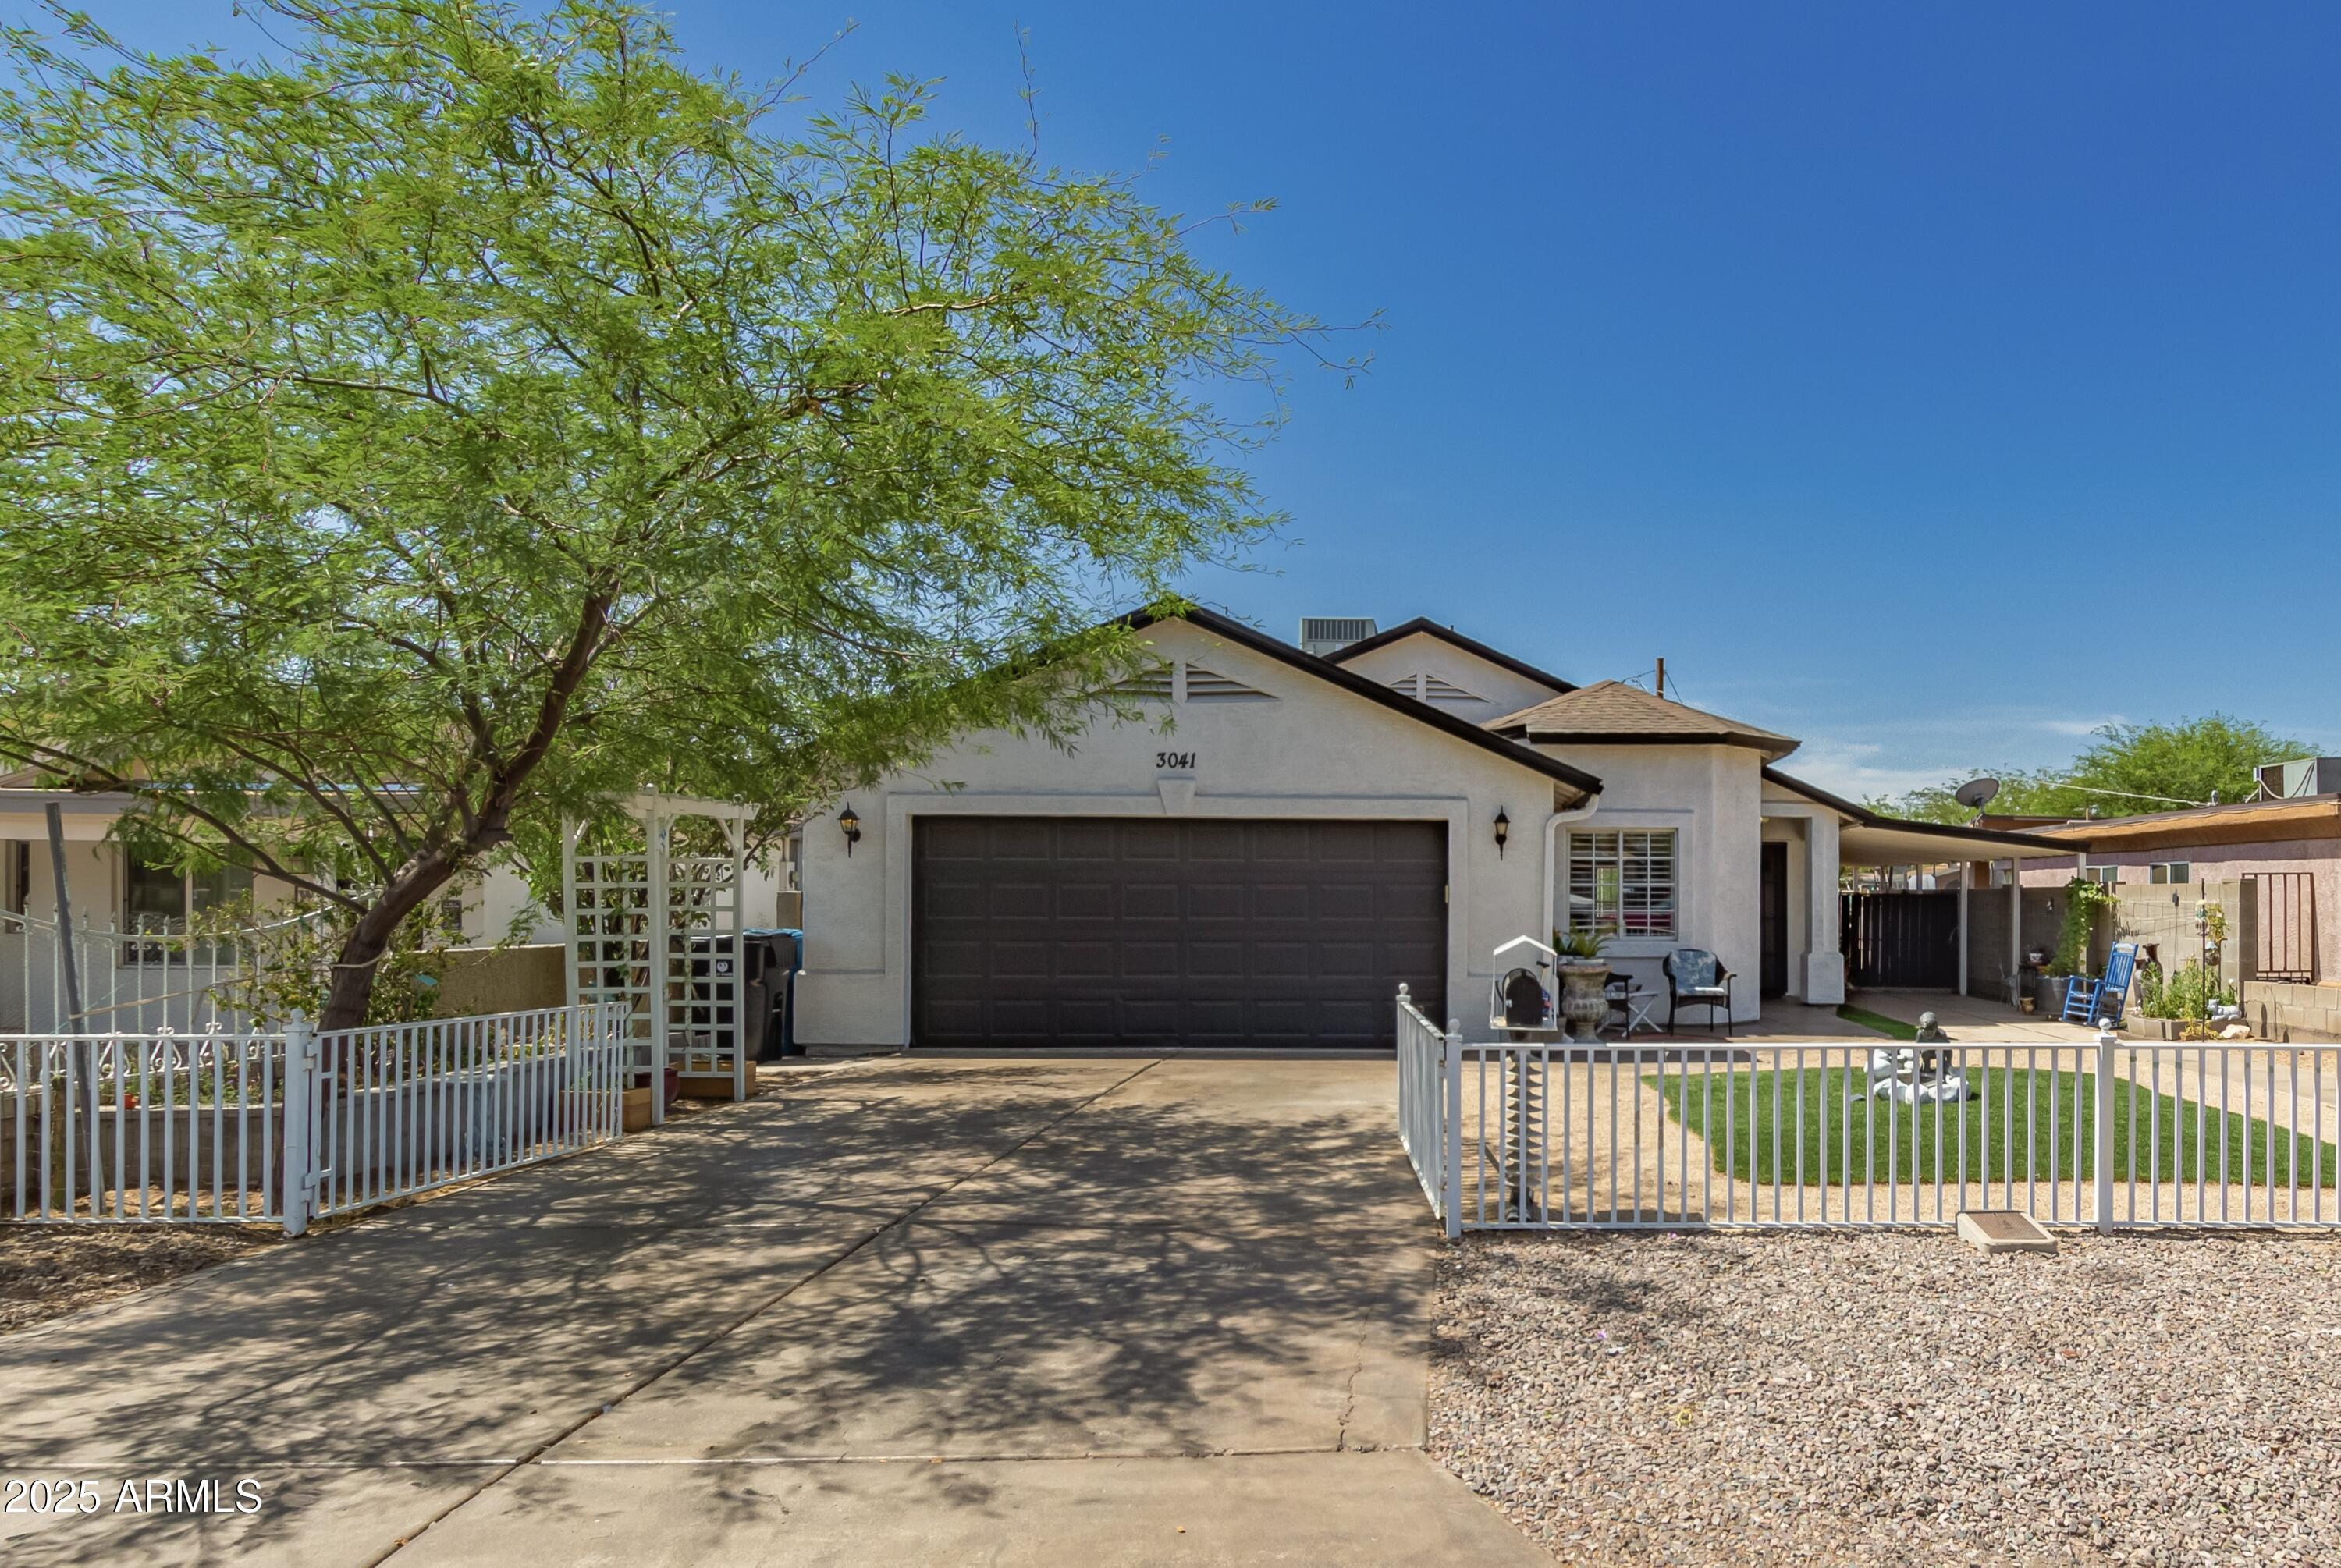
$375,000
3
bds
|
2
ba
|
1,337
sqft
|
built
2002
3041 W Palm Ln, Phoenix, AZ 85009
$-484
Cash flow
-6.7%
Cash-on-Cash Return
4.1%
Cap rate
0.5%
Rent to Value Ratio
3,676 out of 3,963 properties for sale in Phoenix, AZ
Limited Results Shown
Create a free account, or log in to reveal all property listings and enjoy the complete experience.
Active
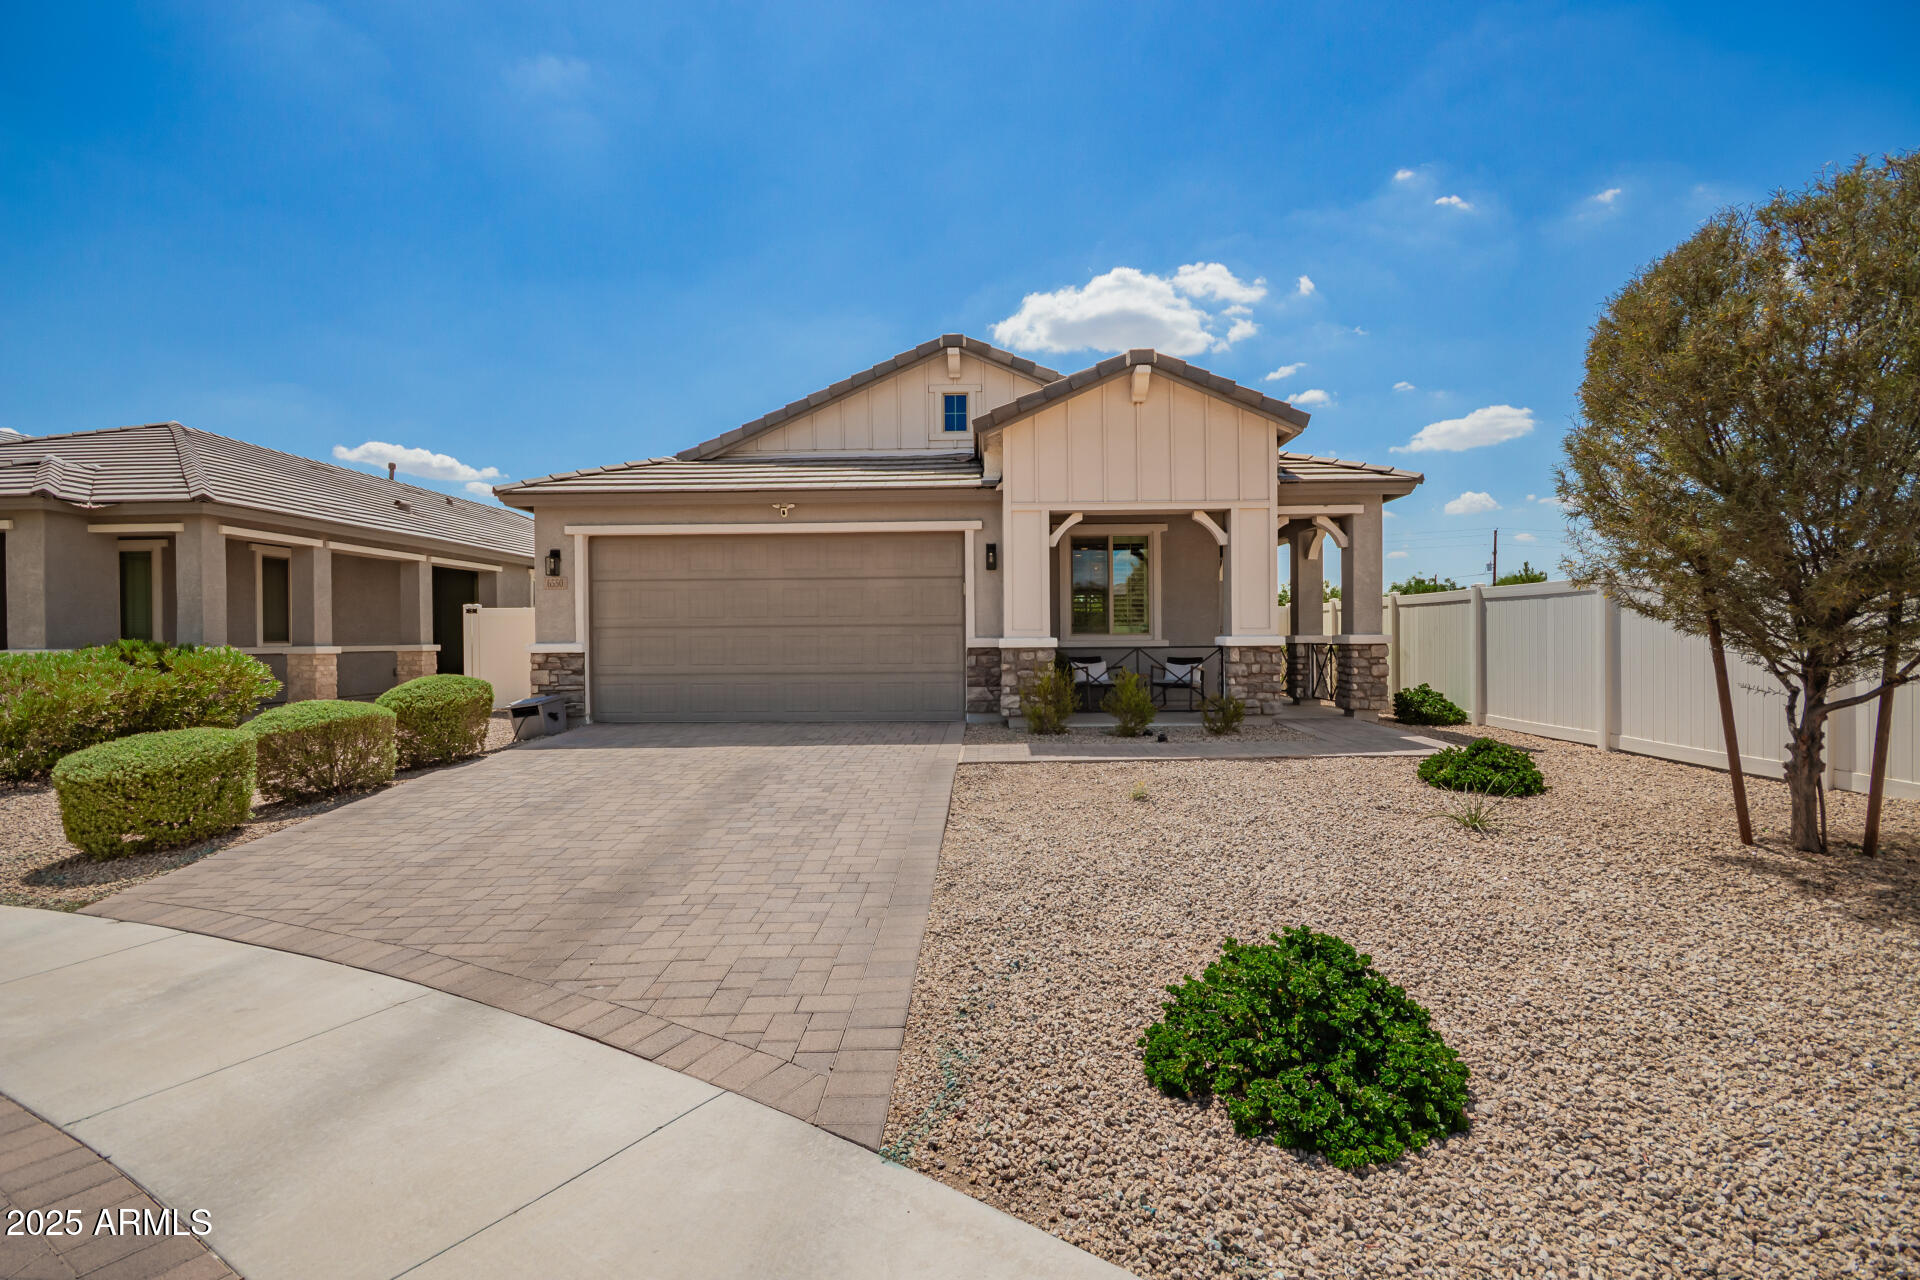
$483,500
4
bds
|
2
ba
|
1,879
sqft
|
built
2019
6550 S 24th Pl, Phoenix, AZ 85042
$-998
Cash flow
-10.8%
Cash-on-Cash Return
3.2%
Cap rate
0.5%
Rent to Value Ratio

Active
$630,000
2
bds
|
3
ba
|
1,718
sqft
|
built
2016
325 E Coronado Rd, Phoenix, AZ 85004
$-1,527
Cash flow
-12.6%
Cash-on-Cash Return
2.8%
Cap rate
0.5%
Rent to Value Ratio
Active
$575,000
4
bds
|
3
ba
|
1,927
sqft
|
built
1997
4002 E Agave Rd, Phoenix, AZ 85044
$-1,315
Cash flow
-11.9%
Cash-on-Cash Return
2.9%
Cap rate
0.5%
Rent to Value Ratio
Active
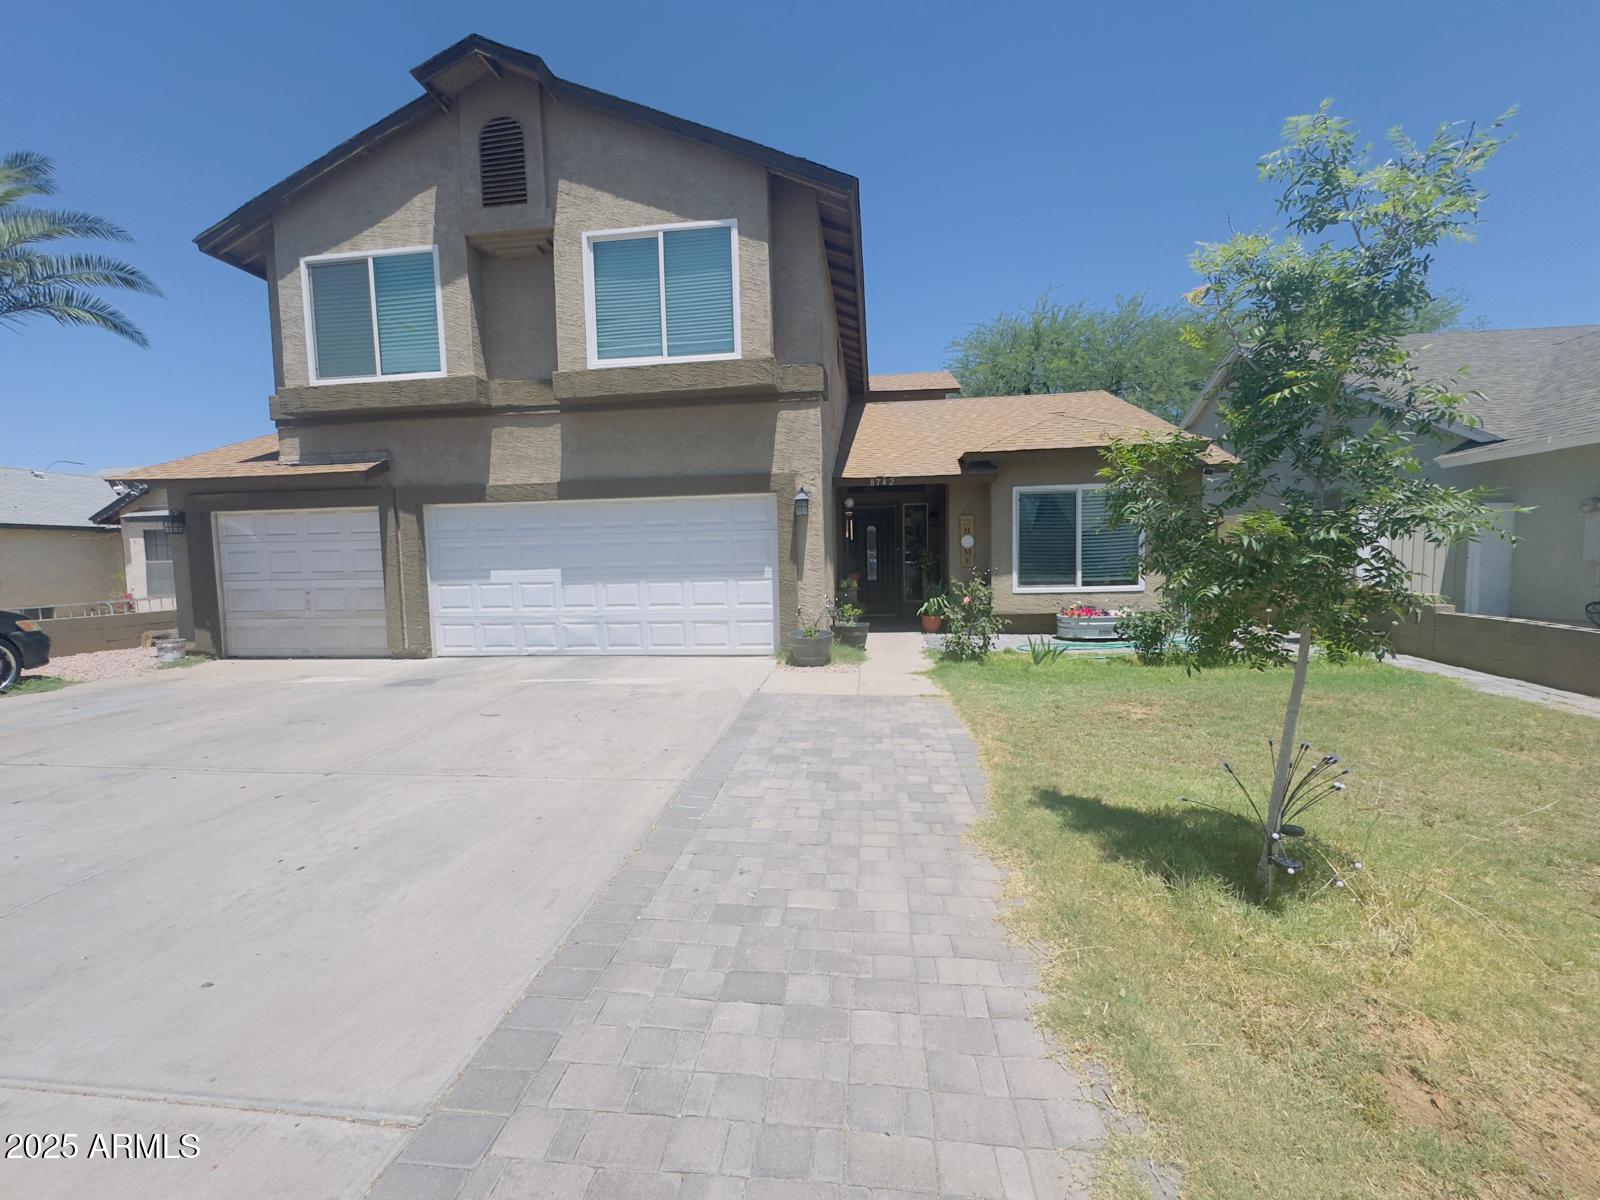
$485,000
4
bds
|
2
ba
|
2,302
sqft
|
built
1990
8742 W Edgemont Ave, Phoenix, AZ 85037
$-901
Cash flow
-9.7%
Cash-on-Cash Return
3.4%
Cap rate
0.5%
Rent to Value Ratio
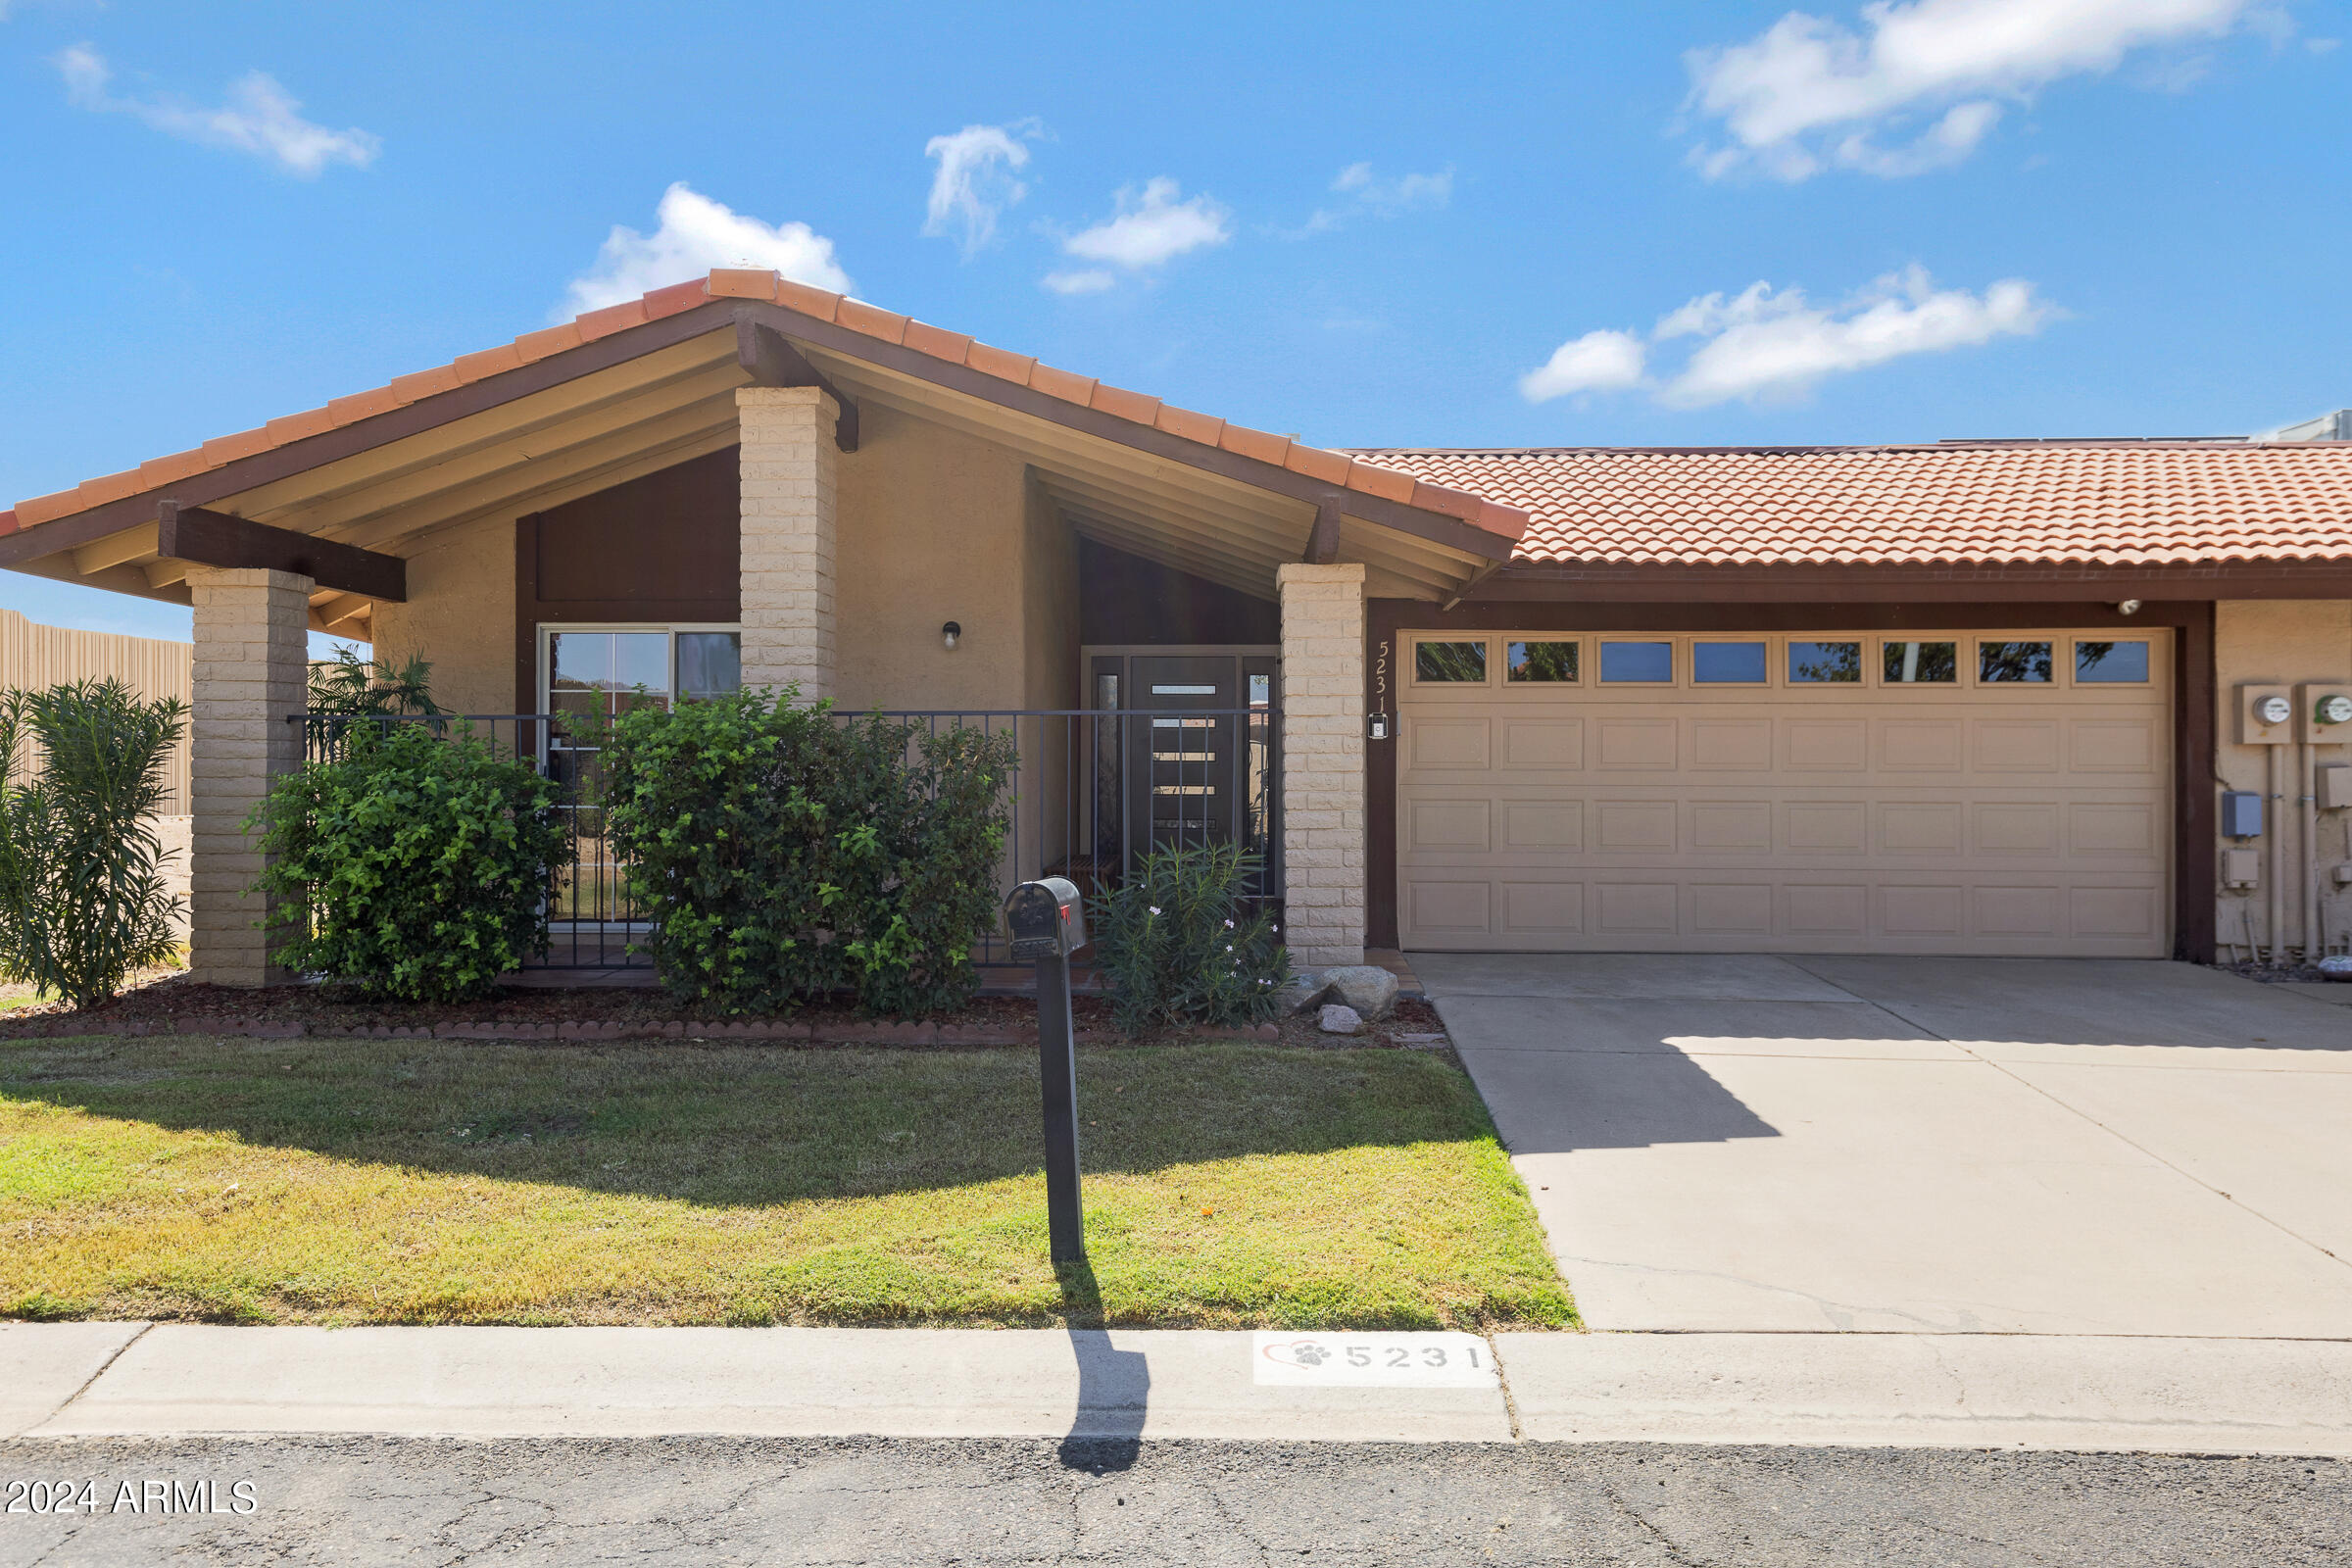
Active
$449,900
2
bds
|
2
ba
|
1,754
sqft
|
built
1974
5231 E Tamblo Dr, Phoenix, AZ 85044
$-802
Cash flow
-9.3%
Cash-on-Cash Return
3.5%
Cap rate
0.6%
Rent to Value Ratio
Active
$1,550,000
5
bds
|
5
ba
|
3,857
sqft
|
built
2021
3408 E Daley Ln, Phoenix, AZ 85050
$-5,023
Cash flow
-16.9%
Cash-on-Cash Return
1.8%
Cap rate
0.3%
Rent to Value Ratio

Active
$430,000
3
bds
|
3
ba
|
1,733
sqft
|
built
2019
3900 E Baseline Rd, Phoenix, AZ 85042
$-668
Cash flow
-8.1%
Cash-on-Cash Return
3.8%
Cap rate
0.7%
Rent to Value Ratio
Active
$609,999
4
bds
|
3
ba
|
2,389
sqft
|
built
2001
6847 S 27th Pl, Phoenix, AZ 85042
$-1,499
Cash flow
-12.8%
Cash-on-Cash Return
2.7%
Cap rate
0.5%
Rent to Value Ratio
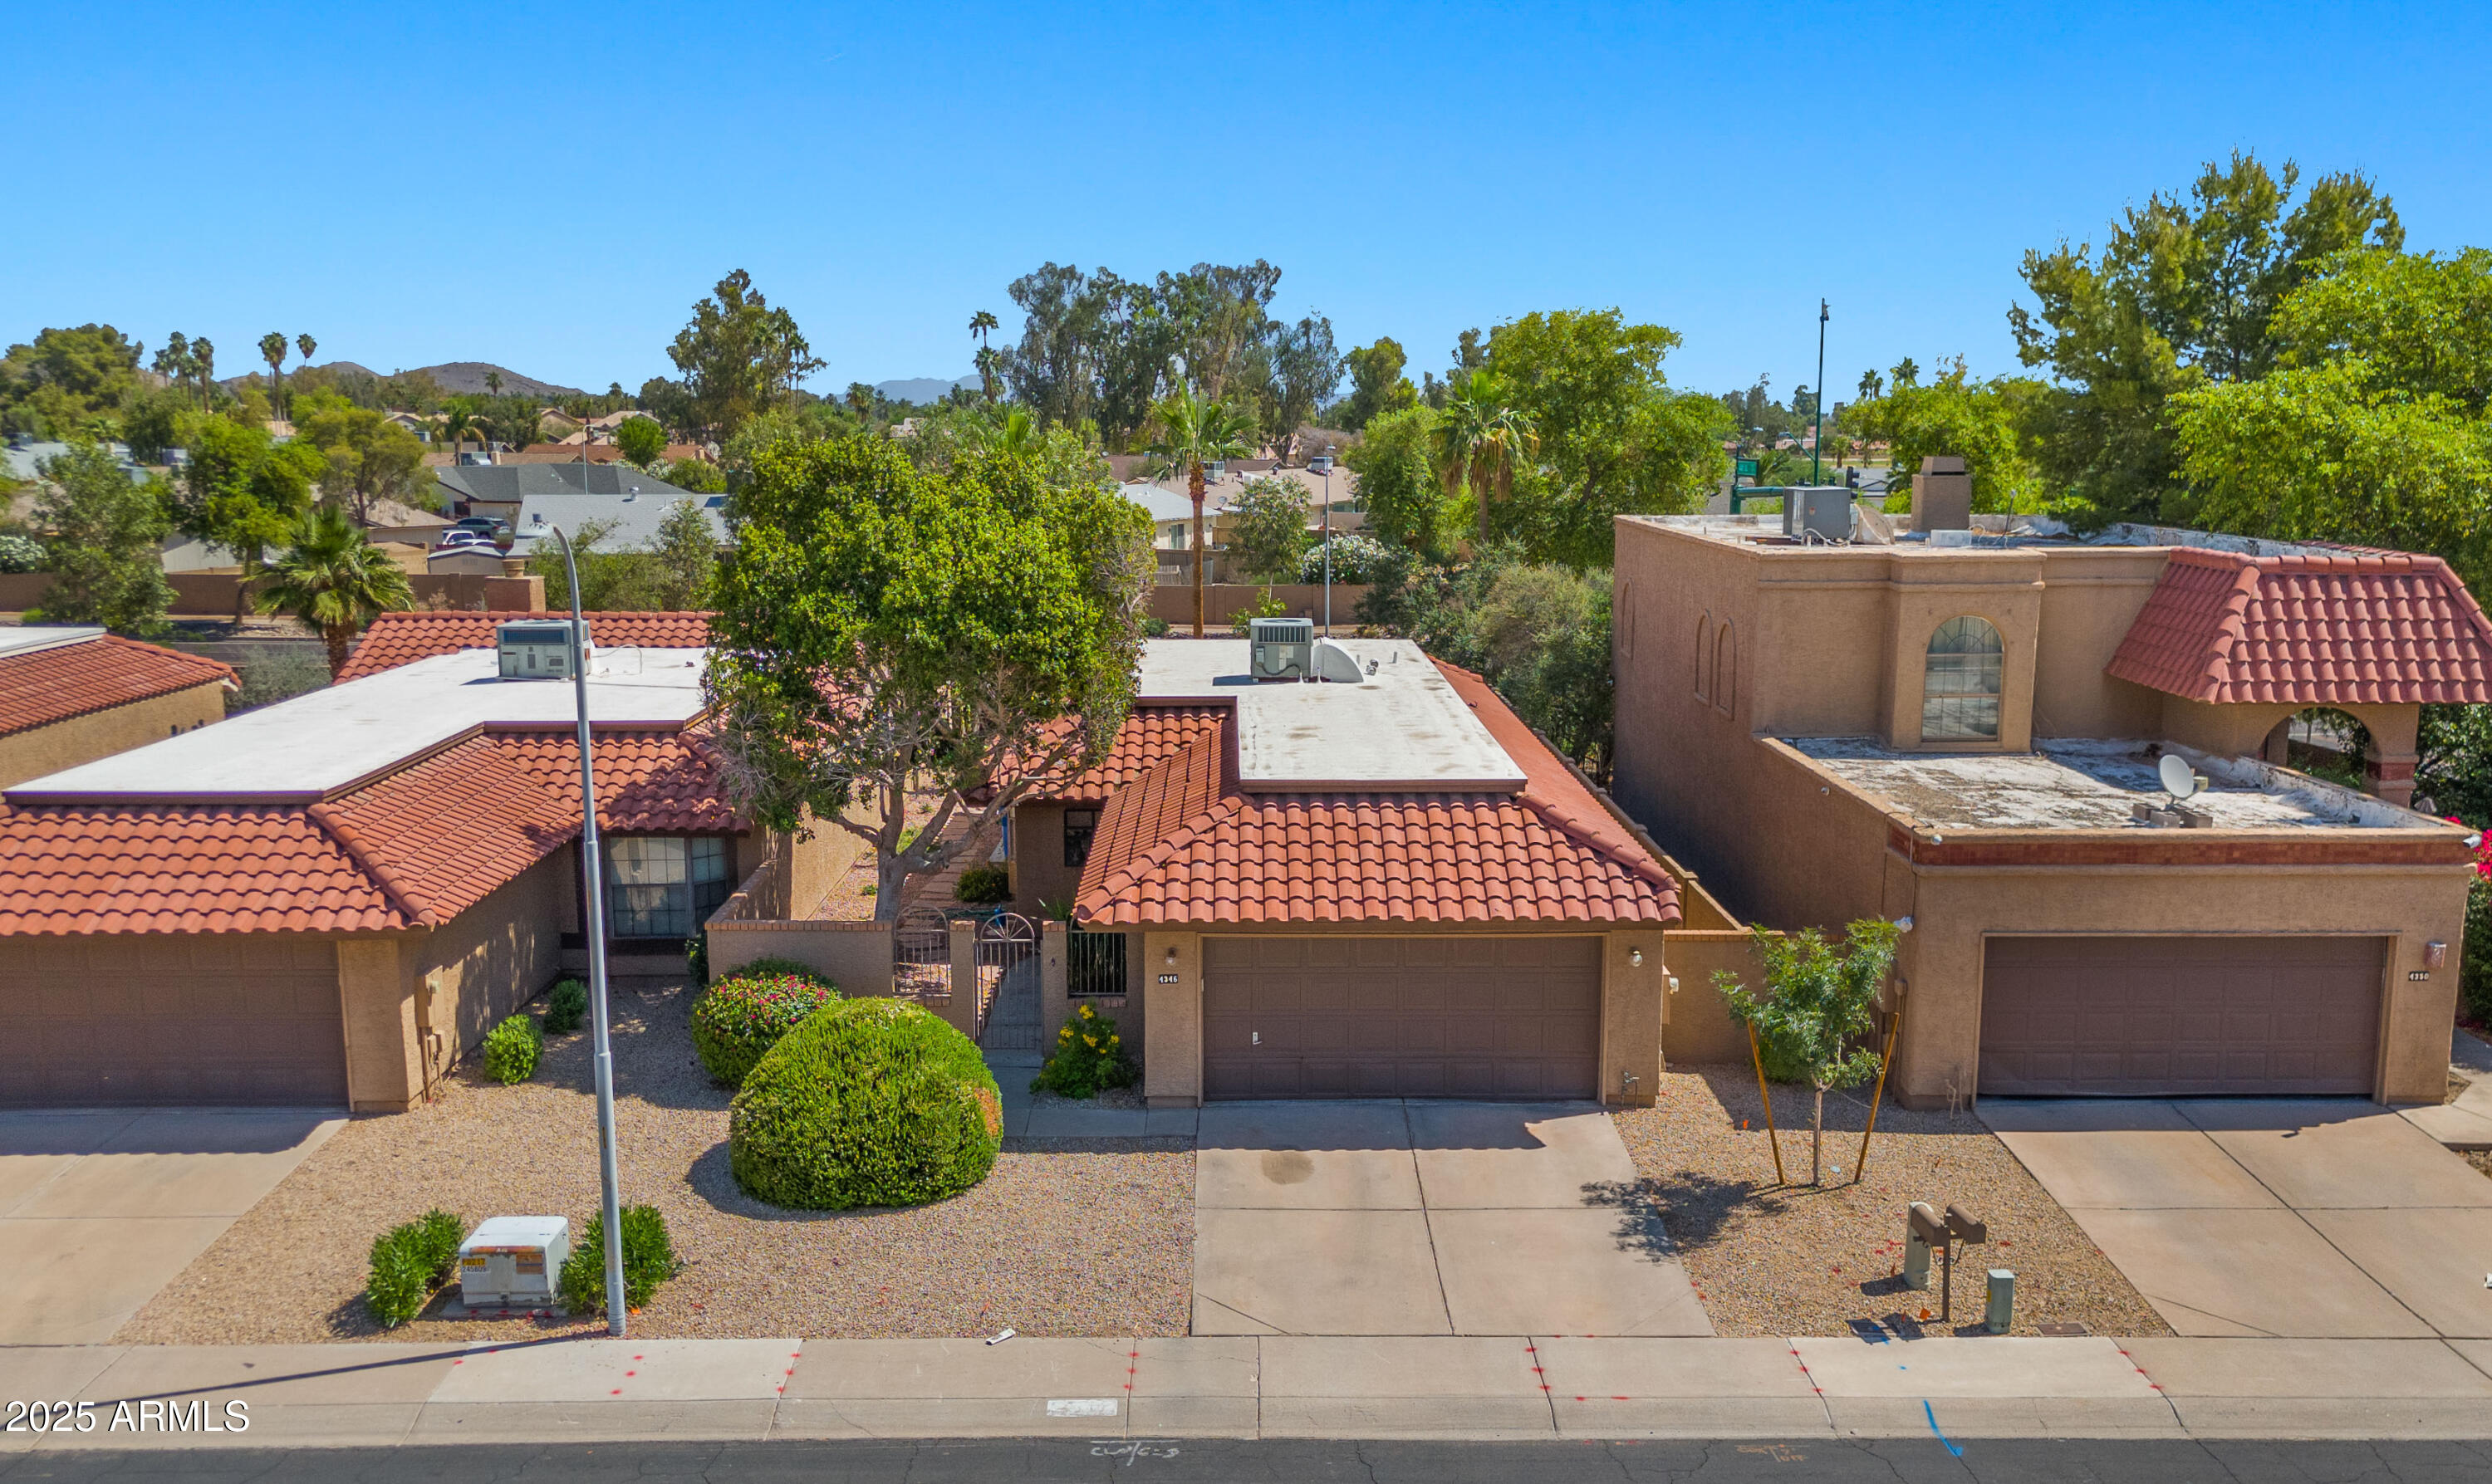
Active
$399,900
2
bds
|
2
ba
|
1,121
sqft
|
built
1985
4346 E Bannock St, Phoenix, AZ 85044
$-784
Cash flow
-10.2%
Cash-on-Cash Return
3.3%
Cap rate
0.5%
Rent to Value Ratio
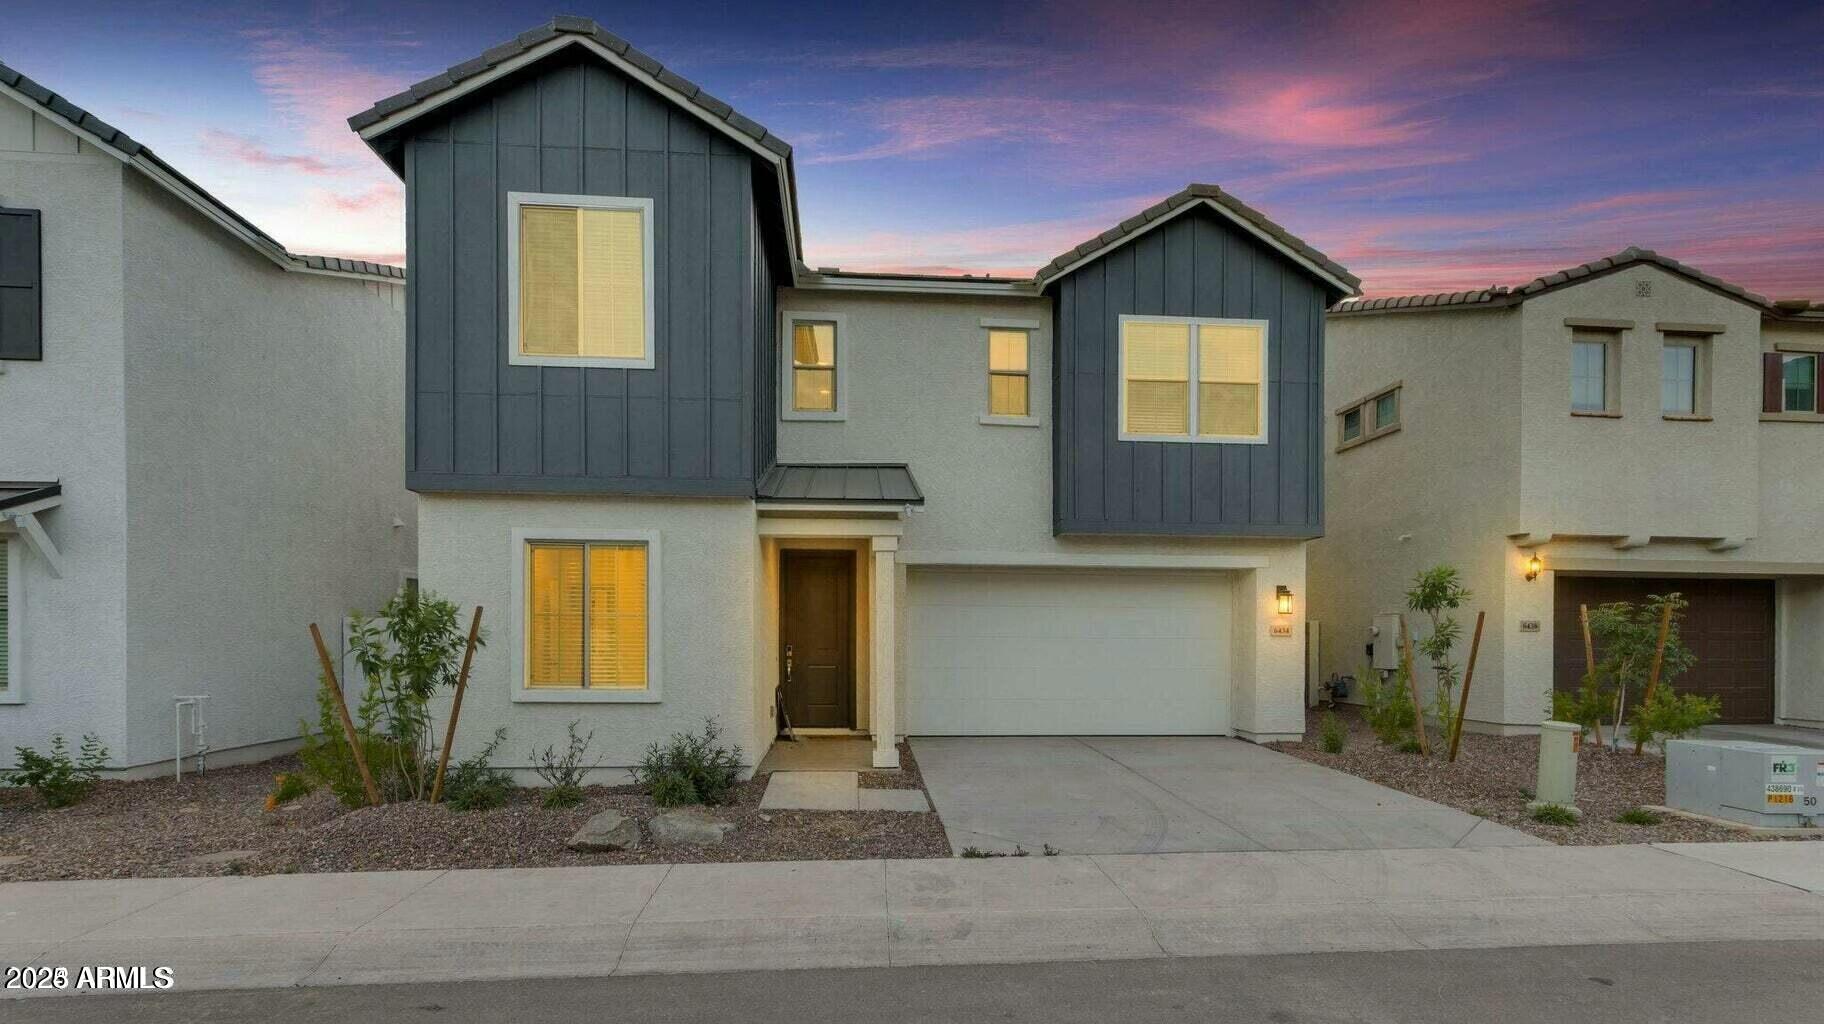
Active
$879,000
5
bds
|
3
ba
|
2,393
sqft
|
built
2022
6434 S 17th St, Phoenix, AZ 85042
$-3,149
Cash flow
-18.7%
Cash-on-Cash Return
1.4%
Cap rate
0.3%
Rent to Value Ratio

Active
$600,000
4
bds
|
3
ba
|
2,041
sqft
|
built
1995
16823 S 24th Pl, Phoenix, AZ 85048
$-1,192
Cash flow
-10.4%
Cash-on-Cash Return
3.3%
Cap rate
0.5%
Rent to Value Ratio
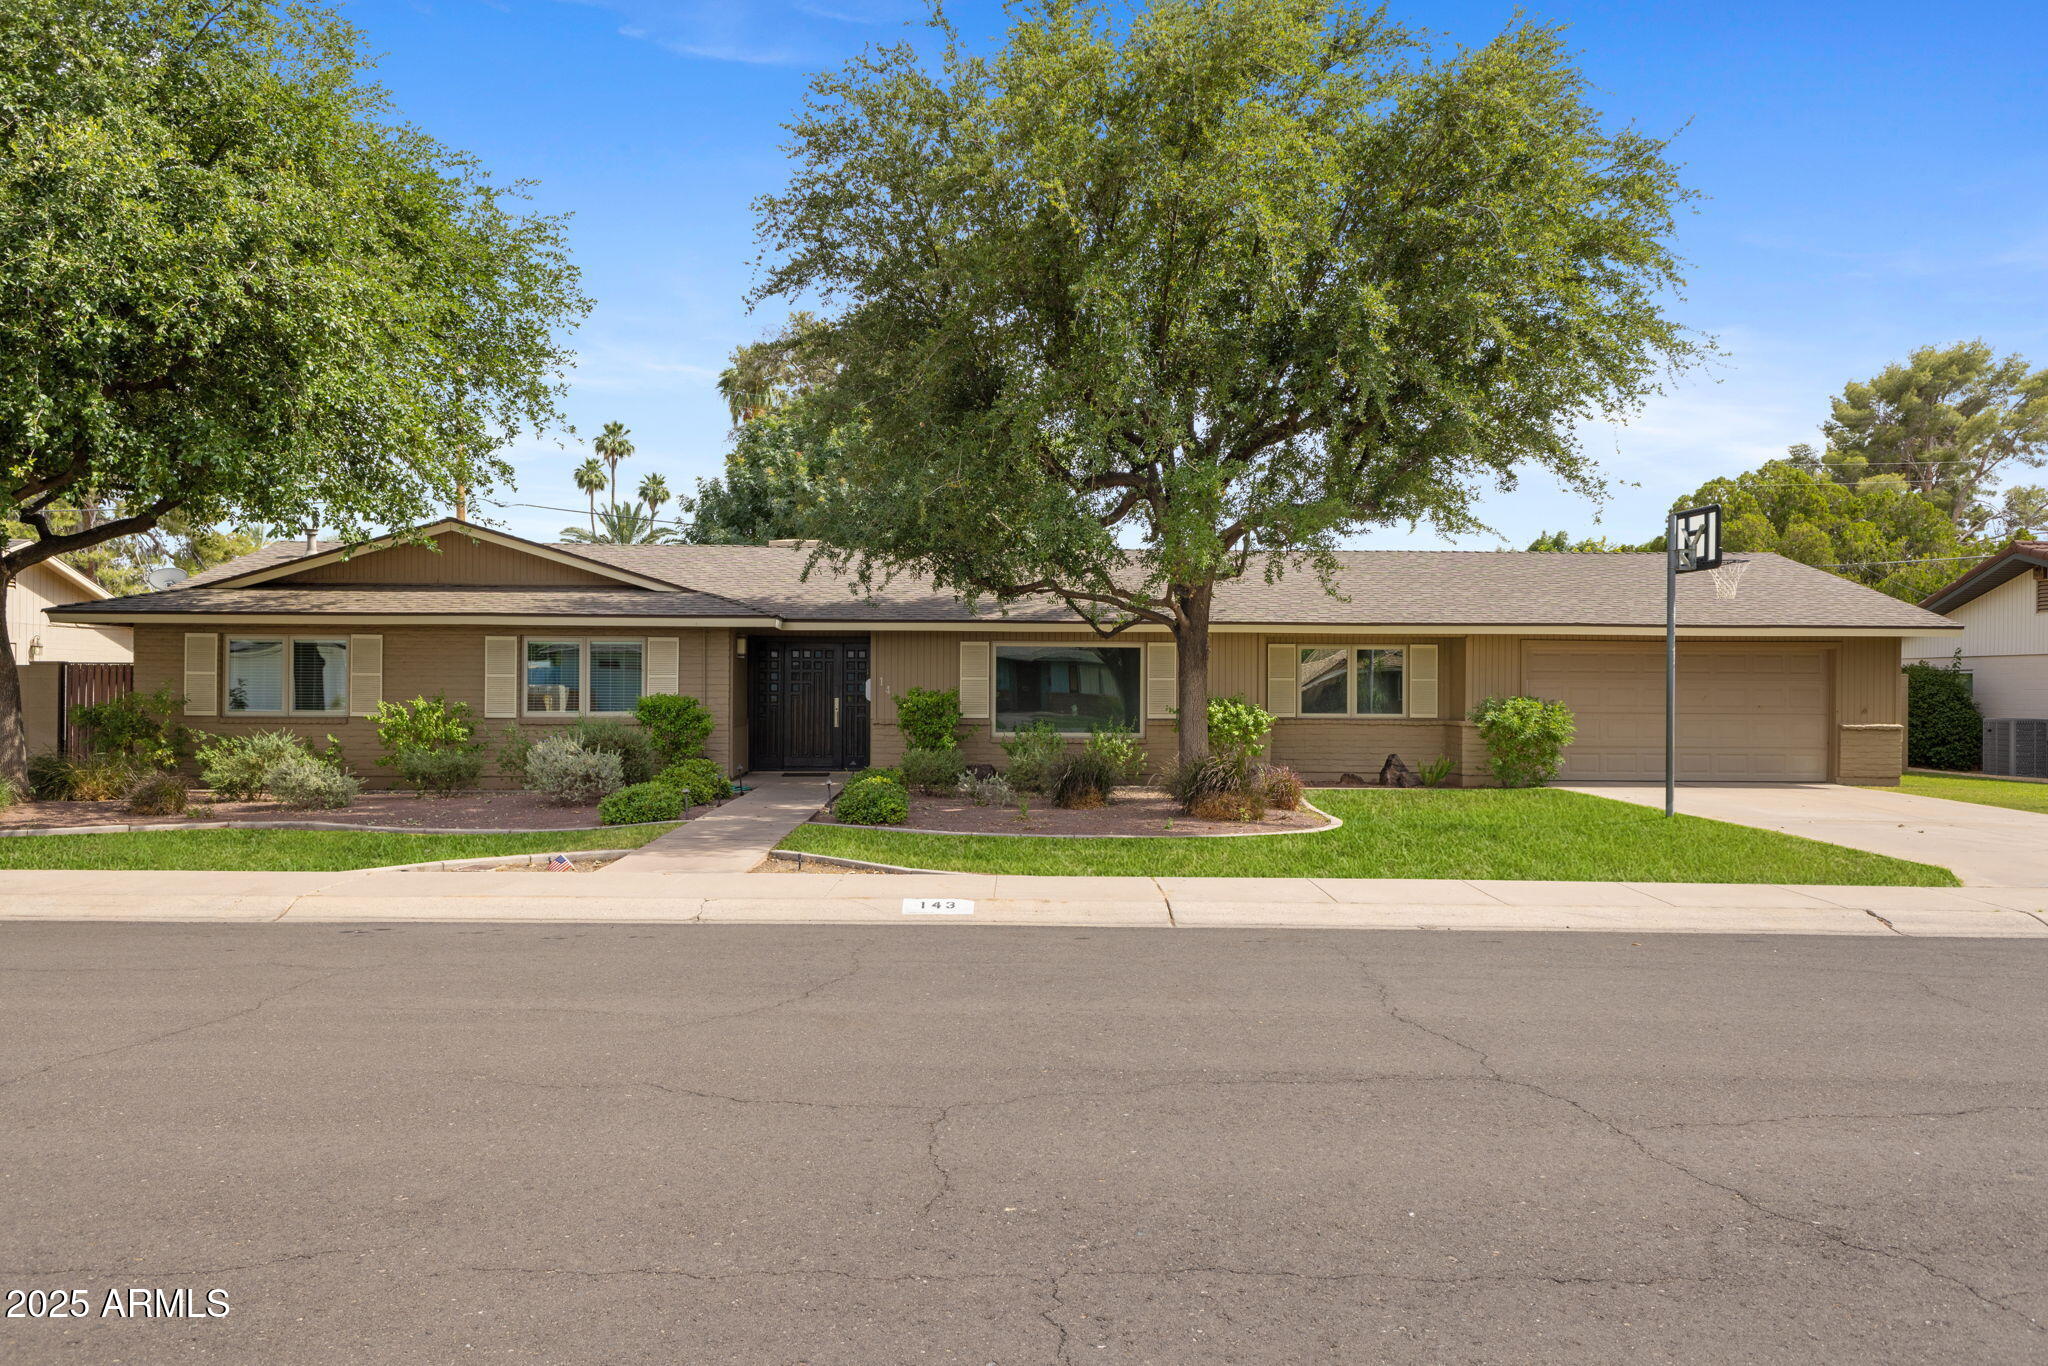
Active
$1,050,000
4
bds
|
3
ba
|
2,704
sqft
|
built
1964
143 E Winter Dr, Phoenix, AZ 85020
$-3,011
Cash flow
-15.0%
Cash-on-Cash Return
2.2%
Cap rate
0.3%
Rent to Value Ratio
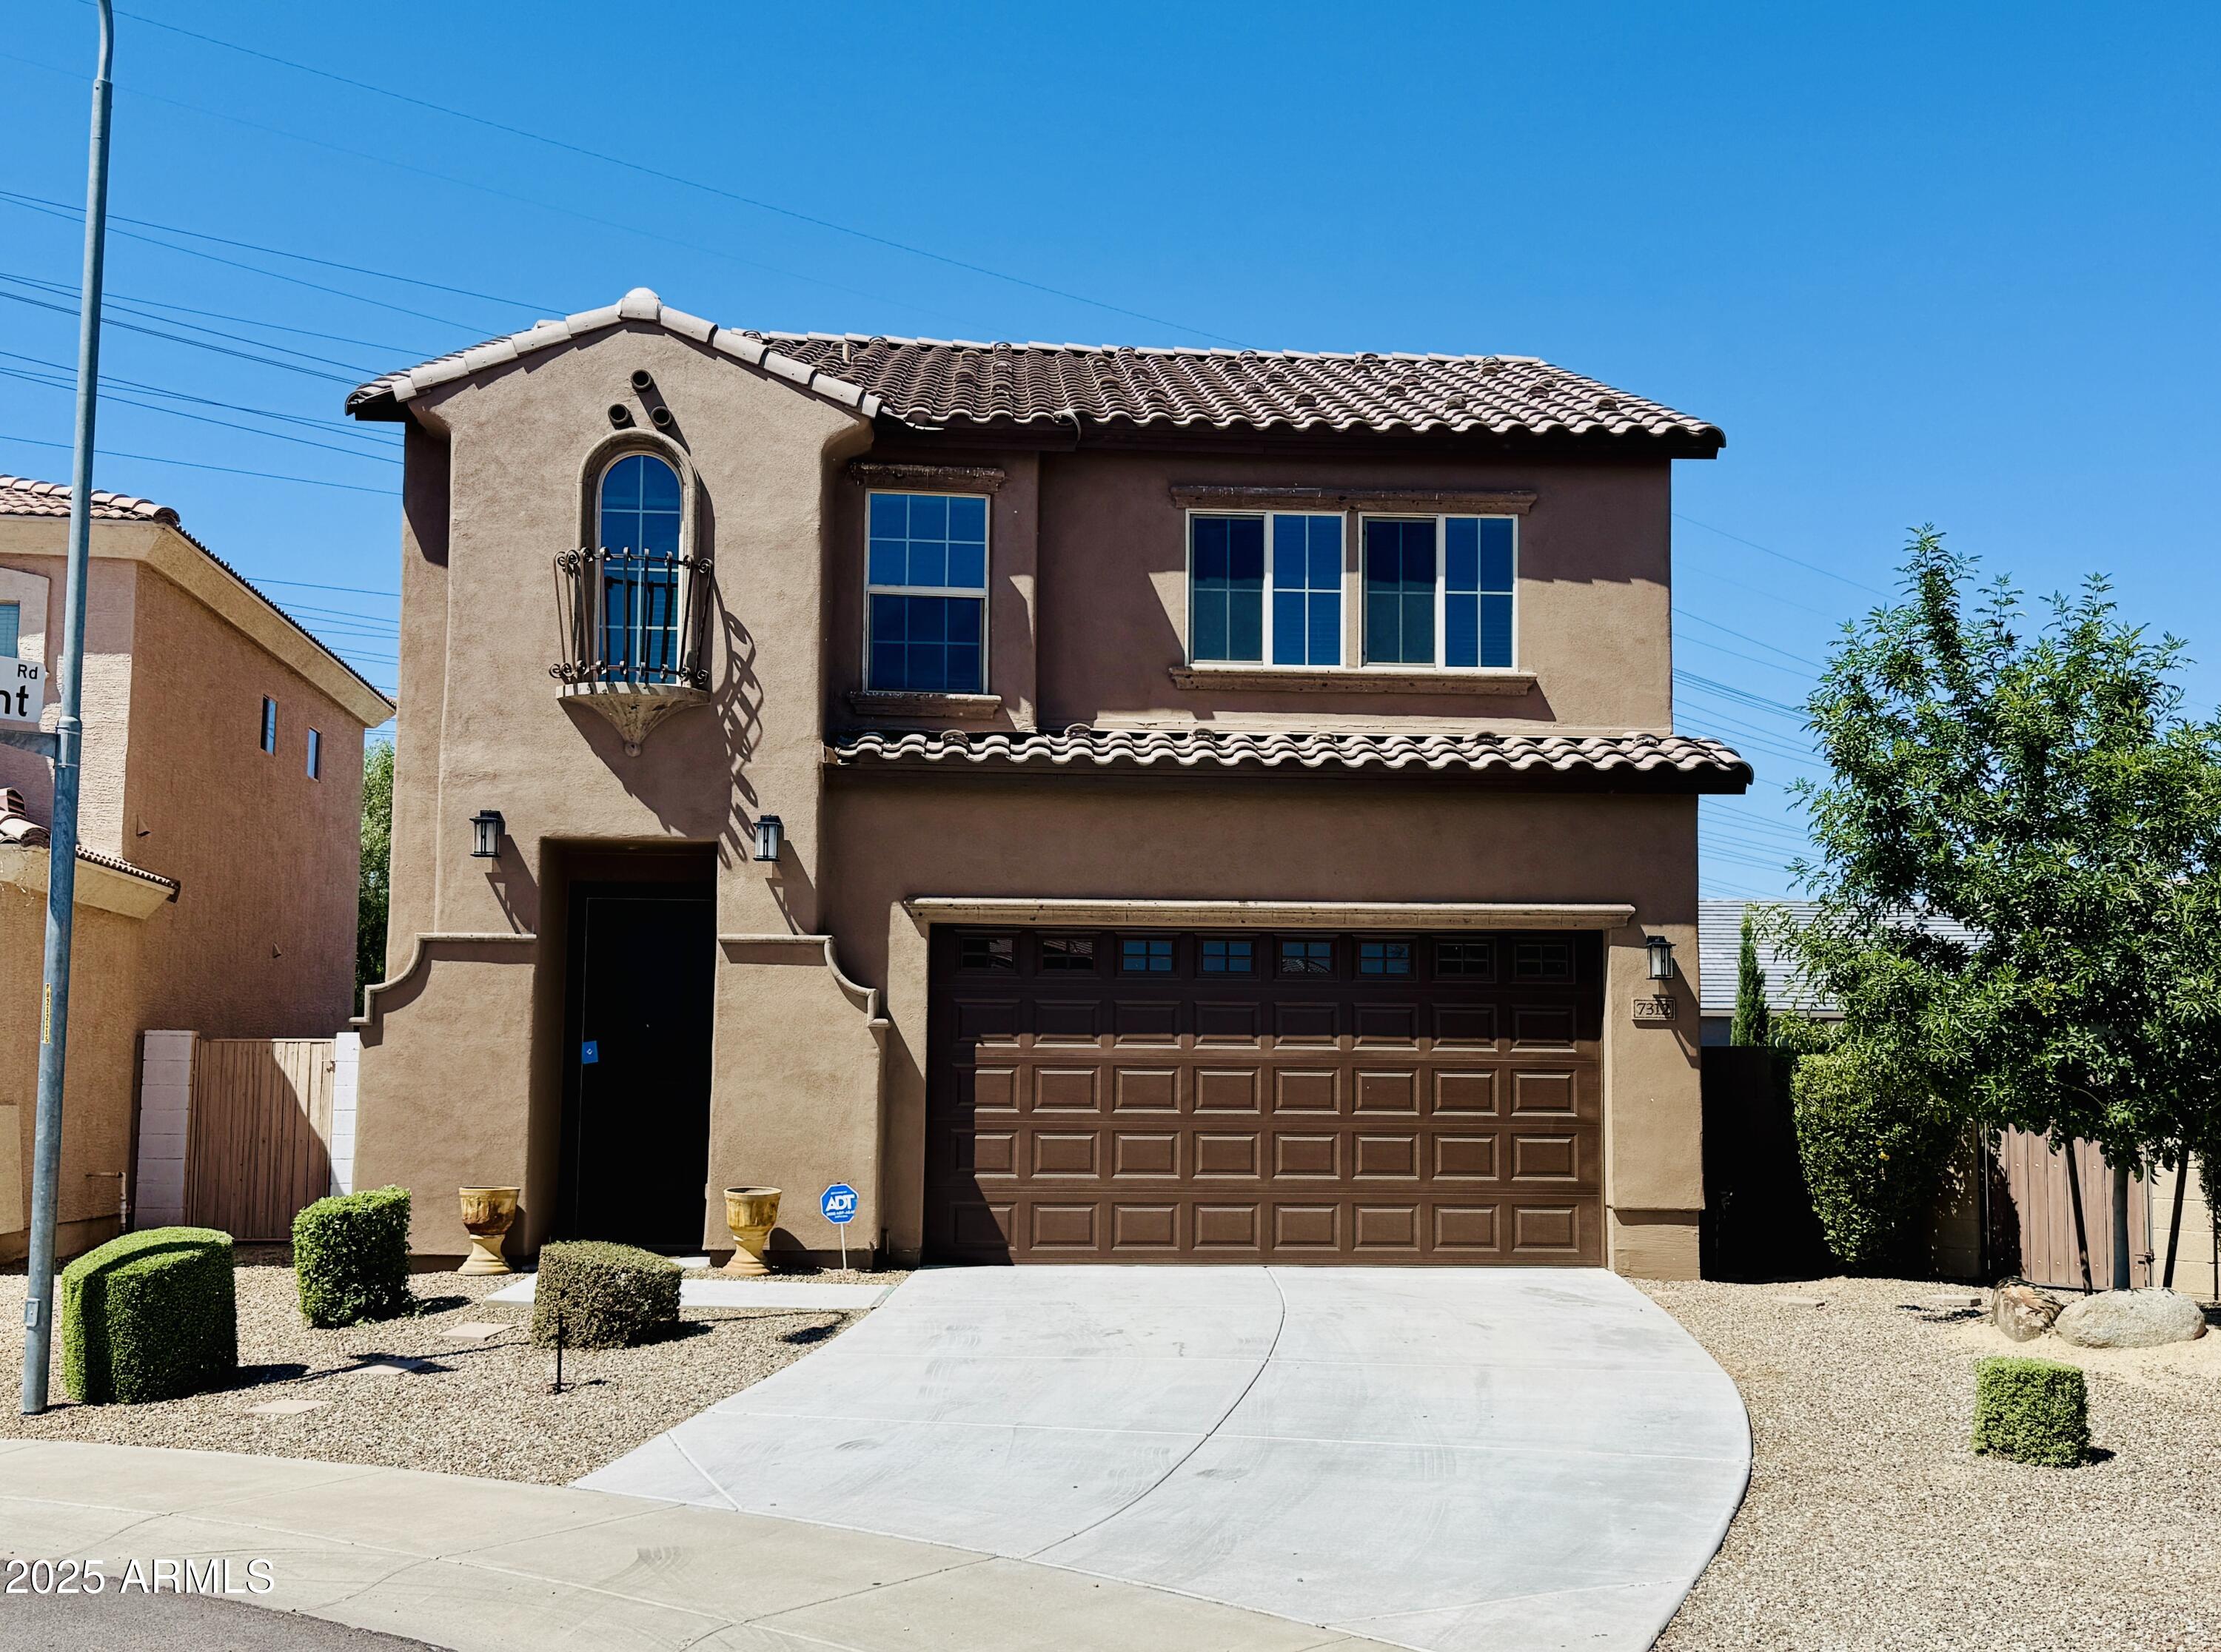
Active
$465,000
4
bds
|
3
ba
|
1,685
sqft
|
built
2017
7312 S 13th Way, Phoenix, AZ 85042
$-523
Cash flow
-5.9%
Cash-on-Cash Return
4.3%
Cap rate
0.6%
Rent to Value Ratio
Active
$290,000
3
bds
|
2
ba
|
1,176
sqft
|
built
1955
8724 N 28th Ave, Phoenix, AZ 85051
$-184
Cash flow
-3.3%
Cash-on-Cash Return
4.9%
Cap rate
0.6%
Rent to Value Ratio
Active
$375,000
3
bds
|
2
ba
|
1,337
sqft
|
built
2002
3041 W Palm Ln, Phoenix, AZ 85009
$-484
Cash flow
-6.7%
Cash-on-Cash Return
4.1%
Cap rate
0.5%
Rent to Value Ratio
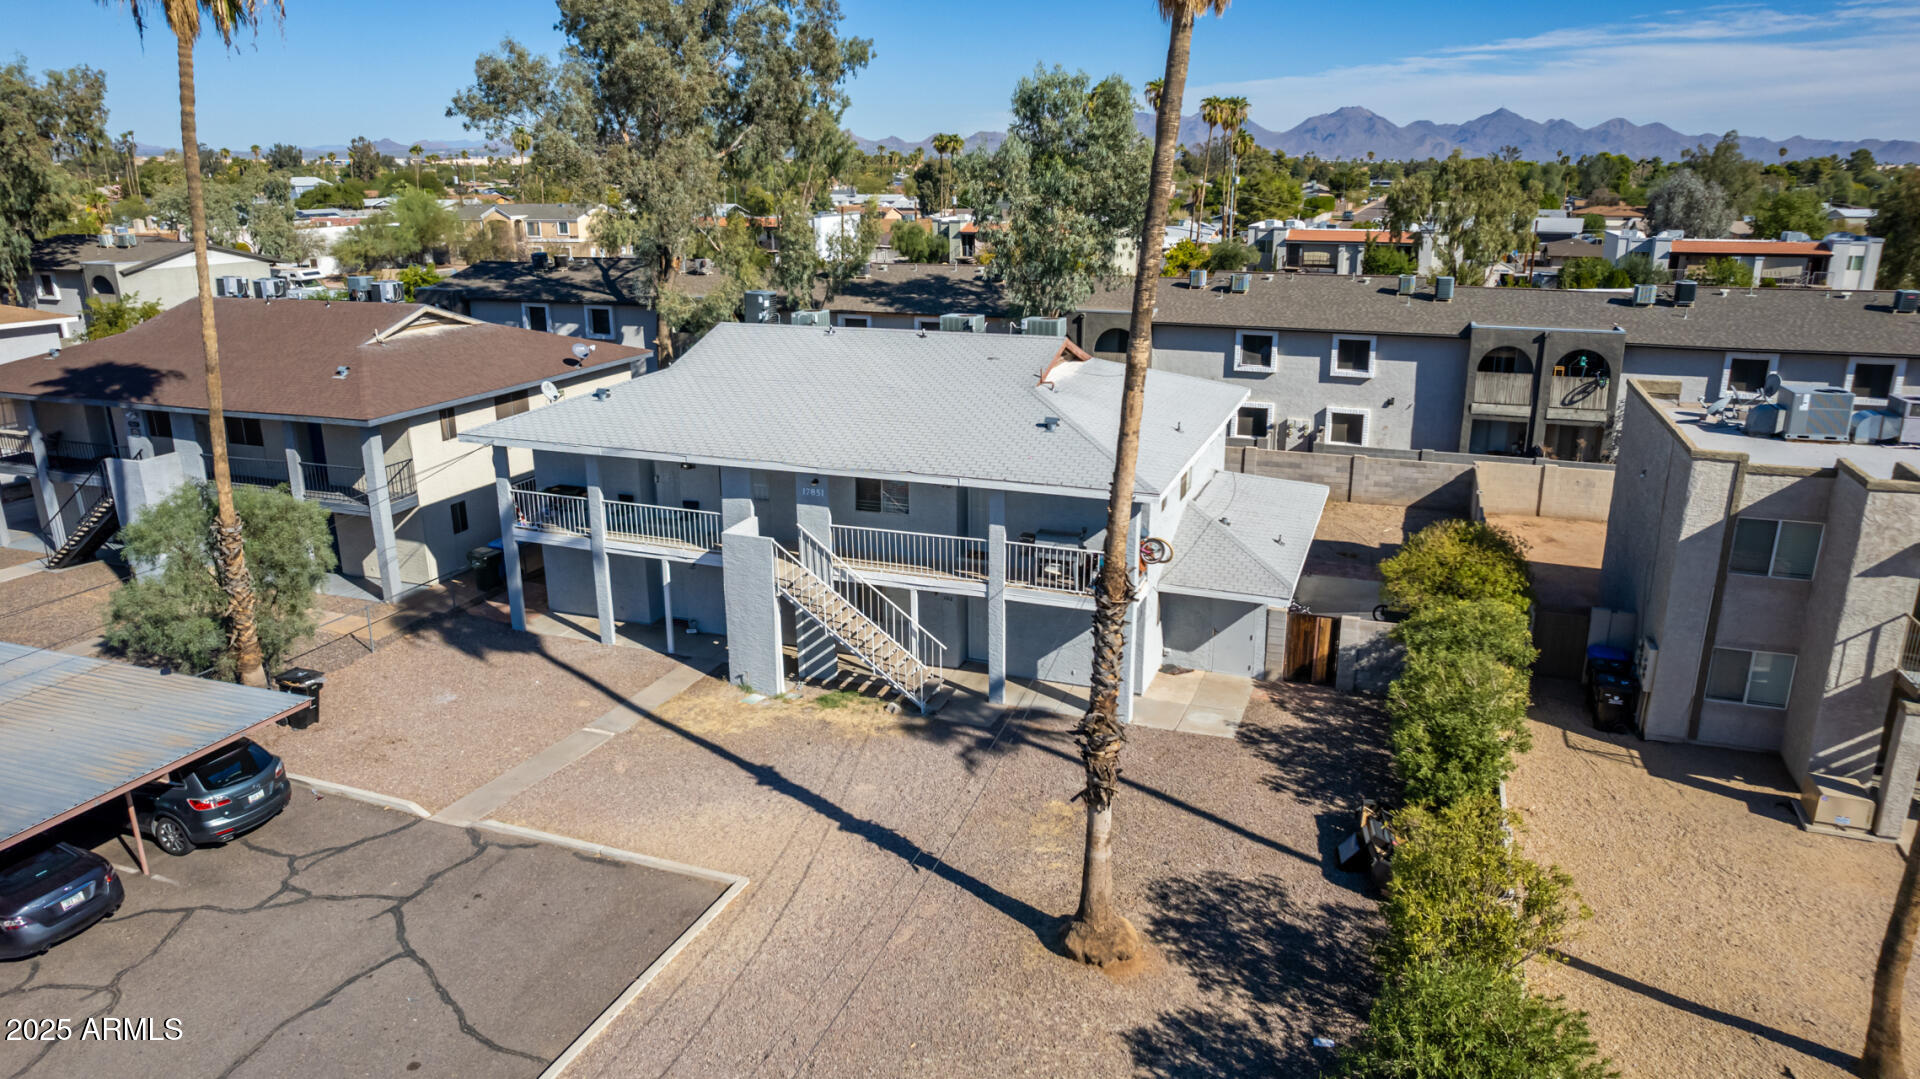
Active
$849,000
bds
|
0
ba
|
0
sqft
|
built
1981
17851 N 40th St, Phoenix, AZ 85032
$-2,444
Cash flow
-15.0%
Cash-on-Cash Return
2.2%
Cap rate
0.3%
Rent to Value Ratio
Active
$490,000
3
bds
|
2
ba
|
1,314
sqft
|
built
1994
2015 E Glenhaven Dr, Phoenix, AZ 85048
$-735
Cash flow
-7.8%
Cash-on-Cash Return
3.9%
Cap rate
0.5%
Rent to Value Ratio
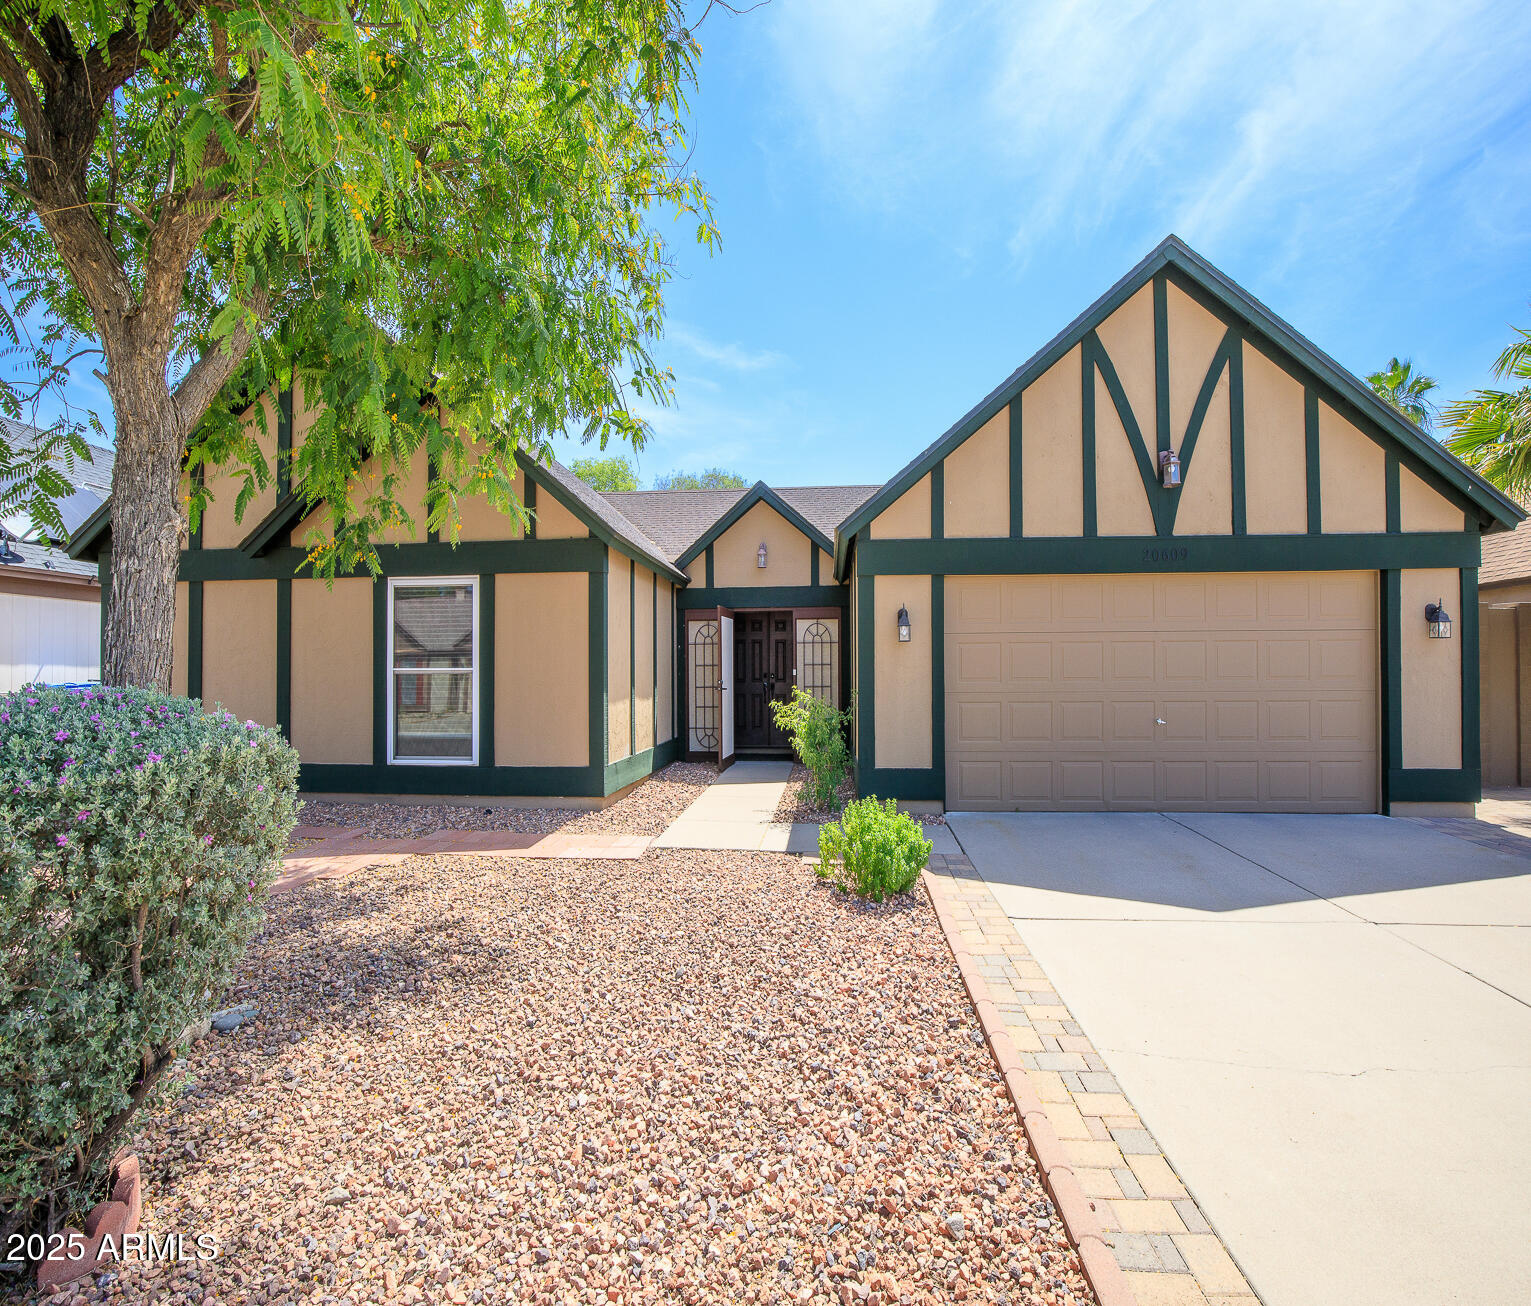
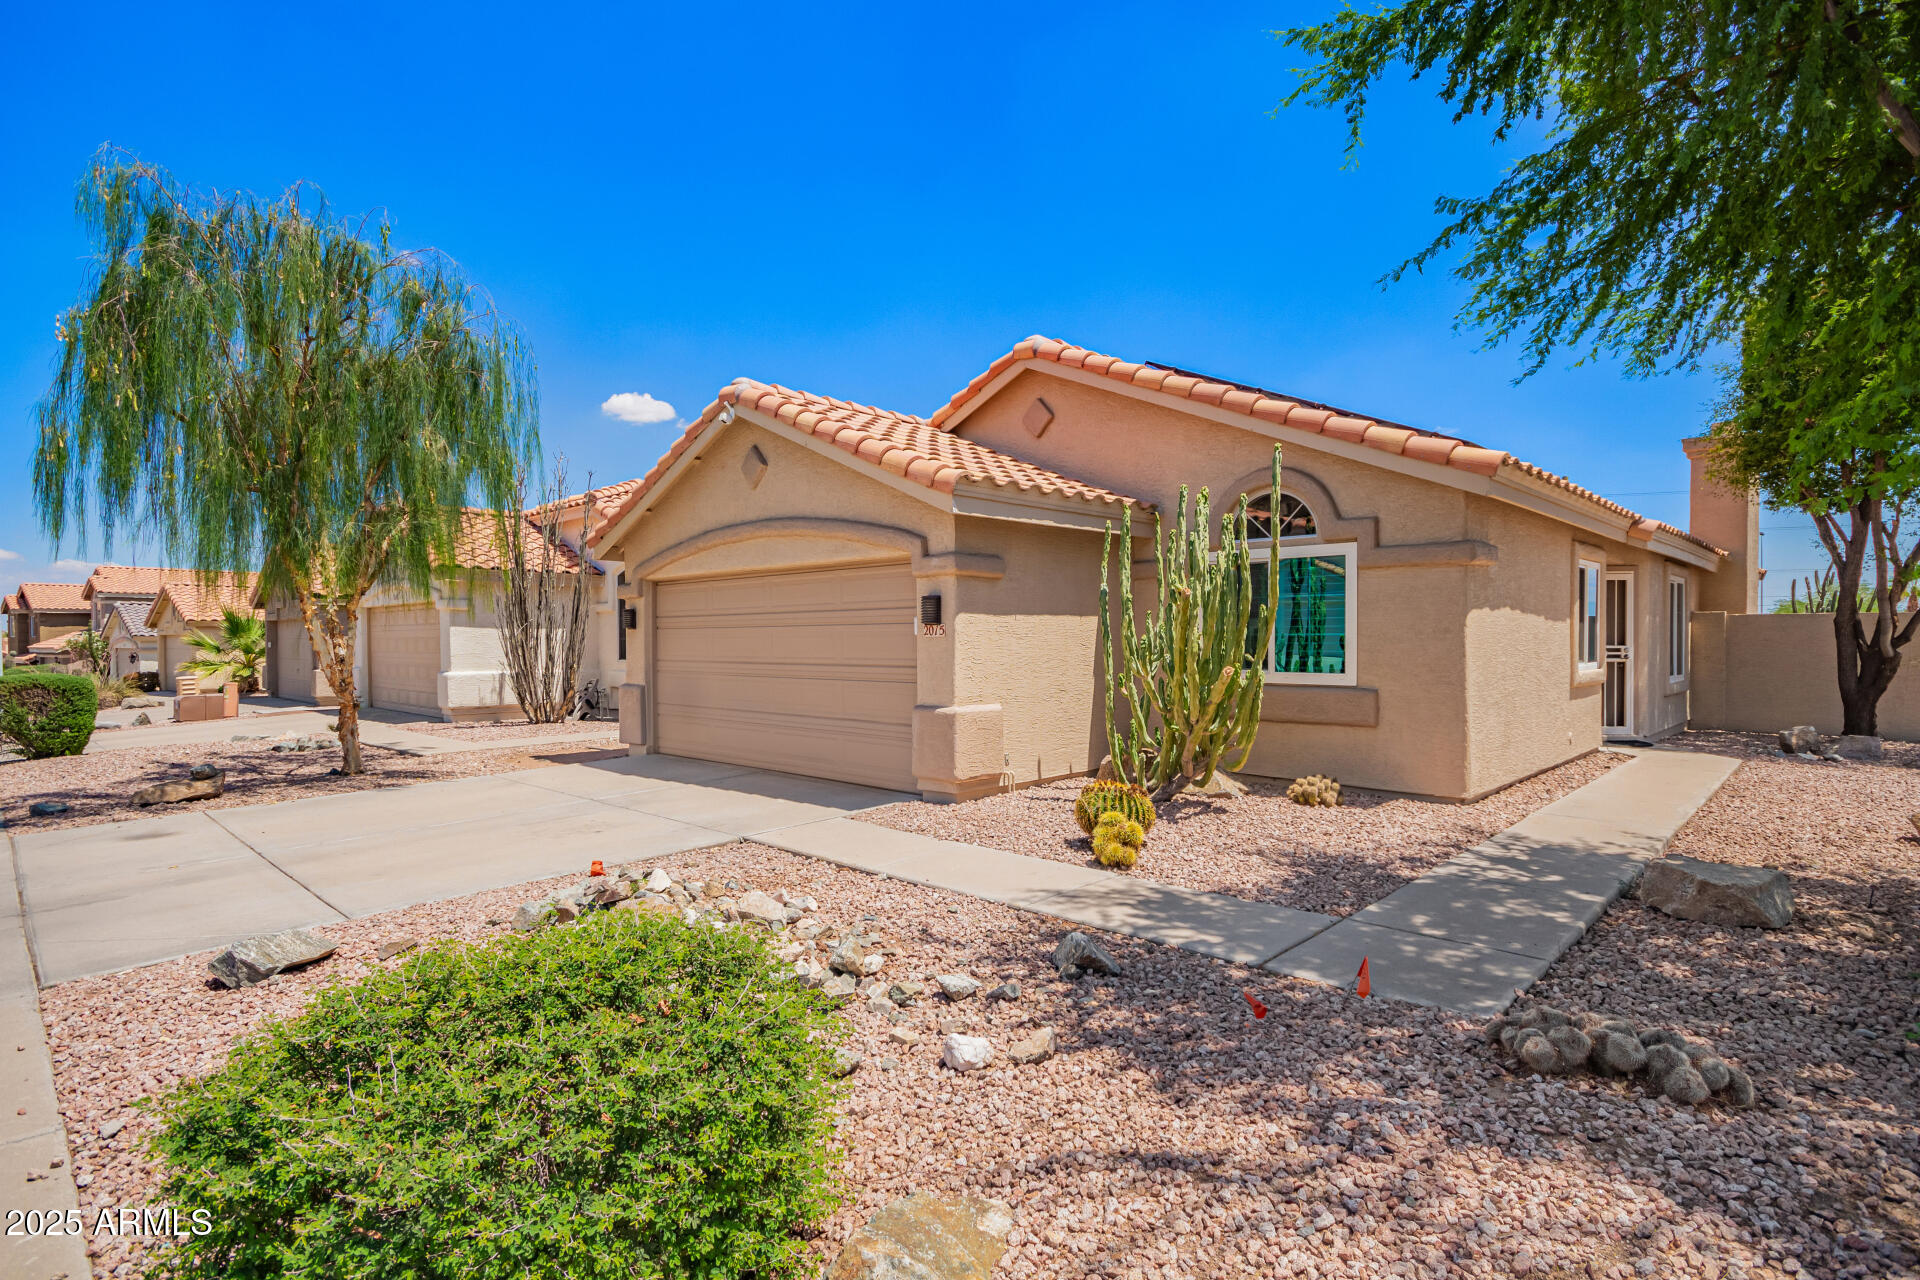
Active
$510,000
4
bds
|
2
ba
|
1,855
sqft
|
built
1985
20609 N 4th Ave, Phoenix, AZ 85027
$-819
Cash flow
-8.4%
Cash-on-Cash Return
3.8%
Cap rate
0.5%
Rent to Value Ratio
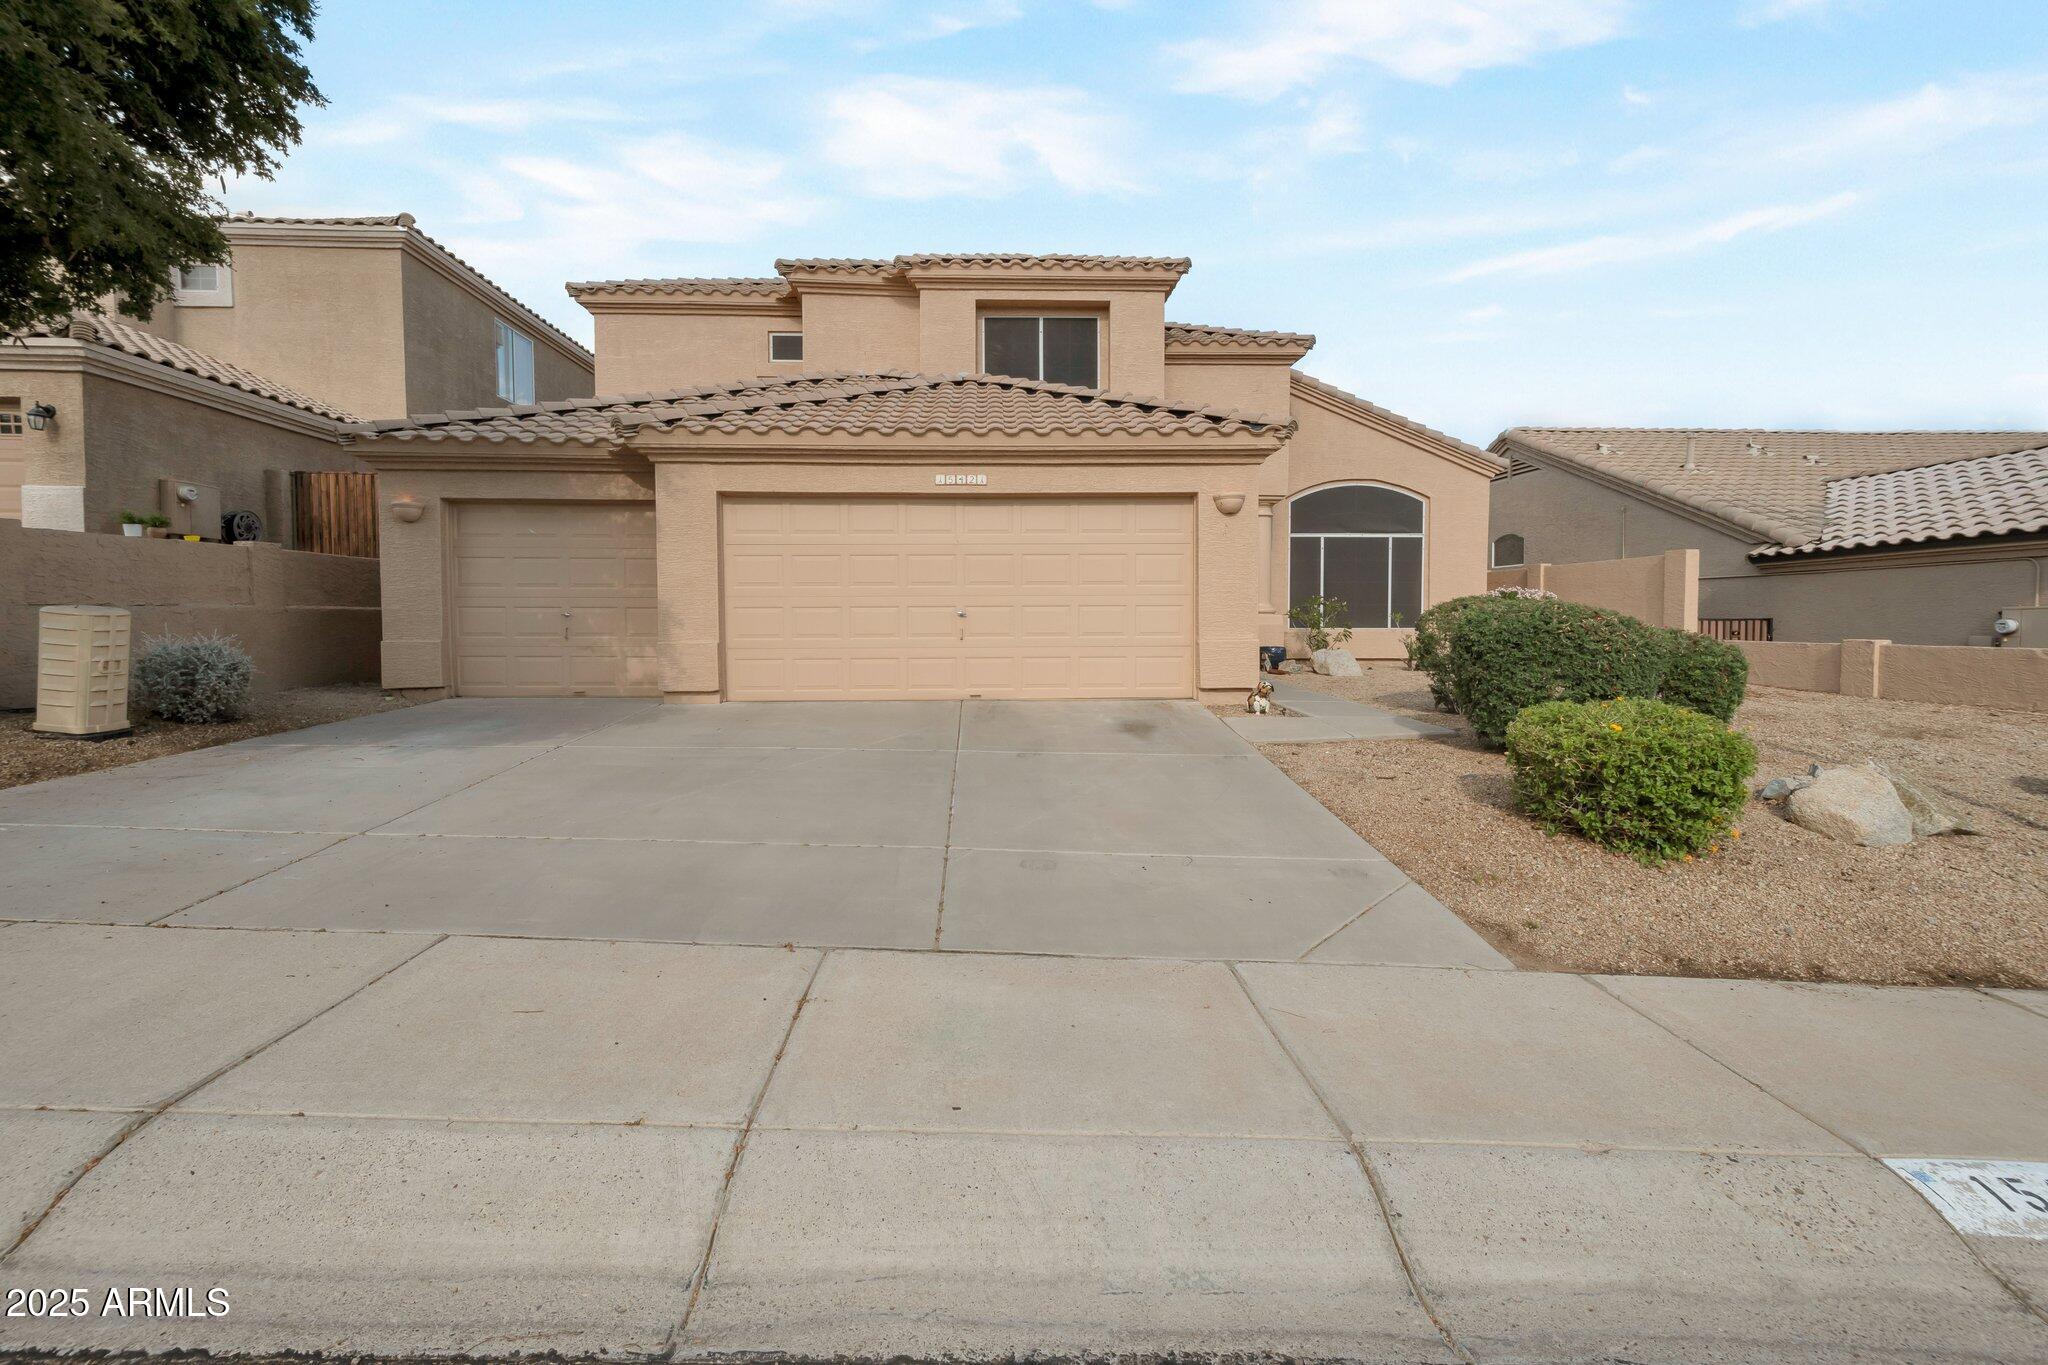
Active
$735,000
4
bds
|
3
ba
|
2,602
sqft
|
built
1994
15421 S 16th Dr, Phoenix, AZ 85045
$-1,325
Cash flow
-9.4%
Cash-on-Cash Return
3.5%
Cap rate
0.5%
Rent to Value Ratio

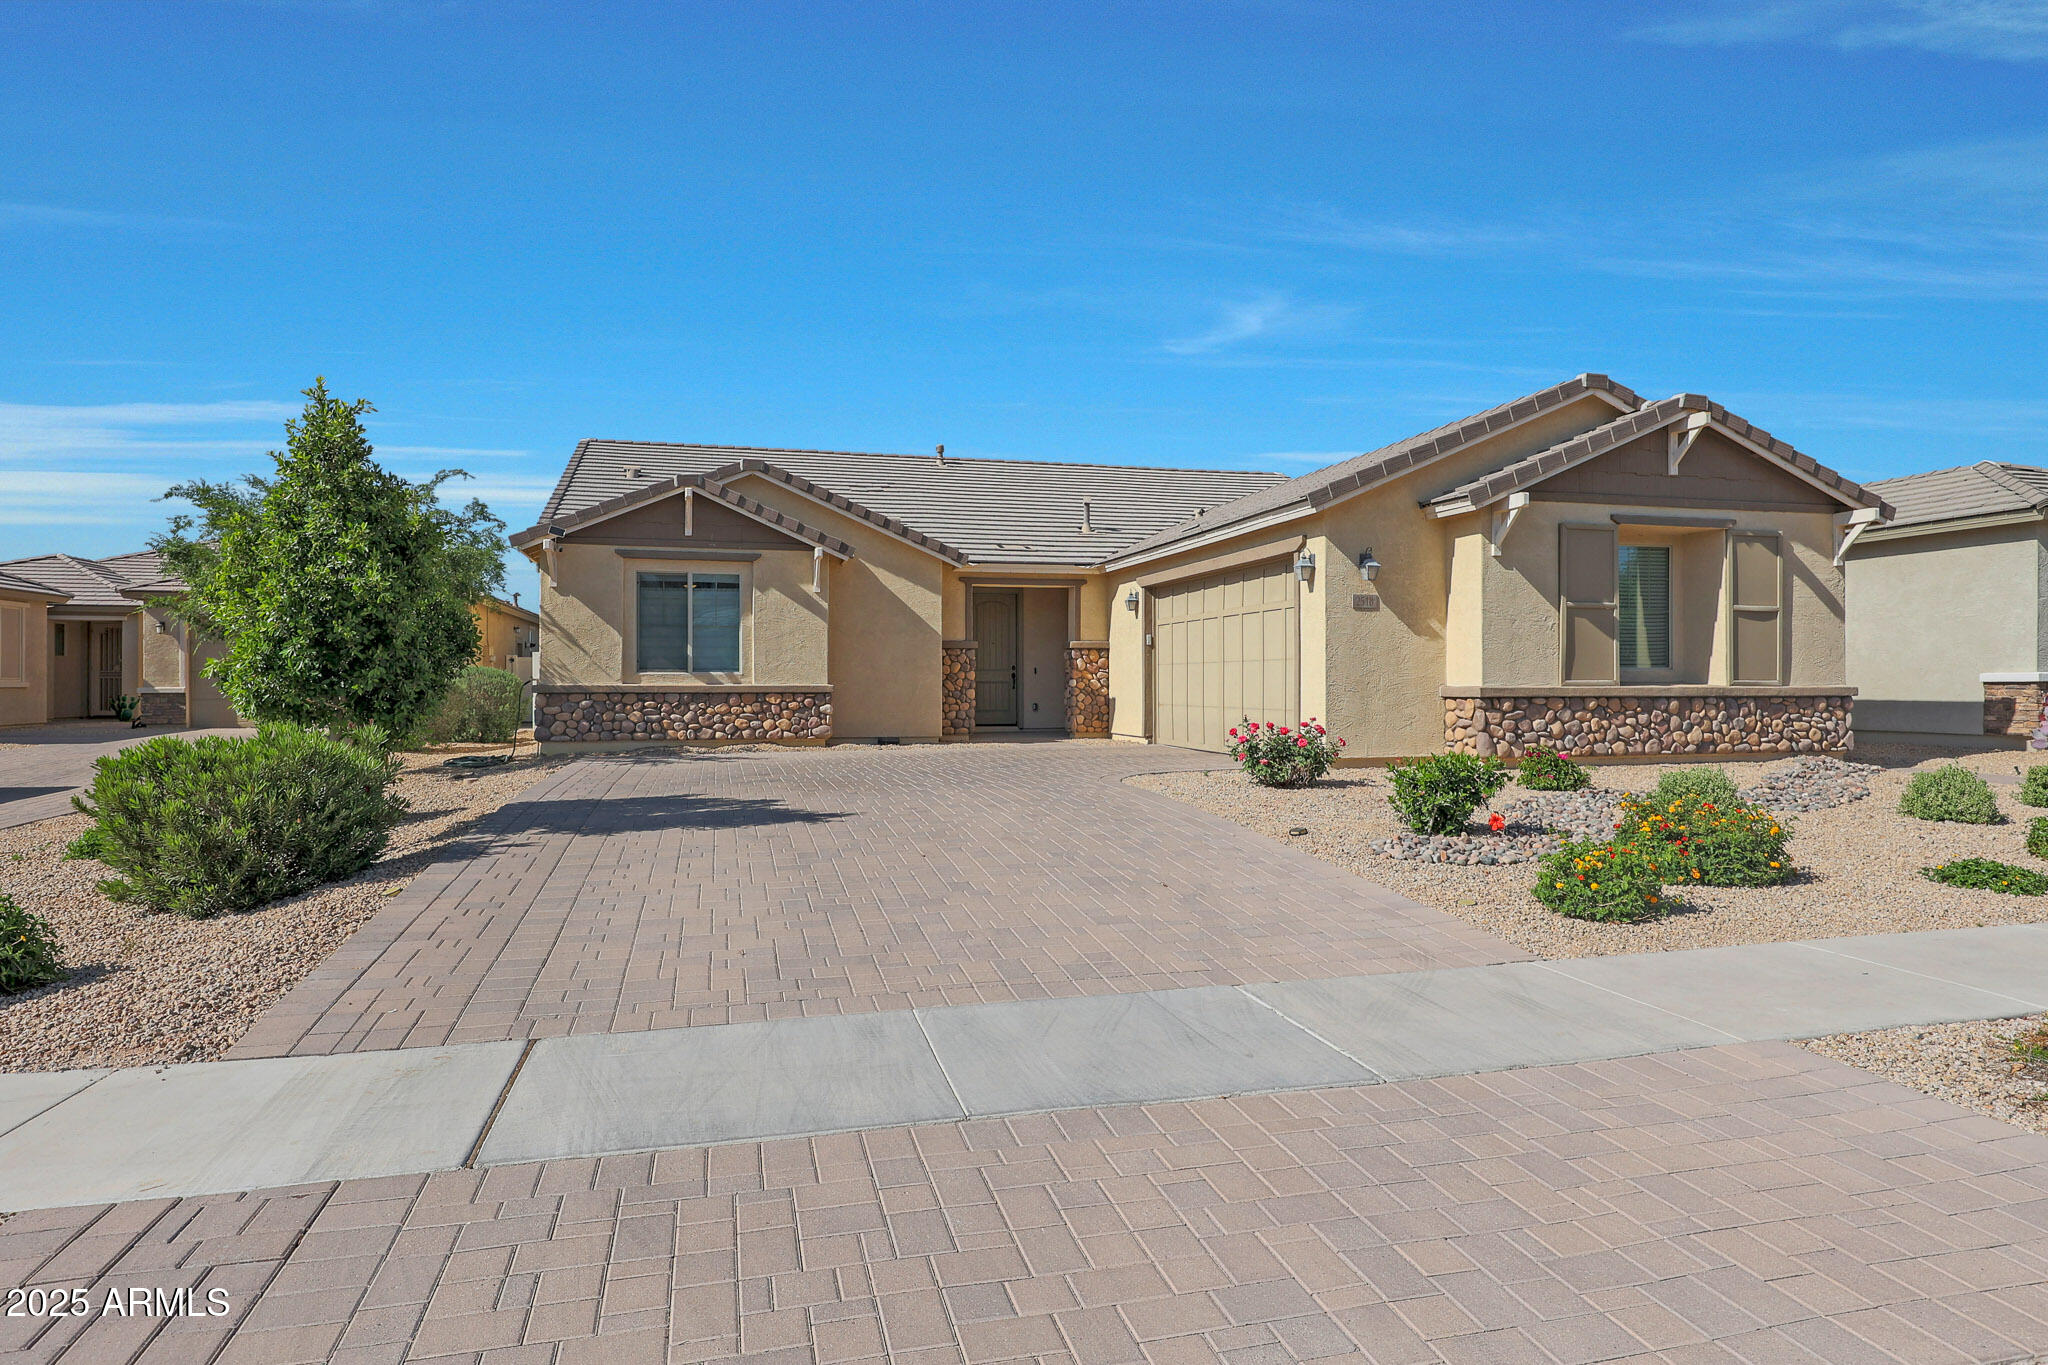
Active
$750,000
3
bds
|
2
ba
|
1,464
sqft
|
built
1920
2310 N 11th St, Phoenix, AZ 85006
$-535
Cash flow
-3.7%
Cash-on-Cash Return
4.8%
Cap rate
0.6%
Rent to Value Ratio

Active
$675,000
4
bds
|
2
ba
|
2,067
sqft
|
built
1972
1820 W Seldon Way, Phoenix, AZ 85021
$-1,409
Cash flow
-10.9%
Cash-on-Cash Return
3.2%
Cap rate
0.4%
Rent to Value Ratio
Active
$589,900
3
bds
|
2
ba
|
1,934
sqft
|
built
2019
2518 E Novak Way, Phoenix, AZ 85042
$-1,534
Cash flow
-13.6%
Cash-on-Cash Return
2.6%
Cap rate
0.4%
Rent to Value Ratio
Active
$359,500
3
bds
|
2
ba
|
1,161
sqft
|
built
1979
8307 W Indianola Ave, Phoenix, AZ 85037
$-597
Cash flow
-8.7%
Cash-on-Cash Return
3.7%
Cap rate
0.5%
Rent to Value Ratio
Active
$293,000
2
bds
|
1
ba
|
1,071
sqft
|
built
1996
3236 E Chandler Blvd, Phoenix, AZ 85048
$-521
Cash flow
-9.3%
Cash-on-Cash Return
3.5%
Cap rate
0.6%
Rent to Value Ratio
Active
$835,000
3
bds
|
2
ba
|
1,953
sqft
|
built
1989
4340 E Nisbet Rd, Phoenix, AZ 85032
$-1,775
Cash flow
-11.1%
Cash-on-Cash Return
3.1%
Cap rate
0.4%
Rent to Value Ratio
Active
$650,000
3
bds
|
3
ba
|
2,100
sqft
|
built
1995
4446 E Woodridge Dr, Phoenix, AZ 85032
$-1,334
Cash flow
-10.7%
Cash-on-Cash Return
3.2%
Cap rate
0.4%
Rent to Value Ratio

Active
$530,000
2
bds
|
2
ba
|
1,940
sqft
|
built
2006
3935 E Rough Rider Rd, Phoenix, AZ 85050
$-1,202
Cash flow
-11.8%
Cash-on-Cash Return
3.0%
Cap rate
0.5%
Rent to Value Ratio

Active
$625,000
4
bds
|
3
ba
|
2,452
sqft
|
built
2004
1839 E Parkside Ln, Phoenix, AZ 85024
$-1,317
Cash flow
-11.0%
Cash-on-Cash Return
3.2%
Cap rate
0.4%
Rent to Value Ratio
Active
$345,000
3
bds
|
2
ba
|
1,205
sqft
|
built
1981
14801 N 25th Dr, Phoenix, AZ 85023
$-489
Cash flow
-7.4%
Cash-on-Cash Return
4.0%
Cap rate
0.6%
Rent to Value Ratio
Active
$2,950,000
4
bds
|
5
ba
|
5,201
sqft
|
built
2017
36133 N 24th Ave, Phoenix, AZ 85086
$-7,702
Cash flow
-13.6%
Cash-on-Cash Return
2.5%
Cap rate
0.3%
Rent to Value Ratio
Active
$759,000
4
bds
|
2
ba
|
2,234
sqft
|
built
2009
27007 N 20th Ln, Phoenix, AZ 85085
$-1,902
Cash flow
-13.1%
Cash-on-Cash Return
2.7%
Cap rate
0.4%
Rent to Value Ratio
Active
$289,000
2
bds
|
2
ba
|
997
sqft
|
built
1995
3830 E Lakewood Pkwy E, Phoenix, AZ 85048
$-675
Cash flow
-12.2%
Cash-on-Cash Return
2.9%
Cap rate
0.6%
Rent to Value Ratio
Active
$320,000
3
bds
|
3
ba
|
1,450
sqft
|
built
2004
1718 W Colter St, Phoenix, AZ 85015
$-511
Cash flow
-8.3%
Cash-on-Cash Return
3.8%
Cap rate
0.6%
Rent to Value Ratio

Active
$598,500
4
bds
|
2
ba
|
2,079
sqft
|
built
1991
4428 E Yawepe St, Phoenix, AZ 85044
$-1,223
Cash flow
-10.7%
Cash-on-Cash Return
3.2%
Cap rate
0.5%
Rent to Value Ratio
Active
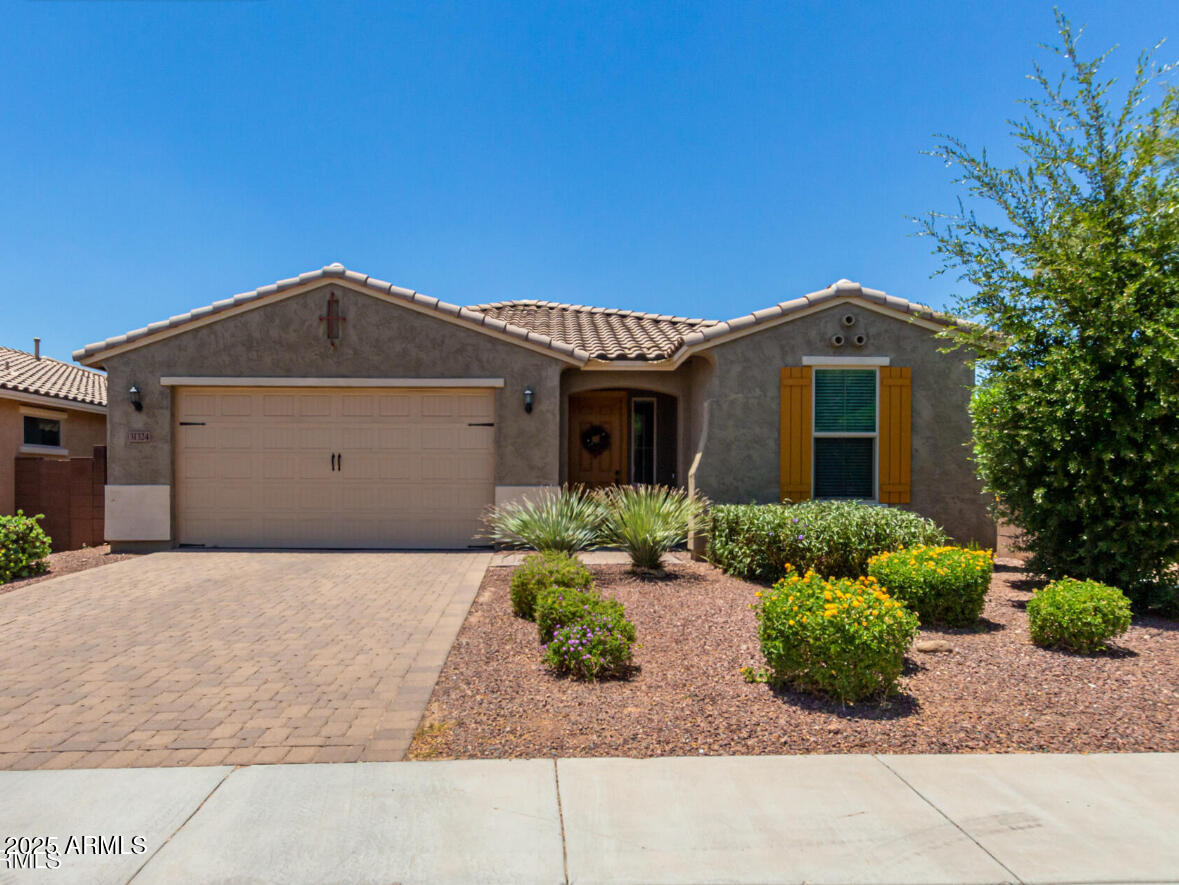
$675,000
4
bds
|
3
ba
|
2,118
sqft
|
built
2016
31324 N 26th Gln, Phoenix, AZ 85085
$-1,274
Cash flow
-9.8%
Cash-on-Cash Return
3.4%
Cap rate
0.5%
Rent to Value Ratio
Active
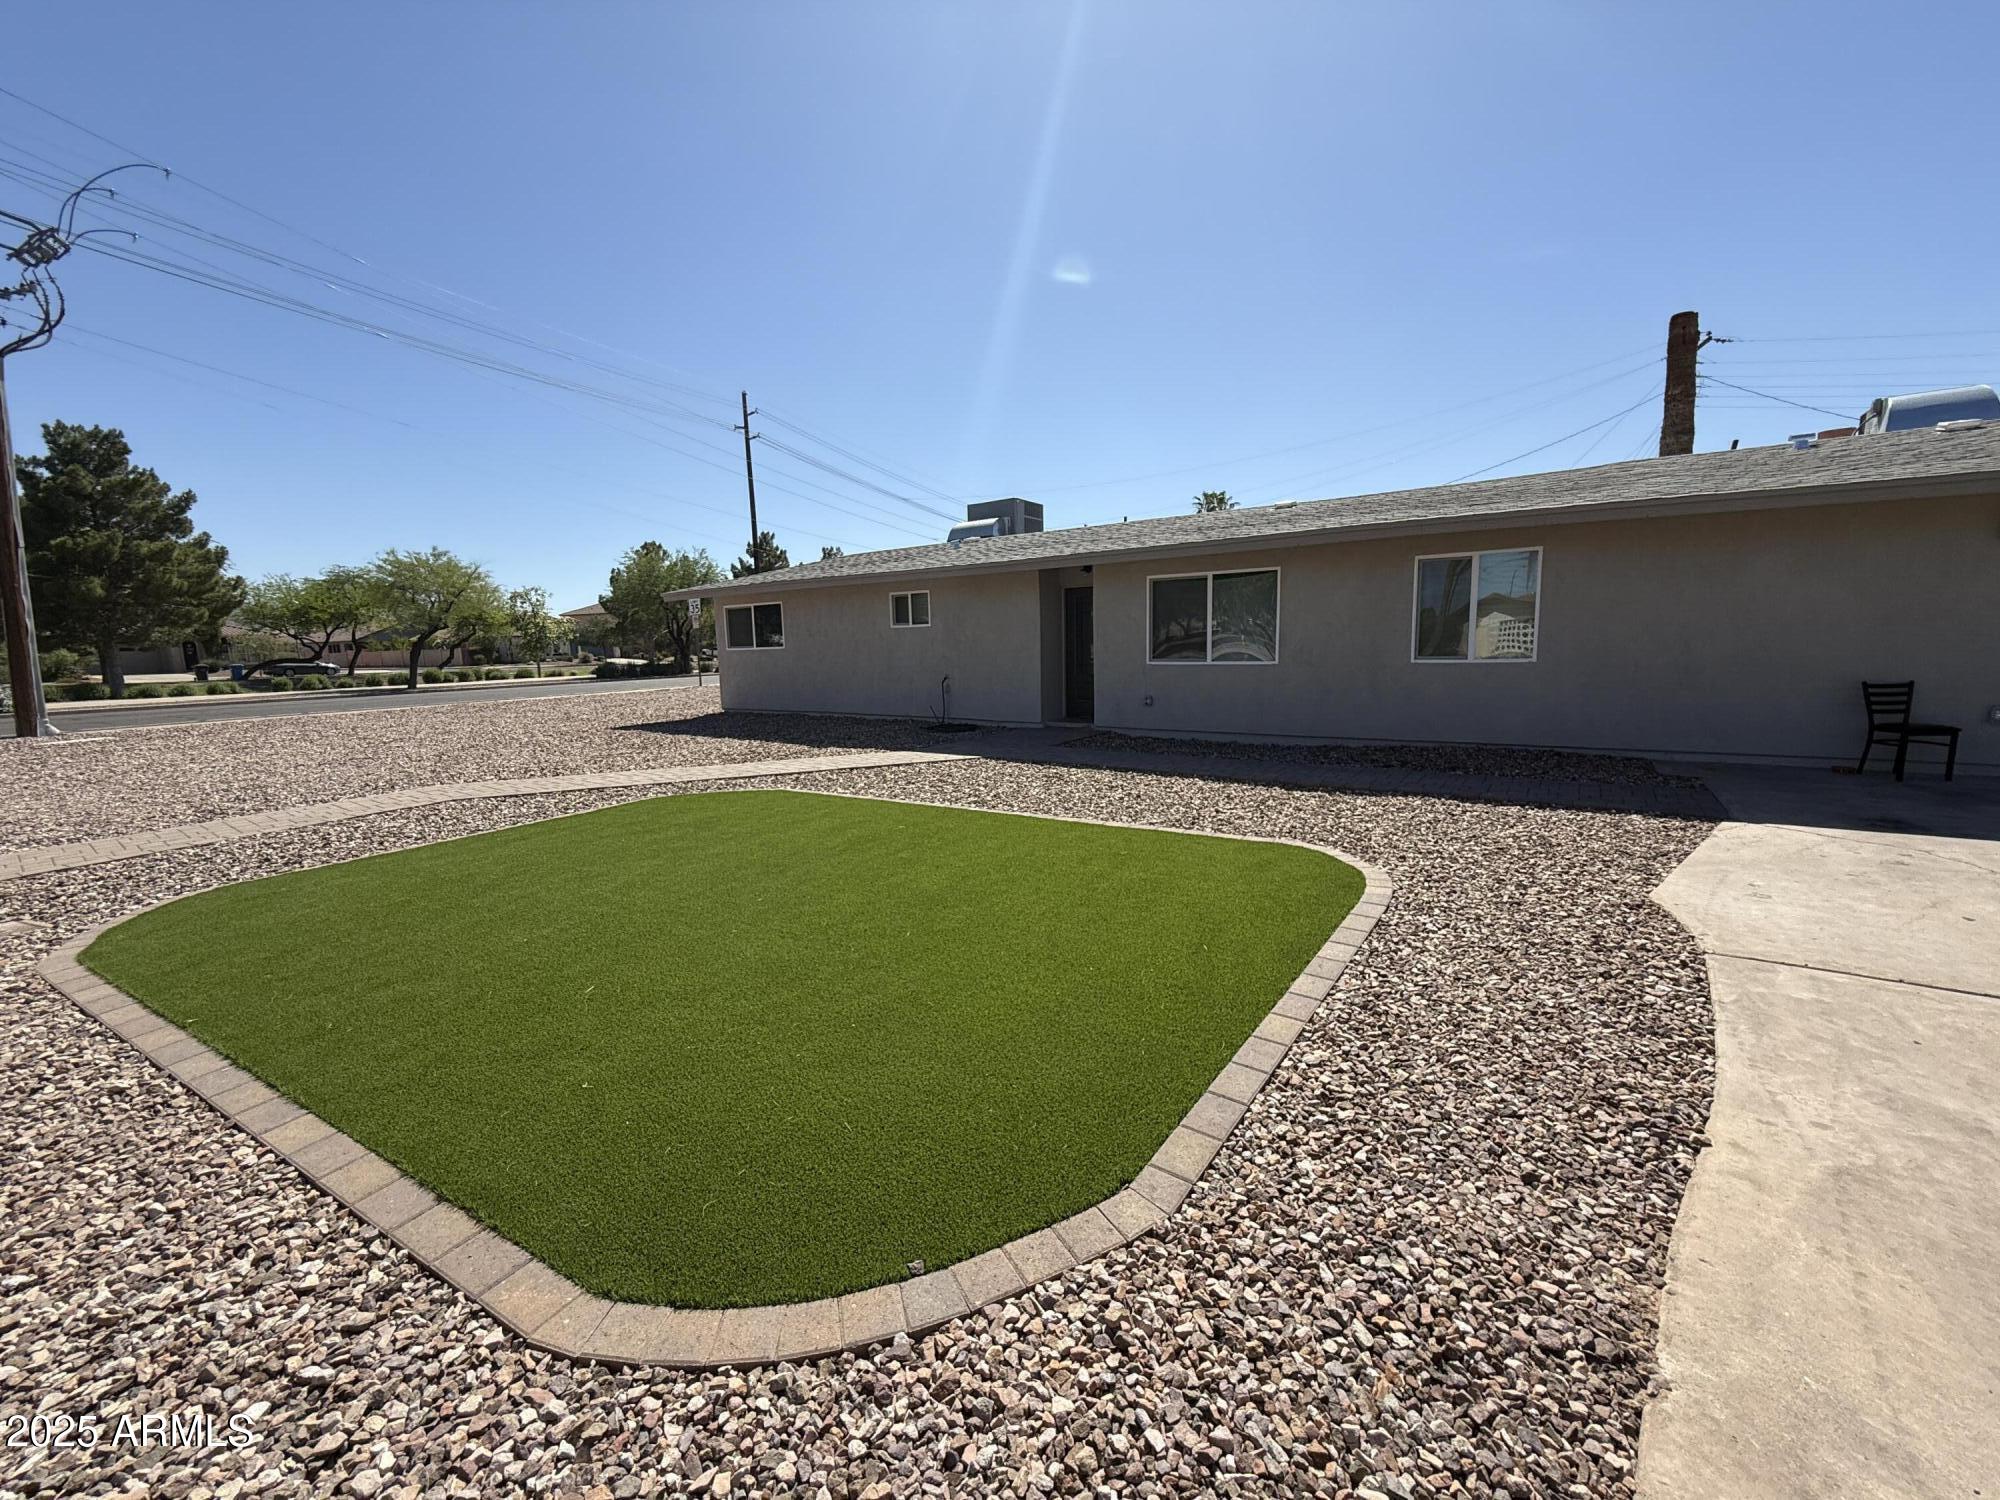
$550,000
3
bds
|
2
ba
|
1,675
sqft
|
built
1960
5042 S 22nd St, Phoenix, AZ 85040
$-1,429
Cash flow
-13.6%
Cash-on-Cash Return
2.6%
Cap rate
0.3%
Rent to Value Ratio
Active
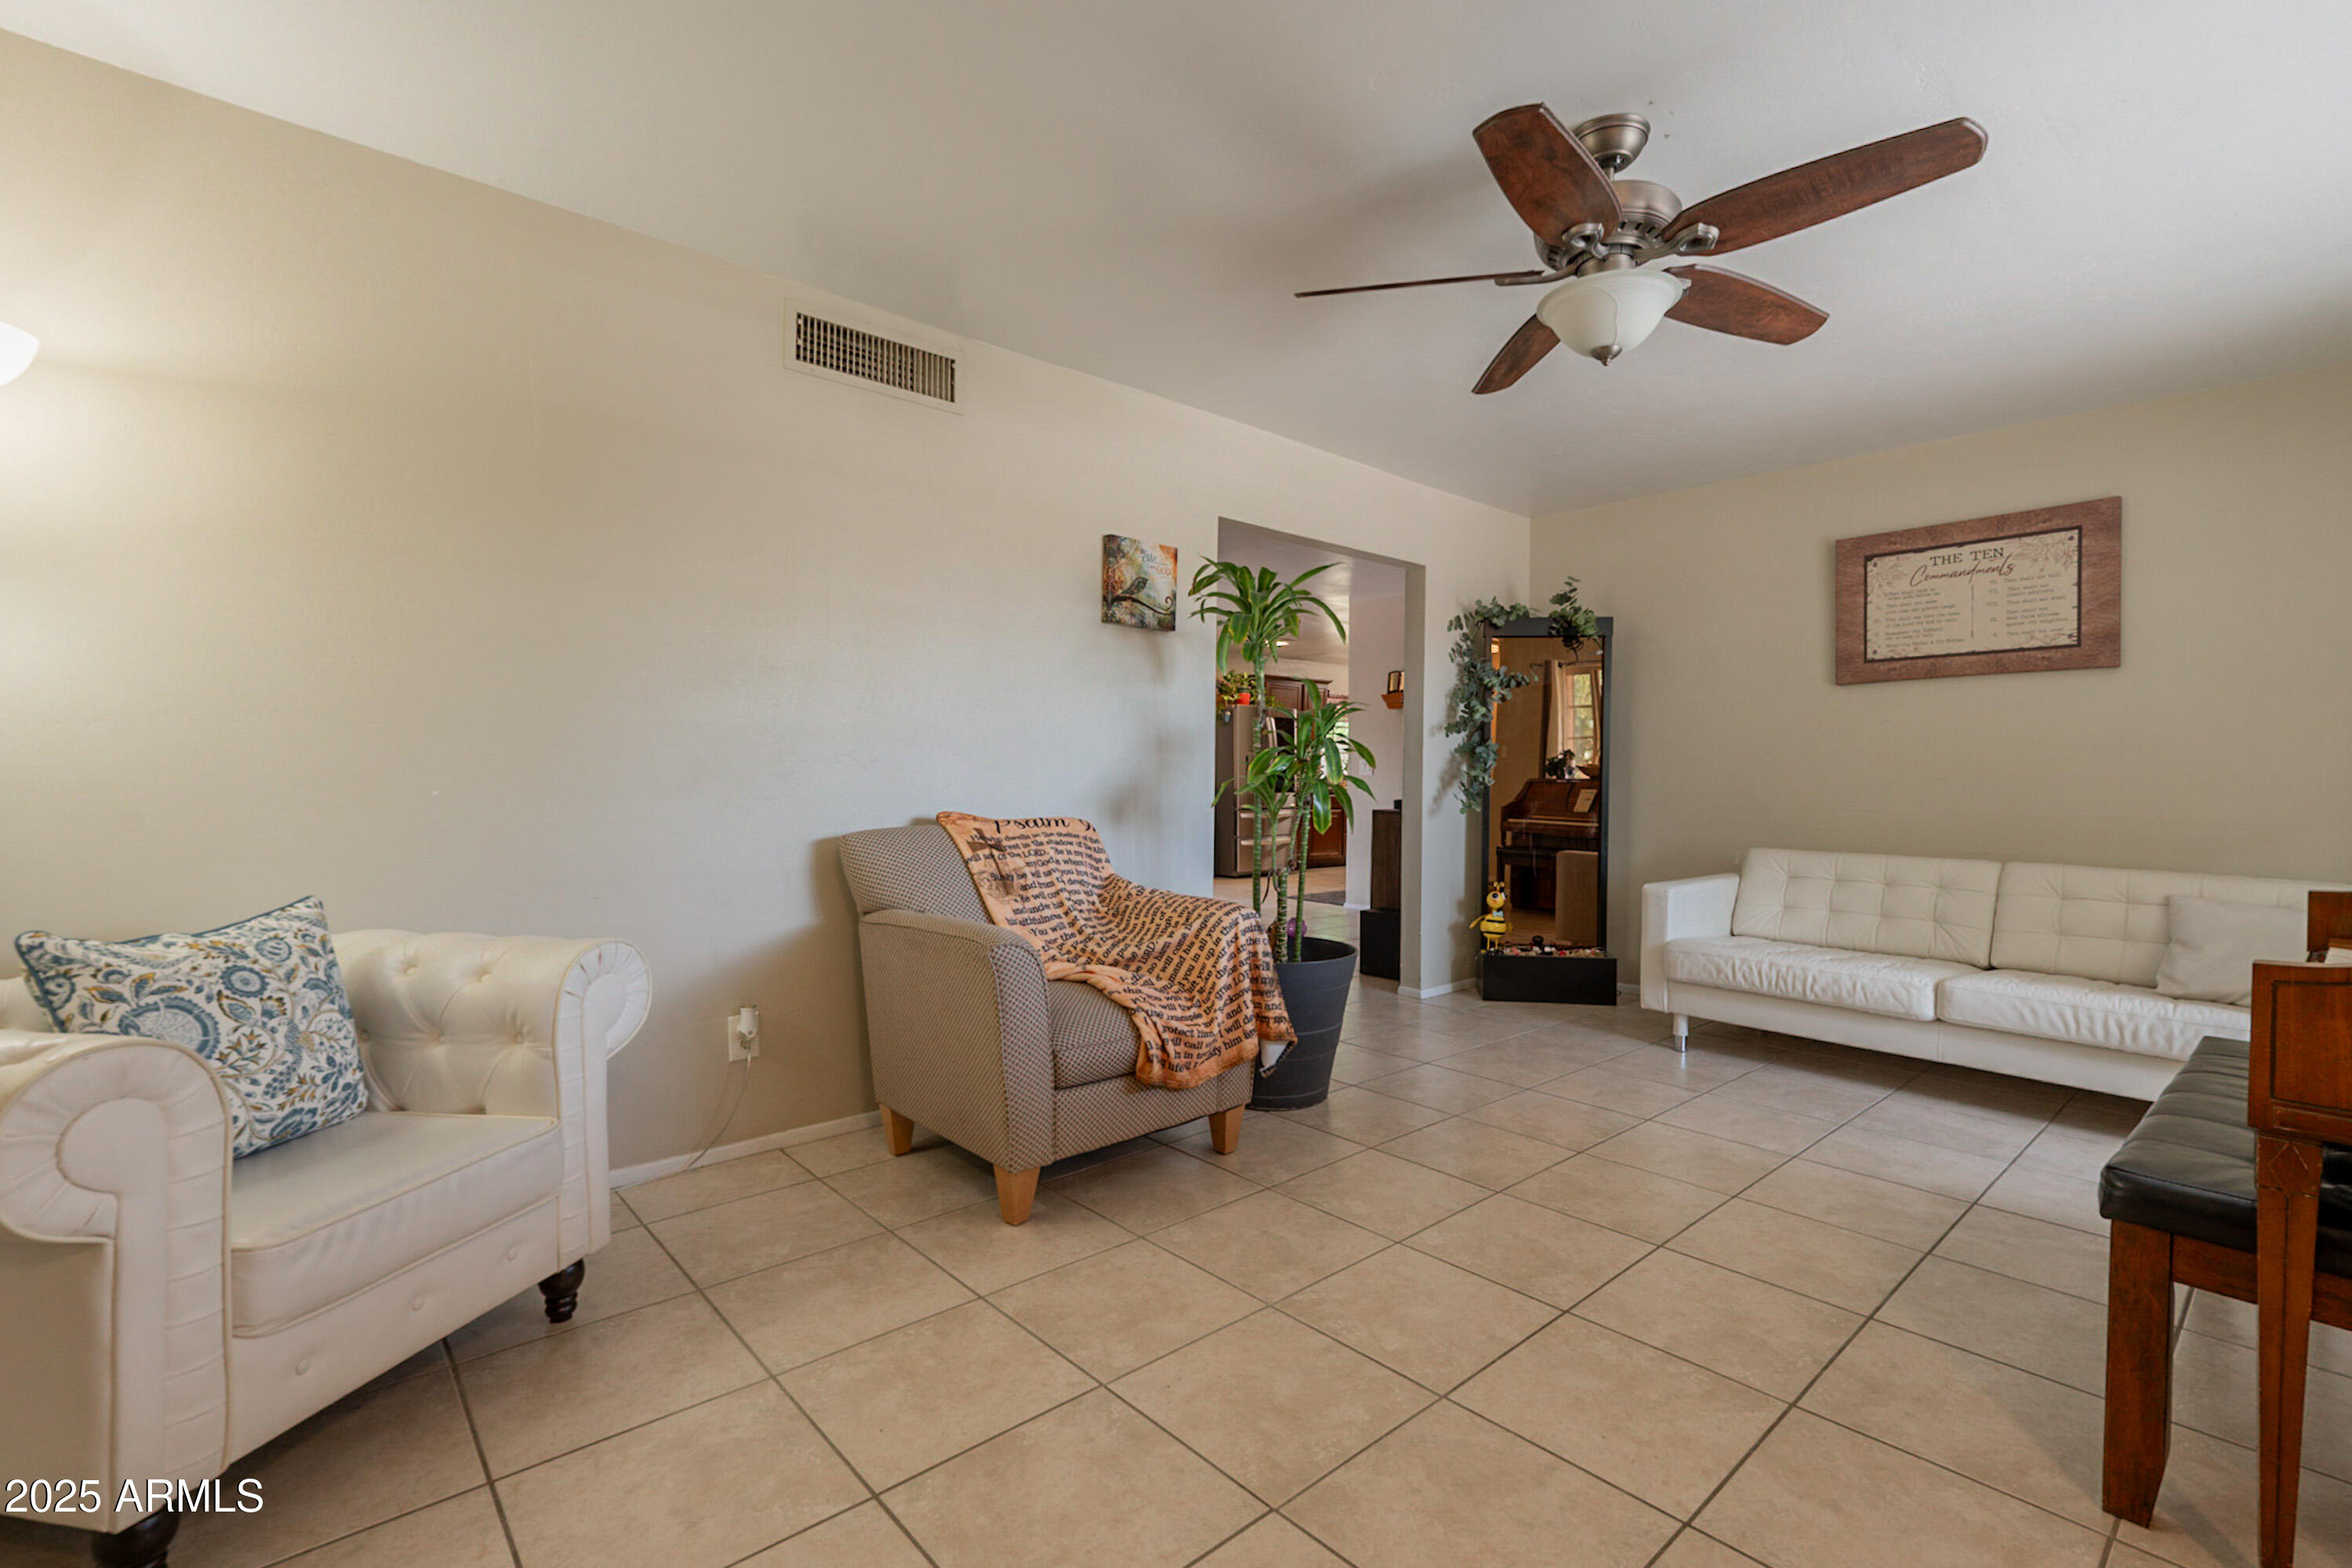
$525,000
4
bds
|
2
ba
|
1,629
sqft
|
built
1974
10601 N 36th St, Phoenix, AZ 85028
$-830
Cash flow
-8.2%
Cash-on-Cash Return
3.8%
Cap rate
0.5%
Rent to Value Ratio

Active
$425,000
2
bds
|
2
ba
|
1,235
sqft
|
built
2007
2302 N Central Ave, Phoenix, AZ 85004
$-1,343
Cash flow
-16.5%
Cash-on-Cash Return
1.9%
Cap rate
0.5%
Rent to Value Ratio
Active
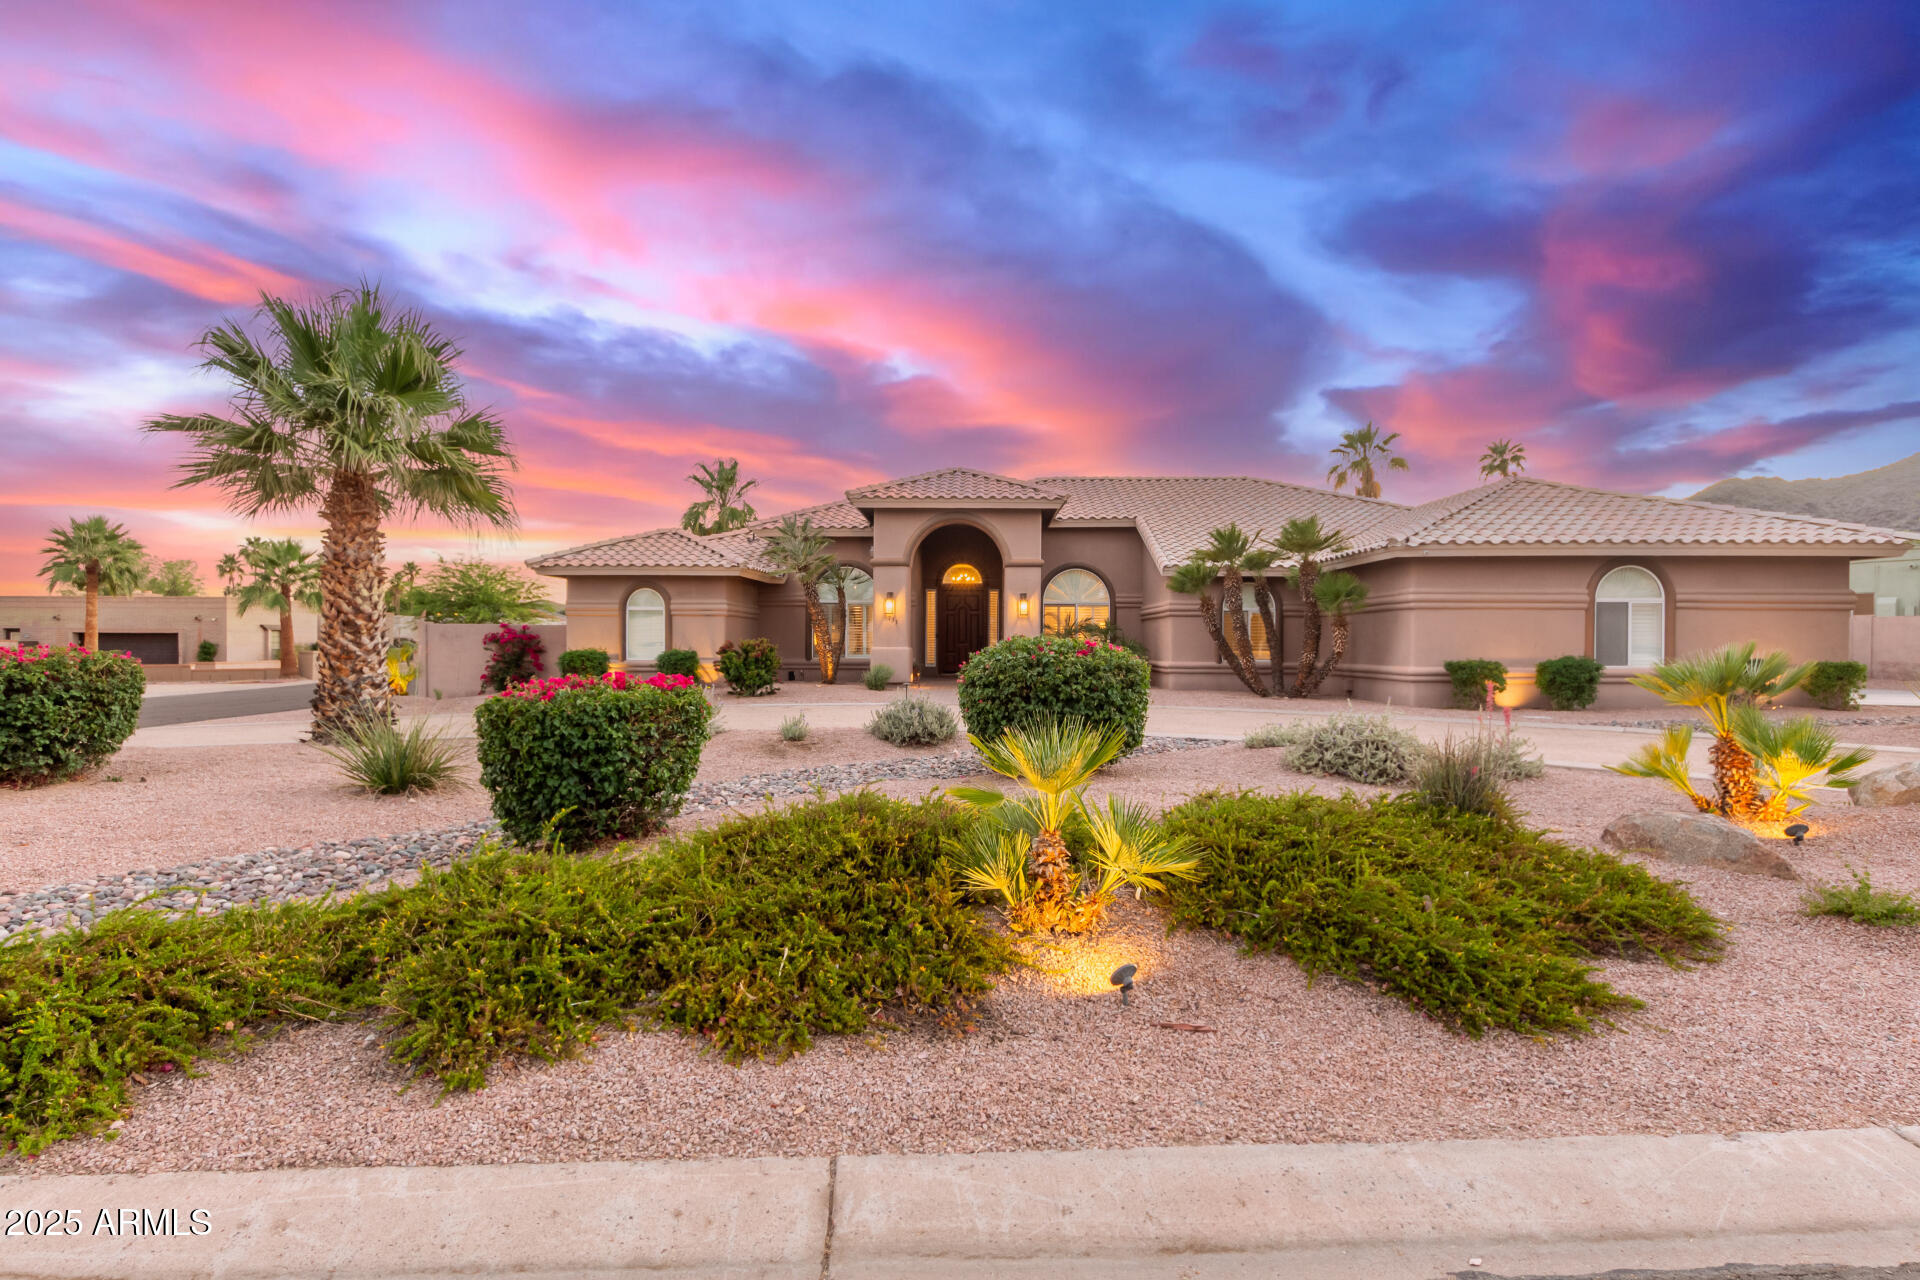
$1,299,900
5
bds
|
4
ba
|
3,544
sqft
|
built
1994
3733 E Kachina Dr, Phoenix, AZ 85044
$-4,075
Cash flow
-16.4%
Cash-on-Cash Return
1.9%
Cap rate
0.3%
Rent to Value Ratio
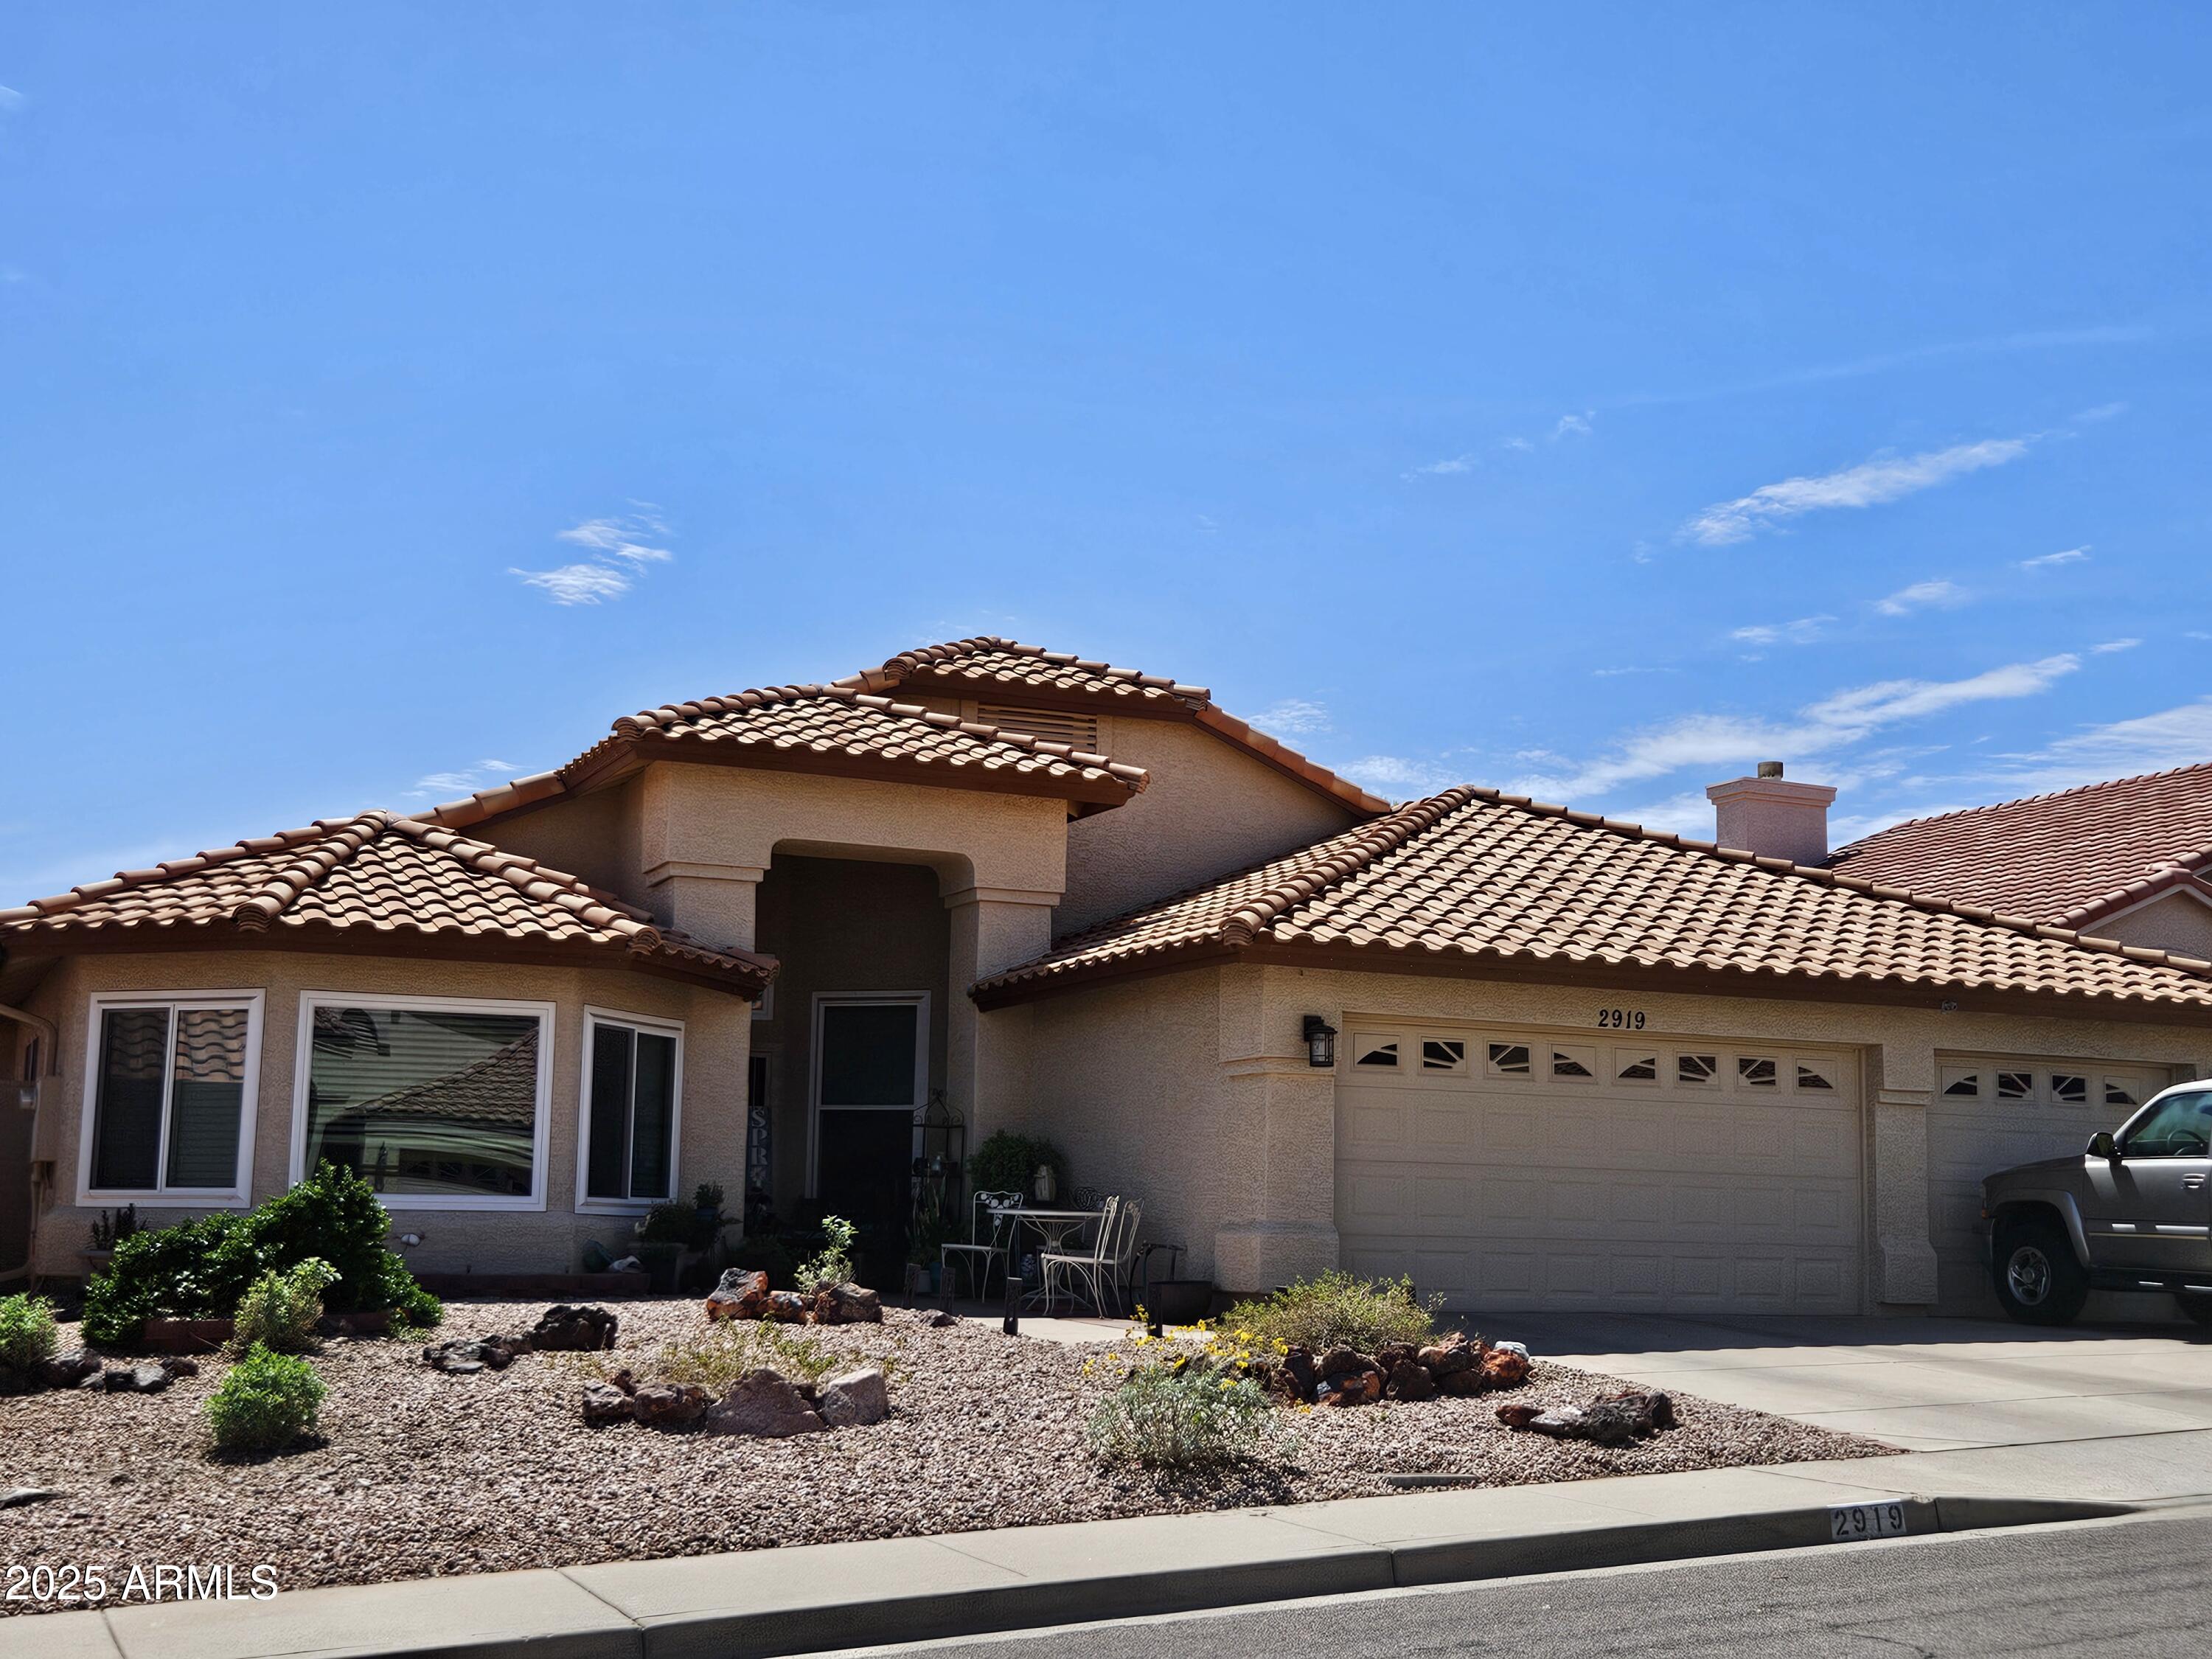
Active
$647,500
3
bds
|
2
ba
|
2,253
sqft
|
built
1991
2919 E Friess Dr, Phoenix, AZ 85032
$-1,396
Cash flow
-11.2%
Cash-on-Cash Return
3.1%
Cap rate
0.4%
Rent to Value Ratio