Phoenix, AZ Investment Properties for Sale
Browse homes for sale and investment properties in Phoenix, AZ. Refine your search by price, property type, or more.
Best cash flowing properties in Phoenix, AZ
Active
$180,000
1
bds
|
1
ba
|
754
sqft
|
built
1984
3119 W Cochise Dr, Phoenix, AZ 85051
$-269
Cash flow
-7.8%
Cash-on-Cash Return
4.5%
Cap rate
0.8%
Rent to Value Ratio

Active
$315,000
5
bds
|
3
ba
|
1,542
sqft
|
built
1950
4225 N 27th Dr, Phoenix, AZ 85017
$-287
Cash flow
-4.8%
Cash-on-Cash Return
4.6%
Cap rate
0.6%
Rent to Value Ratio
3,714 out of 3,996 properties for sale in Phoenix, AZ
Limited Results Shown
Create a free account, or log in to reveal all property listings and enjoy the complete experience.
Active
$449,000
4
bds
|
2
ba
|
1,627
sqft
|
built
1957
8326 N 8th St, Phoenix, AZ 85020
$-790
Cash flow
-9.2%
Cash-on-Cash Return
4.2%
Cap rate
0.6%
Rent to Value Ratio
Active
$769,990
4
bds
|
3
ba
|
2,718
sqft
|
built
1987
3514 E Desert Willow Rd, Phoenix, AZ 85044
$-1,995
Cash flow
-13.5%
Cash-on-Cash Return
3.2%
Cap rate
0.5%
Rent to Value Ratio
Active
$749,990
5
bds
|
4
ba
|
3,903
sqft
|
built
2007
24113 N 26th Pl, Phoenix, AZ 85024
$-1,784
Cash flow
-12.4%
Cash-on-Cash Return
3.4%
Cap rate
0.5%
Rent to Value Ratio
Active
$530,000
4
bds
|
2
ba
|
1,565
sqft
|
built
1955
2537 E Hazelwood St, Phoenix, AZ 85016
$-1,264
Cash flow
-12.4%
Cash-on-Cash Return
3.4%
Cap rate
0.5%
Rent to Value Ratio

Active
$649,000
3
bds
|
3
ba
|
2,049
sqft
|
built
1950
2807 N 8th Ave, Phoenix, AZ 85007
$-1,759
Cash flow
-14.1%
Cash-on-Cash Return
3.0%
Cap rate
0.4%
Rent to Value Ratio
Active
$284,000
2
bds
|
2
ba
|
1,049
sqft
|
built
1987
2020 W Union Hills Dr, Phoenix, AZ 85027
$-703
Cash flow
-12.9%
Cash-on-Cash Return
3.3%
Cap rate
0.6%
Rent to Value Ratio
Active
$326,000
1
bds
|
1
ba
|
797
sqft
|
built
2008
5450 E Deer Valley Dr, Phoenix, AZ 85054
$-1,218
Cash flow
-19.5%
Cash-on-Cash Return
1.8%
Cap rate
0.6%
Rent to Value Ratio
Active
$255,000
3
bds
|
2
ba
|
1,328
sqft
|
built
1979
10828 N Biltmore Dr, Phoenix, AZ 85029
$-474
Cash flow
-9.7%
Cash-on-Cash Return
4.0%
Cap rate
0.7%
Rent to Value Ratio
Active
$680,000
3
bds
|
2
ba
|
1,868
sqft
|
built
2016
17850 N 68th St, Phoenix, AZ 85054
$-2,218
Cash flow
-17.0%
Cash-on-Cash Return
2.4%
Cap rate
0.5%
Rent to Value Ratio

Active
$499,900
1
bds
|
2
ba
|
1,014
sqft
|
built
2018
3131 N Central Ave, Phoenix, AZ 85012
$-1,843
Cash flow
-19.2%
Cash-on-Cash Return
1.8%
Cap rate
0.4%
Rent to Value Ratio
Active
$1,525,000
4
bds
|
5
ba
|
3,831
sqft
|
built
2018
625 W Echo Ln, Phoenix, AZ 85021
$-3,486
Cash flow
-11.9%
Cash-on-Cash Return
3.5%
Cap rate
0.5%
Rent to Value Ratio
Active
$569,000
3
bds
|
2
ba
|
1,788
sqft
|
built
2017
3048 W Thorn Tree Dr, Phoenix, AZ 85085
$-1,541
Cash flow
-14.1%
Cash-on-Cash Return
3.0%
Cap rate
0.4%
Rent to Value Ratio
Active
$459,990
4
bds
|
3
ba
|
2,046
sqft
|
built
2019
7620 W Pioneer St, Phoenix, AZ 85043
$-915
Cash flow
-10.4%
Cash-on-Cash Return
3.9%
Cap rate
0.5%
Rent to Value Ratio
Active
$345,000
4
bds
|
2
ba
|
1,567
sqft
|
built
1995
9967 W Devonshire Ave, Phoenix, AZ 85037
$-710
Cash flow
-10.7%
Cash-on-Cash Return
3.8%
Cap rate
0.5%
Rent to Value Ratio
Active
$845,000
4
bds
|
3
ba
|
2,465
sqft
|
built
2019
2855 E Tina Dr, Phoenix, AZ 85050
$-2,542
Cash flow
-15.7%
Cash-on-Cash Return
2.7%
Cap rate
0.4%
Rent to Value Ratio
Active
$275,000
1
bds
|
1
ba
|
850
sqft
|
built
1983
4303 E Cactus Rd, Phoenix, AZ 85032
$-982
Cash flow
-18.6%
Cash-on-Cash Return
2.0%
Cap rate
0.6%
Rent to Value Ratio

Active
$599,000
4
bds
|
2
ba
|
1,860
sqft
|
built
1952
5745 N 13th St, Phoenix, AZ 85014
$-1,141
Cash flow
-9.9%
Cash-on-Cash Return
4.0%
Cap rate
0.5%
Rent to Value Ratio
Active
$699,000
2
bds
|
2
ba
|
1,706
sqft
|
built
2005
114 W Adams St, Phoenix, AZ 85003
$-2,801
Cash flow
-20.9%
Cash-on-Cash Return
1.5%
Cap rate
0.5%
Rent to Value Ratio
Active
$299,000
1
bds
|
1
ba
|
720
sqft
|
built
1964
805 N 4th Ave, Phoenix, AZ 85003
$-886
Cash flow
-15.5%
Cash-on-Cash Return
2.7%
Cap rate
0.7%
Rent to Value Ratio
Active
$250,000
2
bds
|
2
ba
|
1,088
sqft
|
built
1972
2645 W Wolf St, Phoenix, AZ 85017
$-642
Cash flow
-13.4%
Cash-on-Cash Return
3.2%
Cap rate
0.6%
Rent to Value Ratio
Active
$180,000
1
bds
|
1
ba
|
754
sqft
|
built
1984
3119 W Cochise Dr, Phoenix, AZ 85051
$-269
Cash flow
-7.8%
Cash-on-Cash Return
4.5%
Cap rate
0.8%
Rent to Value Ratio
Active
$775,000
3
bds
|
2
ba
|
2,183
sqft
|
built
1955
827 E Mc Lellan Blvd, Phoenix, AZ 85014
$-2,369
Cash flow
-15.9%
Cash-on-Cash Return
2.6%
Cap rate
0.4%
Rent to Value Ratio
Active
$625,000
3
bds
|
2
ba
|
1,580
sqft
|
built
1945
1613 W Flower Cir N, Phoenix, AZ 85015
$-1,412
Cash flow
-11.8%
Cash-on-Cash Return
3.6%
Cap rate
0.5%
Rent to Value Ratio
Active
$500,000
2
bds
|
3
ba
|
1,458
sqft
|
built
1988
727 W Maryland Ave, Phoenix, AZ 85013
$-991
Cash flow
-10.3%
Cash-on-Cash Return
3.9%
Cap rate
0.6%
Rent to Value Ratio
Active
$167,000
2
bds
|
2
ba
|
1,020
sqft
|
built
1970
7126 N 19th Ave, Phoenix, AZ 85021
$-335
Cash flow
-10.5%
Cash-on-Cash Return
3.9%
Cap rate
0.8%
Rent to Value Ratio

Active
$480,000
3
bds
|
3
ba
|
1,688
sqft
|
built
1986
6223 N 12th St, Phoenix, AZ 85014
$-1,461
Cash flow
-15.9%
Cash-on-Cash Return
2.6%
Cap rate
0.5%
Rent to Value Ratio
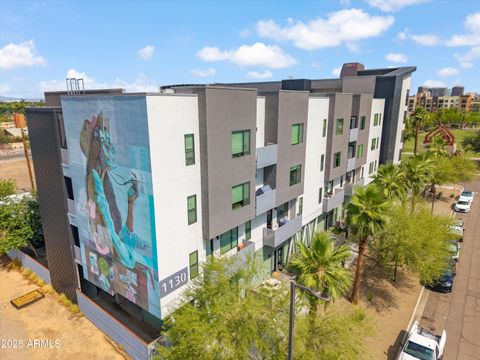
Active
$454,000
2
bds
|
2
ba
|
990
sqft
|
built
2017
1130 N 2nd St, Phoenix, AZ 85004
$-1,036
Cash flow
-11.9%
Cash-on-Cash Return
3.5%
Cap rate
0.6%
Rent to Value Ratio
Active
$310,000
1
bds
|
1
ba
|
850
sqft
|
built
1997
4644 N 22nd St, Phoenix, AZ 85016
$-857
Cash flow
-14.4%
Cash-on-Cash Return
2.9%
Cap rate
0.5%
Rent to Value Ratio
Active
$417,999
3
bds
|
2
ba
|
1,292
sqft
|
built
1996
7887 N 16th St, Phoenix, AZ 85020
$-1,168
Cash flow
-14.6%
Cash-on-Cash Return
2.9%
Cap rate
0.6%
Rent to Value Ratio

Active
$310,000
1
bds
|
1
ba
|
850
sqft
|
built
1983
12222 N Paradise Village Pkwy S, Phoenix, AZ 85032
$-1,026
Cash flow
-17.3%
Cash-on-Cash Return
2.3%
Cap rate
0.6%
Rent to Value Ratio
Active
$515,000
4
bds
|
3
ba
|
2,482
sqft
|
built
1948
6728 N 24th Dr, Phoenix, AZ 85015
$-1,618
Cash flow
-16.4%
Cash-on-Cash Return
2.5%
Cap rate
0.3%
Rent to Value Ratio
Active
$349,900
3
bds
|
3
ba
|
1,444
sqft
|
built
2008
4925 S 5th Ave, Phoenix, AZ 85041
$-513
Cash flow
-7.6%
Cash-on-Cash Return
3.9%
Cap rate
0.5%
Rent to Value Ratio
Active
$299,000
2
bds
|
1
ba
|
976
sqft
|
built
1972
2508 N 58th Ln, Phoenix, AZ 85035
$-438
Cash flow
-7.6%
Cash-on-Cash Return
3.9%
Cap rate
0.5%
Rent to Value Ratio
Active
$499,888
3
bds
|
2
ba
|
2,074
sqft
|
built
1972
4701 N 63rd Dr, Phoenix, AZ 85033
$-1,246
Cash flow
-13.0%
Cash-on-Cash Return
2.7%
Cap rate
0.4%
Rent to Value Ratio
Active
$789,000
5
bds
|
3
ba
|
3,138
sqft
|
built
2002
6014 W Oberlin Way, Phoenix, AZ 85083
$-1,874
Cash flow
-12.4%
Cash-on-Cash Return
2.8%
Cap rate
0.4%
Rent to Value Ratio
Active
$315,000
5
bds
|
3
ba
|
1,542
sqft
|
built
1950
4225 N 27th Dr, Phoenix, AZ 85017
$-287
Cash flow
-4.8%
Cash-on-Cash Return
4.6%
Cap rate
0.6%
Rent to Value Ratio
Active
$1,100,000
3
bds
|
2
ba
|
1,500
sqft
|
built
1954
3201 E Colter St, Phoenix, AZ 85018
$-2,773
Cash flow
-13.2%
Cash-on-Cash Return
2.7%
Cap rate
0.4%
Rent to Value Ratio
Active
$409,900
3
bds
|
2
ba
|
1,446
sqft
|
built
1977
18818 N 12th Ave, Phoenix, AZ 85027
$-659
Cash flow
-8.4%
Cash-on-Cash Return
3.8%
Cap rate
0.5%
Rent to Value Ratio
Active
$649,000
6
bds
|
3
ba
|
2,177
sqft
|
built
1999
21813 N 40th Way, Phoenix, AZ 85050
$-1,398
Cash flow
-11.2%
Cash-on-Cash Return
3.1%
Cap rate
0.4%
Rent to Value Ratio
Active
$749,000
4
bds
|
4
ba
|
2,035
sqft
|
built
1950
724 W Missouri Ave, Phoenix, AZ 85013
$-2,130
Cash flow
-14.8%
Cash-on-Cash Return
2.3%
Cap rate
0.3%
Rent to Value Ratio