Phoenix, AZ Investment Properties for Sale
Browse homes for sale and investment properties in Phoenix, AZ. Refine your search by price, property type, or more.
Best cash flowing properties in Phoenix, AZ
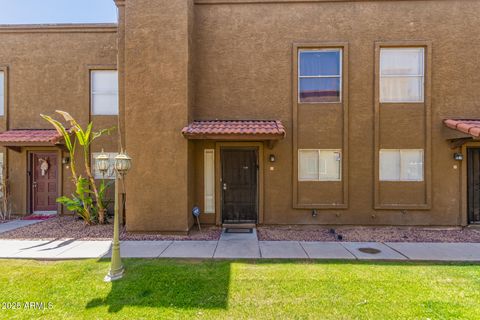
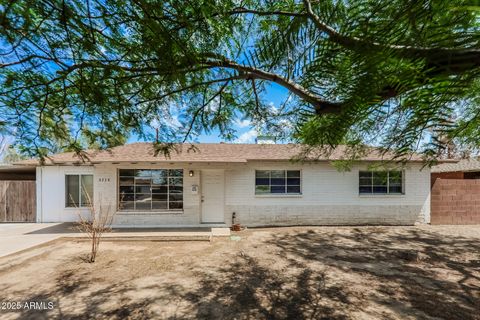
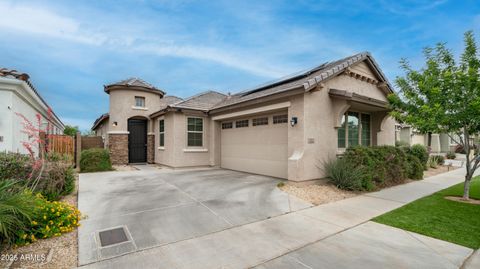
Active
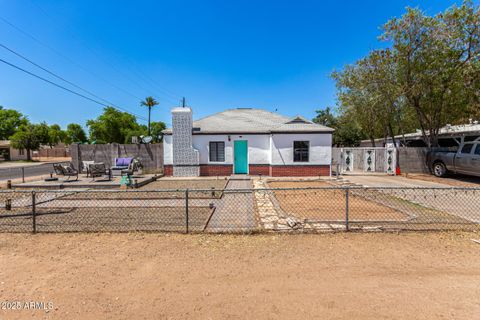
$189,900
2
bds
|
2
ba
|
968
sqft
|
built
1984
16225 N 30th St, Phoenix, AZ 85032
$-319
Cash flow
-8.8%
Cash-on-Cash Return
4.2%
Cap rate
0.7%
Rent to Value Ratio
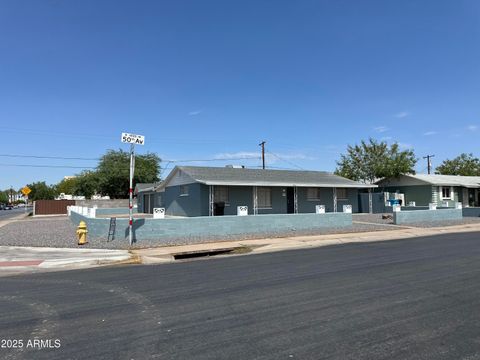
Active
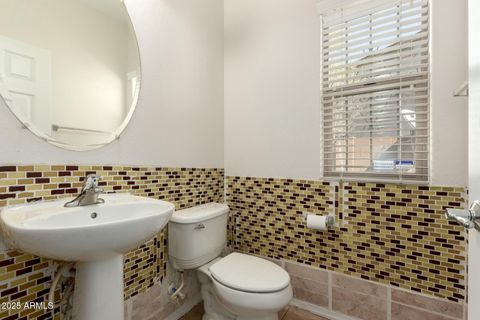
$274,000
bds
|
0
ba
|
0
sqft
|
built
1936
1318 S 1st Ave, Phoenix, AZ 85003
$-368
Cash flow
-7.0%
Cash-on-Cash Return
4.7%
Cap rate
0.6%
Rent to Value Ratio
3,703 out of 3,984 properties for sale in Phoenix, AZ
Limited Results Shown
Create a free account, or log in to reveal all property listings and enjoy the complete experience.
Active
$899,000
3
bds
|
2
ba
|
1,989
sqft
|
built
1947
346 W Edgemont Ave, Phoenix, AZ 85003
$-2,709
Cash flow
-15.7%
Cash-on-Cash Return
2.1%
Cap rate
0.3%
Rent to Value Ratio
Active
$459,000
3
bds
|
2
ba
|
1,224
sqft
|
built
1971
3021 E Windrose Dr, Phoenix, AZ 85032
$-1,018
Cash flow
-11.6%
Cash-on-Cash Return
3.0%
Cap rate
0.4%
Rent to Value Ratio
Active
$1,050,000
4
bds
|
3
ba
|
4,863
sqft
|
built
2013
5542 W Big Oak St, Phoenix, AZ 85083
$-3,021
Cash flow
-15.0%
Cash-on-Cash Return
2.2%
Cap rate
0.3%
Rent to Value Ratio
Active
$549,900
3
bds
|
2
ba
|
1,322
sqft
|
built
1996
4632 E Melinda Ln, Phoenix, AZ 85050
$-1,143
Cash flow
-10.8%
Cash-on-Cash Return
3.2%
Cap rate
0.5%
Rent to Value Ratio
Active
$435,000
4
bds
|
3
ba
|
2,378
sqft
|
built
2001
6537 W Pioneer St, Phoenix, AZ 85043
$-746
Cash flow
-8.9%
Cash-on-Cash Return
3.6%
Cap rate
0.5%
Rent to Value Ratio
Active
$1,050,000
3
bds
|
3
ba
|
2,452
sqft
|
built
2015
1336 E Belmont Ave, Phoenix, AZ 85020
$-2,636
Cash flow
-13.1%
Cash-on-Cash Return
2.7%
Cap rate
0.4%
Rent to Value Ratio
Active
$330,000
2
bds
|
1
ba
|
832
sqft
|
built
1945
2802 E Virginia Ave, Phoenix, AZ 85008
$-524
Cash flow
-8.3%
Cash-on-Cash Return
3.8%
Cap rate
0.5%
Rent to Value Ratio

Active
$575,000
2
bds
|
2
ba
|
1,249
sqft
|
built
2006
4808 N 24th St, Phoenix, AZ 85016
$-2,362
Cash flow
-21.4%
Cash-on-Cash Return
0.7%
Cap rate
0.4%
Rent to Value Ratio
Active
$469,900
3
bds
|
3
ba
|
1,909
sqft
|
built
2008
16238 N 22nd Ln, Phoenix, AZ 85023
$-801
Cash flow
-8.9%
Cash-on-Cash Return
3.6%
Cap rate
0.5%
Rent to Value Ratio
Active
$440,000
4
bds
|
3
ba
|
1,469
sqft
|
built
1980
3725 E Karen Dr, Phoenix, AZ 85032
$-839
Cash flow
-9.9%
Cash-on-Cash Return
3.4%
Cap rate
0.5%
Rent to Value Ratio
Active
$317,000
1
bds
|
1
ba
|
485
sqft
|
built
2017
1130 N 2nd St, Phoenix, AZ 85004
$-723
Cash flow
-11.9%
Cash-on-Cash Return
2.9%
Cap rate
0.5%
Rent to Value Ratio
Active
$360,000
3
bds
|
2
ba
|
1,708
sqft
|
built
1956
3238 W Rose Ln, Phoenix, AZ 85017
$-543
Cash flow
-7.9%
Cash-on-Cash Return
3.9%
Cap rate
0.5%
Rent to Value Ratio
Active
$310,000
2
bds
|
2
ba
|
1,006
sqft
|
built
1989
2025 E Campbell Ave, Phoenix, AZ 85016
$-484
Cash flow
-8.1%
Cash-on-Cash Return
3.8%
Cap rate
0.6%
Rent to Value Ratio
Active
$2,396,000
5
bds
|
6
ba
|
3,727
sqft
|
built
2022
4131 E Roma Ave, Phoenix, AZ 85018
$-4,764
Cash flow
-10.4%
Cash-on-Cash Return
3.3%
Cap rate
0.4%
Rent to Value Ratio
Active
$348,000
5
bds
|
2
ba
|
1,534
sqft
|
built
1956
4502 N 50th Ave, Phoenix, AZ 85031
$-483
Cash flow
-7.2%
Cash-on-Cash Return
4.0%
Cap rate
0.5%
Rent to Value Ratio
Active
$469,000
3
bds
|
2
ba
|
1,742
sqft
|
built
2019
2822 E Hidalgo Ave, Phoenix, AZ 85040
$-667
Cash flow
-7.4%
Cash-on-Cash Return
4.0%
Cap rate
0.6%
Rent to Value Ratio
Active
$550,000
2
bds
|
3
ba
|
1,093
sqft
|
built
1949
1940 E Indianola Ave, Phoenix, AZ 85016
$-1,674
Cash flow
-15.9%
Cash-on-Cash Return
2.6%
Cap rate
0.4%
Rent to Value Ratio

Active
$525,000
3
bds
|
2
ba
|
1,661
sqft
|
built
1998
1641 W Windsong Dr, Phoenix, AZ 85045
$-1,020
Cash flow
-10.1%
Cash-on-Cash Return
3.3%
Cap rate
0.5%
Rent to Value Ratio
Active
$337,000
3
bds
|
2
ba
|
1,606
sqft
|
built
1971
5933 W Mitchell Dr, Phoenix, AZ 85033
$-672
Cash flow
-10.4%
Cash-on-Cash Return
3.9%
Cap rate
0.5%
Rent to Value Ratio
Active
$274,000
bds
|
0
ba
|
0
sqft
|
built
1936
1318 S 1st Ave, Phoenix, AZ 85003
$-368
Cash flow
-7.0%
Cash-on-Cash Return
4.7%
Cap rate
0.6%
Rent to Value Ratio
Active
$189,900
2
bds
|
2
ba
|
968
sqft
|
built
1984
16225 N 30th St, Phoenix, AZ 85032
$-319
Cash flow
-8.8%
Cash-on-Cash Return
4.2%
Cap rate
0.7%
Rent to Value Ratio
Active
$380,000
3
bds
|
3
ba
|
1,362
sqft
|
built
1998
17606 N 17th Pl, Phoenix, AZ 85022
$-866
Cash flow
-11.9%
Cash-on-Cash Return
3.5%
Cap rate
0.5%
Rent to Value Ratio

Active
$849,900
3
bds
|
2
ba
|
1,793
sqft
|
built
1943
522 W Cambridge Ave, Phoenix, AZ 85003
$-1,863
Cash flow
-11.4%
Cash-on-Cash Return
3.6%
Cap rate
0.5%
Rent to Value Ratio