Plymouth, MA Investment Properties for Sale
Browse homes for sale and investment properties in Plymouth, MA. Refine your search by price, property type, or more.
Best cash flowing properties in Plymouth, MA
Active
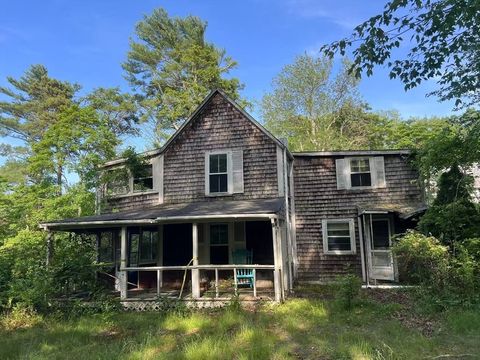
$429,900
3
bds
|
1
ba
|
1,225
sqft
|
built
1954
64 Black Cat Rd, Plymouth, MA 02360
$-567
Cash flow
-6.9%
Cash-on-Cash Return
4.7%
Cap rate
0.7%
Rent to Value Ratio
Active
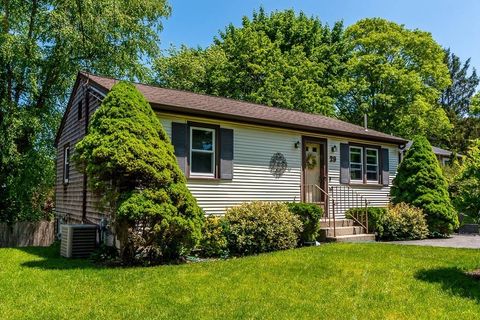
$449,000
2
bds
|
1
ba
|
818
sqft
|
built
1985
29 Coral St, Plymouth, MA 02360
$-771
Cash flow
-9.0%
Cash-on-Cash Return
4.2%
Cap rate
0.6%
Rent to Value Ratio
89 out of 145 properties for sale in Plymouth, MA
Limited Results Shown
Create a free account, or log in to reveal all property listings and enjoy the complete experience.
Active
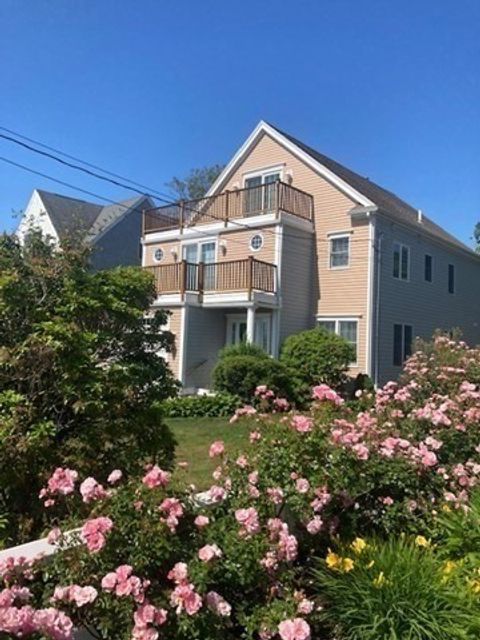
$845,000
3
bds
|
3
ba
|
2,324
sqft
|
built
2002
107 Shore Dr, Plymouth, MA 02360
$-2,012
Cash flow
-12.4%
Cash-on-Cash Return
2.8%
Cap rate
0.5%
Rent to Value Ratio
Active
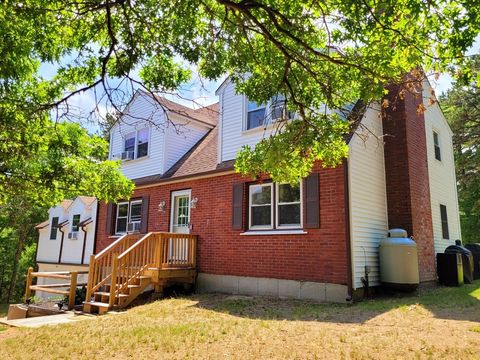
$699,900
4
bds
|
3
ba
|
2,419
sqft
|
built
1986
871 Long Pond Rd, Plymouth, MA 02360
$-1,389
Cash flow
-10.4%
Cash-on-Cash Return
3.3%
Cap rate
0.5%
Rent to Value Ratio
Active
$1,199,999
5
bds
|
4
ba
|
3,400
sqft
|
built
2024
10 Crescent St, Plymouth, MA 02360
$-1,824
Cash flow
-7.9%
Cash-on-Cash Return
4.4%
Cap rate
0.6%
Rent to Value Ratio
Active
$995,000
2
bds
|
2
ba
|
1,554
sqft
|
built
1954
52 Taylor Ave, Plymouth, MA 02360
$-3,444
Cash flow
-18.1%
Cash-on-Cash Return
2.1%
Cap rate
0.4%
Rent to Value Ratio
Active
$650,000
3
bds
|
3
ba
|
1,626
sqft
|
built
1970
12 Columbia Rd, Plymouth, MA 02360
$-1,958
Cash flow
-15.7%
Cash-on-Cash Return
2.6%
Cap rate
0.4%
Rent to Value Ratio
Active
$599,900
4
bds
|
2
ba
|
1,738
sqft
|
built
1975
94 Bourne Rd, Plymouth, MA 02360
$-917
Cash flow
-8.0%
Cash-on-Cash Return
3.8%
Cap rate
0.6%
Rent to Value Ratio
Active
$925,000
3
bds
|
3
ba
|
1,913
sqft
|
built
2018
16 Walking Stick, Plymouth, MA 02360
$-2,092
Cash flow
-11.8%
Cash-on-Cash Return
3.0%
Cap rate
0.6%
Rent to Value Ratio
Active
$1,049,000
2
bds
|
3
ba
|
3,576
sqft
|
built
2010
17 Saddleback, Plymouth, MA 02360
$-3,207
Cash flow
-16.0%
Cash-on-Cash Return
2.6%
Cap rate
0.5%
Rent to Value Ratio
Active
$1,000,000
4
bds
|
2
ba
|
2,050
sqft
|
built
1958
18 Beach St, Plymouth, MA 02360
$-3,861
Cash flow
-20.1%
Cash-on-Cash Return
1.6%
Cap rate
0.3%
Rent to Value Ratio
Active
$513,000
3
bds
|
2
ba
|
1,882
sqft
|
built
1900
24 Gardner Dr, Plymouth, MA 02360
$-895
Cash flow
-9.1%
Cash-on-Cash Return
4.2%
Cap rate
0.6%
Rent to Value Ratio
Active
$980,000
4
bds
|
4
ba
|
2,564
sqft
|
built
1987
67 Raymond Rd, Plymouth, MA 02360
$-3,027
Cash flow
-16.1%
Cash-on-Cash Return
2.6%
Cap rate
0.4%
Rent to Value Ratio
Active
$700,000
2
bds
|
3
ba
|
2,201
sqft
|
built
2003
49 Champlain Cir, Plymouth, MA 02360
$-1,928
Cash flow
-14.4%
Cash-on-Cash Return
3.0%
Cap rate
0.6%
Rent to Value Ratio
Active
$819,900
2
bds
|
2
ba
|
1,858
sqft
|
built
2014
11 Cobblestone, Plymouth, MA 02360
$-2,470
Cash flow
-15.7%
Cash-on-Cash Return
2.1%
Cap rate
0.4%
Rent to Value Ratio
Active
$1,349,000
4
bds
|
3
ba
|
2,425
sqft
|
built
1945
106 Rocky Hill Rd, Plymouth, MA 02360
$-4,980
Cash flow
-19.3%
Cash-on-Cash Return
1.2%
Cap rate
0.2%
Rent to Value Ratio
Active
$985,000
4
bds
|
3
ba
|
3,069
sqft
|
built
1987
29 Wyndemere Ct, Plymouth, MA 02360
$-2,658
Cash flow
-14.1%
Cash-on-Cash Return
2.4%
Cap rate
0.4%
Rent to Value Ratio
Active
$529,900
3
bds
|
1
ba
|
1,509
sqft
|
built
1970
24 Lantern Ln, Plymouth, MA 02360
$-777
Cash flow
-7.7%
Cash-on-Cash Return
3.9%
Cap rate
0.6%
Rent to Value Ratio
Active
$995,000
3
bds
|
3
ba
|
3,000
sqft
|
built
1935
10 Brewster Ave, Plymouth, MA 02360
$-2,691
Cash flow
-14.1%
Cash-on-Cash Return
3.0%
Cap rate
0.5%
Rent to Value Ratio

Active
$1,150,000
9
bds
|
3
ba
|
2,856
sqft
|
built
1870
45 Cherry St, Plymouth, MA 02360
$-4,820
Cash flow
-21.9%
Cash-on-Cash Return
1.2%
Cap rate
0.2%
Rent to Value Ratio
Active
$549,000
2
bds
|
2
ba
|
1,121
sqft
|
built
1887
16 Main St, Plymouth, MA 02360
$-1,740
Cash flow
-16.5%
Cash-on-Cash Return
2.5%
Cap rate
0.5%
Rent to Value Ratio
Active
$1,259,000
2
bds
|
3
ba
|
4,138
sqft
|
built
2019
21 Snapping Bow, Plymouth, MA 02360
$-4,560
Cash flow
-18.9%
Cash-on-Cash Return
1.9%
Cap rate
0.4%
Rent to Value Ratio
Active
$985,000
4
bds
|
4
ba
|
3,879
sqft
|
built
2007
11 Nautical Way, Plymouth, MA 02360
$-3,097
Cash flow
-16.4%
Cash-on-Cash Return
2.5%
Cap rate
0.4%
Rent to Value Ratio

Active
$499,900
1
bds
|
2
ba
|
1,160
sqft
|
built
1740
146 Herring Pond Rd, Plymouth, MA 02360
$-1,054
Cash flow
-11.0%
Cash-on-Cash Return
3.7%
Cap rate
0.6%
Rent to Value Ratio

Active
$699,000
3
bds
|
2
ba
|
1,368
sqft
|
built
1900
28 Davis St, Plymouth, MA 02360
$-1,746
Cash flow
-13.0%
Cash-on-Cash Return
3.3%
Cap rate
0.5%
Rent to Value Ratio
Active
$1,375,000
4
bds
|
4
ba
|
3,454
sqft
|
built
1900
24 Arnold Ave, Plymouth, MA 02360
$-4,880
Cash flow
-18.5%
Cash-on-Cash Return
2.0%
Cap rate
0.3%
Rent to Value Ratio
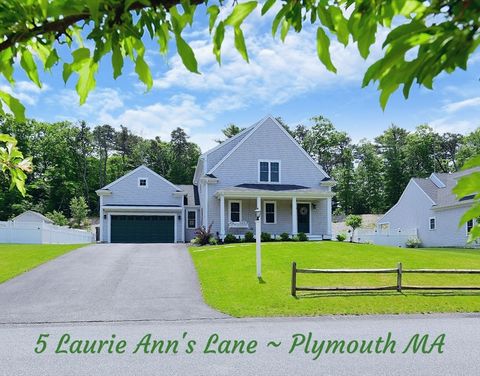
Active
$875,000
3
bds
|
3
ba
|
2,310
sqft
|
built
2022
5 Laurie Anns Ln, Plymouth, MA 02360
$-2,040
Cash flow
-12.2%
Cash-on-Cash Return
3.5%
Cap rate
0.6%
Rent to Value Ratio
Active
$579,900
2
bds
|
1
ba
|
1,638
sqft
|
built
1969
275 Carver Rd, Plymouth, MA 02360
$-1,393
Cash flow
-12.5%
Cash-on-Cash Return
3.4%
Cap rate
0.6%
Rent to Value Ratio
Active
$899,900
4
bds
|
3
ba
|
2,766
sqft
|
built
2024
29 Bumpus Rd, Plymouth, MA 02360
$-3,535
Cash flow
-20.5%
Cash-on-Cash Return
1.6%
Cap rate
0.3%
Rent to Value Ratio
Active
$999,000
4
bds
|
4
ba
|
3,997
sqft
|
built
2013
249 Little Sandy Pond Rd, Plymouth, MA 02360
$-3,015
Cash flow
-15.7%
Cash-on-Cash Return
2.6%
Cap rate
0.4%
Rent to Value Ratio
Active
$1,350,000
3
bds
|
5
ba
|
3,306
sqft
|
built
2004
11 Great Kame, Plymouth, MA 02360
$-4,639
Cash flow
-17.9%
Cash-on-Cash Return
2.1%
Cap rate
0.4%
Rent to Value Ratio
Active
$965,000
4
bds
|
3
ba
|
3,300
sqft
|
built
2002
407 Raymond Rd, Plymouth, MA 02360
$-2,670
Cash flow
-14.4%
Cash-on-Cash Return
2.9%
Cap rate
0.5%
Rent to Value Ratio
Active
$765,000
5
bds
|
3
ba
|
1,760
sqft
|
built
1955
23 Emerson Rd, Plymouth, MA 02360
$-2,076
Cash flow
-14.2%
Cash-on-Cash Return
3.0%
Cap rate
0.5%
Rent to Value Ratio
Active
$779,000
3
bds
|
2
ba
|
2,105
sqft
|
built
1972
76 Scarlet Dr, Plymouth, MA 02360
$-1,897
Cash flow
-12.7%
Cash-on-Cash Return
3.3%
Cap rate
0.5%
Rent to Value Ratio
Active
$1,295,000
3
bds
|
4
ba
|
4,029
sqft
|
built
2005
48 Great Kame, Plymouth, MA 02360
$-4,231
Cash flow
-17.0%
Cash-on-Cash Return
2.3%
Cap rate
0.4%
Rent to Value Ratio

Active
$950,000
3
bds
|
3
ba
|
2,505
sqft
|
built
2014
9 Cobblestone, Plymouth, MA 02360
$-3,109
Cash flow
-17.1%
Cash-on-Cash Return
2.3%
Cap rate
0.5%
Rent to Value Ratio
Active
$650,000
3
bds
|
2
ba
|
2,050
sqft
|
built
1976
40 Jan Marie Dr, Plymouth, MA 02360
$-1,533
Cash flow
-12.3%
Cash-on-Cash Return
3.4%
Cap rate
0.5%
Rent to Value Ratio
Active
$699,000
3
bds
|
2
ba
|
1,320
sqft
|
built
1960
28 Manomet Beach Blvd, Plymouth, MA 02360
$-1,962
Cash flow
-14.6%
Cash-on-Cash Return
2.9%
Cap rate
0.5%
Rent to Value Ratio
Active
$895,000
4
bds
|
4
ba
|
3,160
sqft
|
built
2003
33 Freeman Dr, Plymouth, MA 02360
$-2,435
Cash flow
-14.2%
Cash-on-Cash Return
3.0%
Cap rate
0.5%
Rent to Value Ratio
Active
$997,500
3
bds
|
3
ba
|
2,627
sqft
|
built
2019
35 Briarwood, Plymouth, MA 02360
$-2,635
Cash flow
-13.8%
Cash-on-Cash Return
3.1%
Cap rate
0.5%
Rent to Value Ratio